2348
Fast Advanced Spin-Echo vs. Echo-Planar Imaging: DWI at 3T MR System for Postoperative Clinical Outcome Prediction in NSCLC Patients1Radiology, Fujita Health University School of Medicine, Toyoake, Japan, 2Radiology, Kobe University Graduate School of Medicine, Kobe, Japan, 3Canon Medical Systems Corporation, Otawara, Japan, 4Diagnostic Radiology, Hyogo Cancer Center, Akashi, Japan
Synopsis
No one has compared the capability among DWIs obtained by EPI and FASE at a 3T MR system and PET/CT for prediction of postoperative clinical outcome. We hypothesize that DWI obtained by FASE sequence are more useful than that by EPI sequence at 3T MR system and PET/CT for predicting postoperative recurrence and treatment outcome in NSCLC patients with surgical treatment. The purpose of this study was to directly and prospectively compare the quantitative capability for prediction of postoperative recurrence and treatment outcome among DWI with FASE and EPI sequences at 3T system and FDG-PET/CT in NSCLC patients.
Introduction
In non-small cell lung cancer (NSCLC) patients, surgical treatment is curative treatment strategy in routine clinical practice. Positron emission tomography (PET) or PET fused with CT (PET/CT) combined with [18F] fluoro-2-D-glucose (FDG) and diffusion-weighted MR imaging (DWI) have been suggested as useful to play as predictors for recurrence as well as survival based on previous studies (1-4). In the past decade, DWI has been obtained by Echo Planar Imaging (EPI) sequence at 1.5T and 3T MR systems, although image distortion of DWI at 3T system has been suggested as more severe than that at 1.5T system. Therefore, DWI by fast advanced spin-echo (FASE) has been tested at 3T system (5). No one has compared the capability among DWIs obtained by EPI and FASE at a 3T MR system and PET/CT for prediction of postoperative clinical outcome. We hypothesize that DWI obtained by FASE sequence are more useful than that by EPI sequence at 3T MR system and PET/CT for predicting postoperative recurrence and treatment outcome in NSCLC patients with surgical treatment. The purpose of this study was to directly and prospectively compare the quantitative capability for prediction of postoperative recurrence and treatment outcome among DWI with FASE (FASE-DWI) and EPI (EPI-DWI) sequences at 3T system and FDG-PET/CT in NSCLC patients.Materials and Methods
139 consecutive and pathologically diagnosed NSCLC patients (77 men and 62 women; mean age 71 year) underwent DWIs with FASE and EPI sequences at a 3T system (Vantage Titan 3T, Canon Medical Systems Corporation, Otawara, Japan), FDG-PET/CT, and pathological and follow-up examinations. In each patient, EPI-DWI was obtained with sequentially reordered, half-Fourier, single-shot spin-echo type EPI sequence (TR 1489 ms/ TE 70ms/ ETL 35, b value = 1000s/mm2). In addition, FASE-DWI was performed as another DWI using FASE sequence (TR 16000ms/ TE 7 ms/ ETL 36, b value = 1000s/mm2). According to the follow-up examination, all patients were divided as recurrence (n=28) and non-recurrence (n=111) groups as well as survivor (n=123) and non-survivor (n=16) groups. In each lesion, apparent diffusion coefficients from both sequences (ADCFASE and ADCEPI) and SUVmax were assessed by ROI measurements. To compare all indexes between each two groups, Student’s t-test was performed. Then, ROC analyses were performed to compare distinguishing both two groups among all indexes. Finally, sensitivity, specificity and accuracy for distinguishing each group were compared among all methods by McNemar’s test.Results
Representative case is shown in Figure 1. When compared all indexes between each two group, all indexes have significant difference between recurrence and non-recurrence groups (p<0.05) and between survivor and non-survivor groups (p<0.05). Results of ROC analysis and diagnostic performance for distinguishing between recurrence and non-recurrence groups are shown in Figure 2. Area under the curve (AUC), specificity and accuracy of ADCFASE were significantly larger or higher than those of others (p<0.05). Results of ROC analysis and diagnostic performance for distinguishing non-survivor from survivor groups are shown in Figure 3. Area under the curve (AUC), specificity and accuracy of ADCFASE were significantly larger or higher than those of others (p<0.05). In addition, accuracy of ADCEPI was significantly higher than that of SUVmax (p<0.05).Conclusion
DWI using FASE sequence is considered as the best method for postoperative clinical outcome prediction in NSCLC patients, when compared with DWI using EPI sequence and PET/CT. FASE sequence would be better to be applied for DWI at 3T systemin this setting.Acknowledgements
Authors wish to thank Mr. Katsusuke Kyotani and Prof. Takamichi Murakami in Kobe University Hospital for their valuable contributions to this study.References
- Yabuuchi H, Hatakenaka M, Takayama K, et al. Radiology. 2011 ; 261(2): 598-604.
- Ohno Y, Koyama H, Yoshikawa T, et al. AJR Am J Roentgenol. 2012 ; 198(1): 75-82.
- Tsuchida T, Morikawa M, Demura Y, et al. J Magn Reson Imaging. 2013; 38(1): 80-88.
- Lee HY, Jeong JY, Lee KS, et al. J Magn Reson Imaging. 2013 ; 38(4): 905-913.
- Ohno Y, Koyama H, Yoshikawa T, et al. Eur J Radiol. 2015 ; 84(11): 2321-2331.
Figures
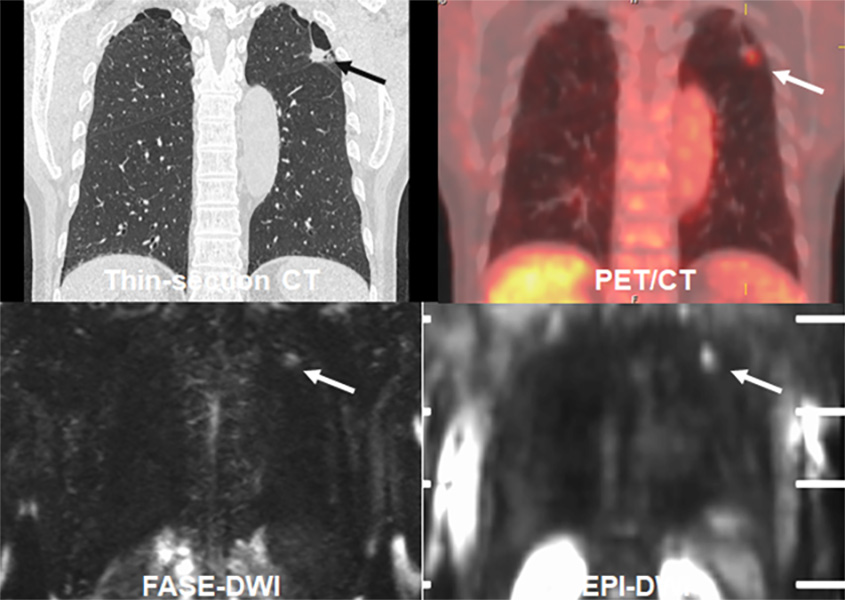
Figure 1. 67-year old male patient with invasive adenocarcinoma (pT1bN0M0 : cStage IA2).
Thin-section CT demonstrates a nodule (arrow) in the left upper lobe. SUVmax of this nodule was 2.5. ADCs with FASE-DWI and EPI-DWI were as follows: 1.06×10⁻³mm2/sec and 1.03×10⁻³mm2/sec. When applied each threshold, this case was assessed as non-recurrence and survivor and considered as true-negative case in this study.
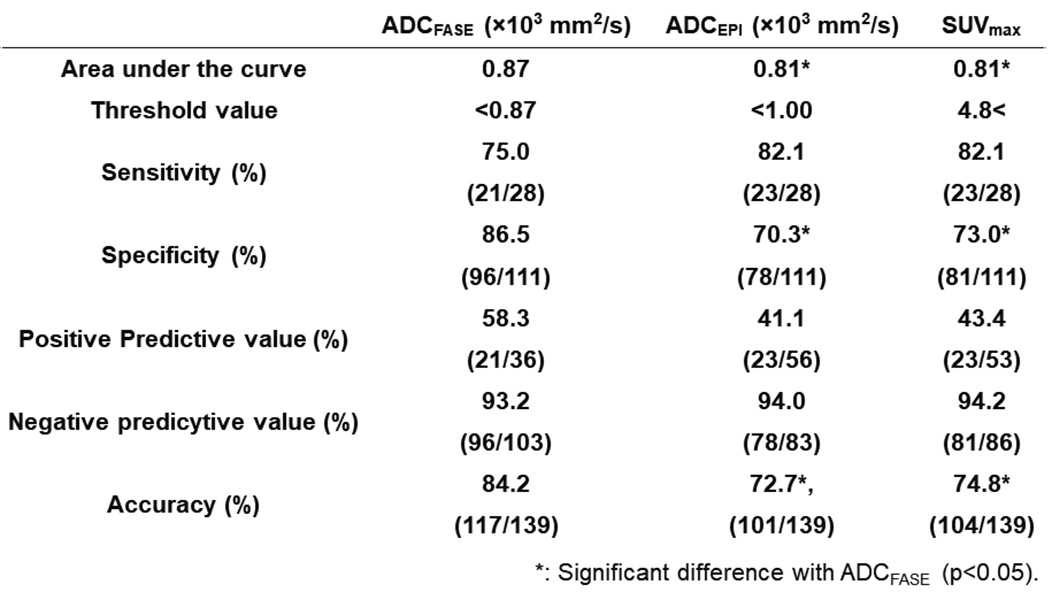
Figure 2. Results of ROC analysis and diagnostic performance for distinguishing between recurrence and non-recurrence groups.
Area under the curve, specificity and accuracy of ADCFASE were significantly larger or higher than those of others (p<0.05).
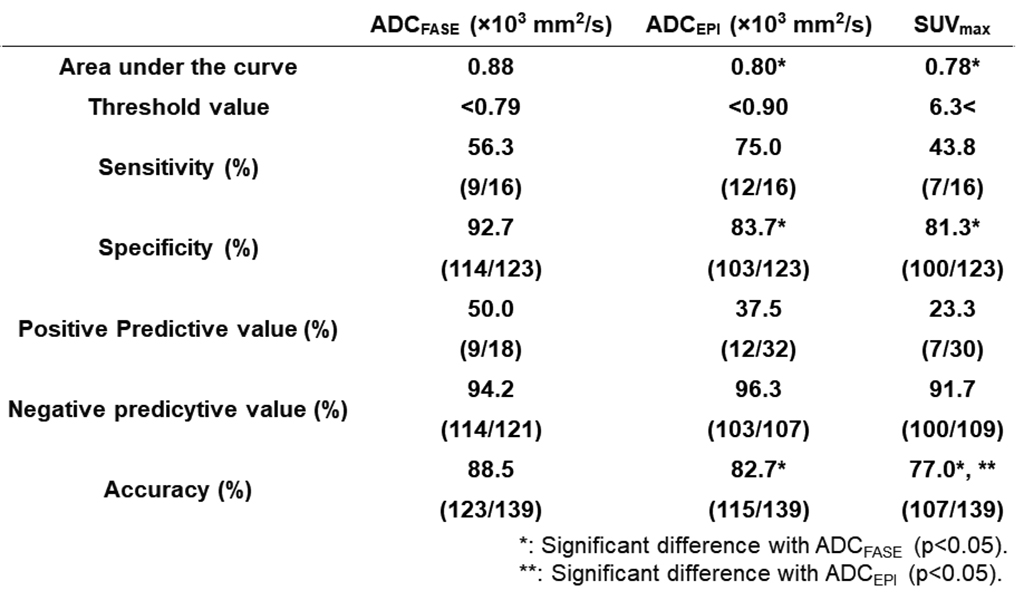
Figure 3. Results of ROC analysis and diagnostic performance for distinguishing non-survivor from survivor groups.
Area under the curve (AUC), specificity and accuracy of ADCFASE were significantly higher than those of others (p<0.05). In addition, accuracy of ADCEPI was significantly higher than that of SUVmax (p<0.05).