2347
The Impact of Acquisition Parameters on Alveolar Septal Wall Thickness Measurements with Hyperpolarized Xenon-129 MRI
Kai Ruppert1, Faraz Amzajerdian1, Yi Xin1, Hooman Hamedani1, Luis Loza1, Tahmina S. Achekzai1, Ryan J. Baron1, Ian F. Duncan1, Harrilla Profka1, Yiwen Qian1, Mehrdad Pourfathi1, Federico Sertic1, Stephen Kadlecek1, and Rahim R. Rizi1
1Radiology, University of Pennsylvania, Philadelhia, PA, United States
1Radiology, University of Pennsylvania, Philadelhia, PA, United States
Synopsis
Measurements of the apparent alveolar septal wall thickness (SWT) with hyperpolarized xenon-129 (HXe) MRI are sensitive to inflammatory or fibrotic pathologies in the lung parenchyma but are also affected by lung inflation level. Here, we investigated the dependence of such measurements on the choice of acquisition parameters in a rabbit model. We found the SWT measurements to be strongly affected by the imaging parameters: in particular, the number and flip angle of the applied RF pulses centered at the dissolved-phase resonances. If this bias is minimized, the previously reported dependence of septal thickness measurements on lung inflation disappears.
Purpose
Measurements of apparent alveolar septal wall thickness (SWT) obtained with hyperpolarized xenon-129 (HXe) MRI are sensitive to inflammatory or fibrotic pathologies in the lung parenchyma1-8 but are also affected by lung inflation level9 as well as physiological variations throughout the breath hold. Here, we investigated the dependence of such measurements on the choice of acquisition parameters in a rabbit model.Methods
Imaging experiments were performed in sedated New Zealand rabbits (approx. 4 kg). Animals were ventilated with room air until imaging began, at which point the gas mix was switched to 20% oxygen and 80% HXe for 5 breaths (6 ml/kg tidal volume), followed by an 8-s breath-hold at either end inspiration (EI) or end expiration (EE). All studies were approved by the Institutional Animal Care and Use Committee.MR imaging was conducted using either a 1D-projection gradient-echo sequence with left-to-right frequency encoding or a chemical shift saturation recovery (CSSR) spectroscopy sequence. The former employed a non-selective 700-μs Gaussian RF excitation pulse centered 3,530 Hz downfield from the gas-phase resonance. The following sequence parameters were used: matrix size 640 or 1920×80; TE 2.6 ms; FOV 220 mm; receiver bandwidth 120 Hz/pixel; flip angle 7-16°, TR 10-50 ms (TR90°,equiv 1.3 - 4 s10). During the breath hold, the dissolved-phase magnetization was saturated 6 times every 500 ms with 3 consecutive 3-ms frequency-selective Gaussian RF pulses centered at 200 ppm and separated by 1.2 ms spoiler gradients. CSSR measurements were conducted with either 8 or 40 delay times varying between 3 and 500 ms, following the same dissolved-phase saturation scheme. All other parameters were as described by Qing et al3. Septal wall thickness was calculated using the analytical uptake model of Patz et al.11, based on the recovery of the averaged total dissolved-phase signal following each saturation pulse. For a direct qualitative comparison between EI and EE, the fitted analytical curves were normalized by the dissolved phase (DP) to gas phase (GP) ratio at a delay time of 100 ms. All MR studies were performed at 1.5T (Avanto; Siemens) using a custom xenon-129 transmit/receive birdcage coil (Stark Contrast, Erlangen, Germany). Enriched xenon gas (87% xenon-129) was polarized using a prototype commercial system (XeBox-E10, Xemed LLC, Durham, NH).
Results and Discussion
Figure 1 illustrates the qualitative differences in the fitted and normalized DP-GP ratios at EE vs EI for six acquisition schemes. In a conventional CSSR acquisition with 40 sequentially increasing delay times (Fig. 1a), a marked qualitative difference between EI and EE measurements is noticeable, which translates into a significant difference in the extracted SWTs (8.8 μm at EE, 12.7 μm at EI). However, if the CSSR study is repeated using only 8 delay times (Fig. 1b), the EE and EI curves are beginning to converge. Similar trends can be observed in the 1D measurements. In three acquisitions with similar TR90°,equivs of approximately 1.3 s (Fig. 1c-e), the DP-GP ratio curves at EE and EI are converging as the excitation flip angle decreases. Finally, if the TR90°,equiv is increased to 4 s (Fig. 1f), the EE and EI uptake curves and the associated gas exchange parameters become essentially indistinguishable. The key difference between the six performed measurements is the total number of DP saturations (in the CSSR studies) or the excitation flip angle (in the 1D studies). High flip angle RF pulses applied to the DP magnetization result in a regional depolarization of the GP magnetization due to gas exchange. This depolarization is therefore weighted by the spatially variable gas exchange efficiency in the lung, which is particularly large at EE. Thus, by preferentially destroying the GP magnetization in fast exchanging lung volumes, the MR acquisition itself imprints a time-varying bias onto the measured DP-GP ratio that is lung inflation-dependent. If this bias is minimized by using fewer RF saturations and/or decreasing the employed flip angles, however, the observed gas uptake curves become qualitatively identical and the dependence of the SWT on lung inflation vanishes. Sampling the entire uptake curve after each DP saturation, as performed for the 1D acquisition, proved to be particular robust.Conclusion
We demonstrated the dependence of the observed pulmonary xenon gas uptake on the MR acquisition parameters. Measurements that employ high flip angles selectively destroy the GP magnetization in lung volumes with high gas exchange. If this effect is minimized, the previously reported SWT dependence on lung inflation disappears.Acknowledgements
Supported by NIH grants R01 EB015767, R01 HL129805, S10 OD018203 and R01 CA193050.References
[1] Ruppert K et al. NMR of hyperpolarized 129Xe in the canine chest: spectral dynamics during a breath-hold. NMR Biomed 2000;13:220-228. [2] Butler JP et al. Measuring surface-area-to-volume ratios in soft porous materials using laser-polarized xenon interphase exchange nuclear magnetic resonance. J Phys Condens Matter 2002;14:L297-L304. [3] Qing et al. Assessment of lung function in asthma and COPD using hyperpolarized 129Xe chemical shift saturation recovery spectroscopy and dissolved-phase MRI. NMR in Biomed 2014;27(12):1490-1501. [4] Zhong et al. Simultaneous assessment of both lung morphometry and gas exchange function within a single breath‐hold by hyperpolarized 129Xe MRI. NMR in Biomed 2017; 30(8). [5] Doganay et al. Quantification of regional early stage gas exchange changes using hyperpolarized 129Xe MRI in a rat model of radiation-induced lung injury. Med Phys 2016;43(5):2410-2420. [6] Kern et al. Regional investigation of lung function and microstructure 129Xe chemical shift saturation recovery parameters by localized and dissolved‐phase imaging: A reproducibility study. MRM 2019; 81(1):13-24. [7] Kern et al. Mapping of regional lung microstructural parameters using 129 Xe dissolved‐phase MRI in healthy volunteers hyperpolarized and patients with chronic obstructive pulmonary disease. MRM 2018; 81(4):2360-2373. [8] Zanette et al. Physiological gas exchange mapping of hyperpolarized 129Xe using spiral-IDEAL and MOXE in a model of regional radiation-induced lung injury. Med Phys 2018;45(2):803-816. [9] Stewart et al. Reproducibility of quantitative indices of lung function and microstructure from 129 Xe chemical shift saturation recovery (CSSR) MR spectroscopy. MRM 2017; 77(6):2107-2113. [10] Ruppert et al. Assessment of flip angle-TR equivalence for standardized dissolved-phase imaging of the lung with hyperpolarized 129Xe MRI. MRM 2019; 81(3):1784-1794. [11] Patz et al. Diffusion of hyperpolarized 129Xe in the lung: a simplified model of 129Xe septal uptake and experimental results. New J Physics 2011;13:015009.Figures
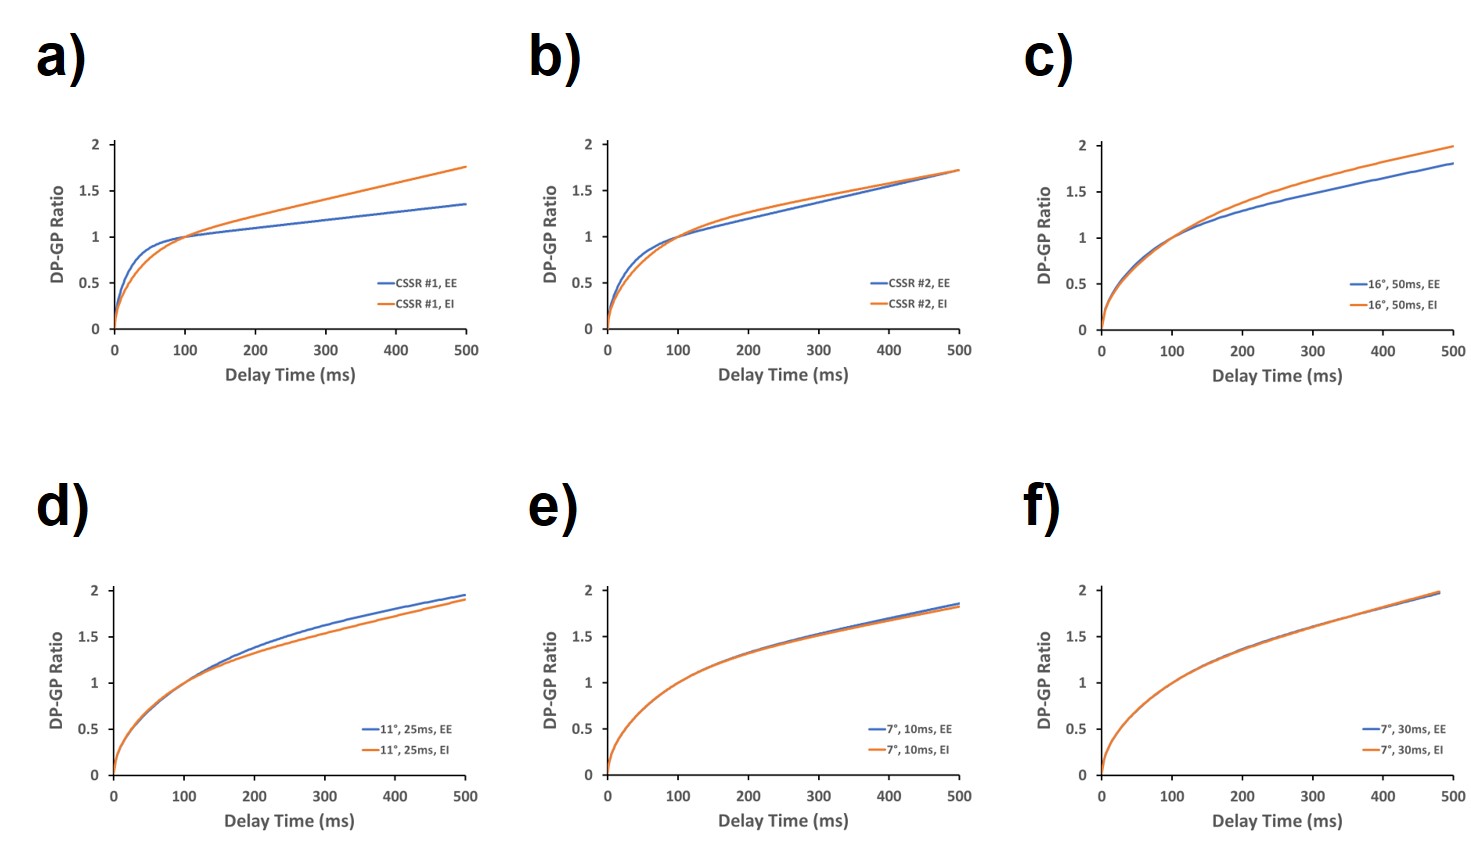
Figure 1. Fitted xenon uptake curves from measurements at EE
and EI with different MR acquisition parameters. a) CSSR with 40 DP
saturations; b) CSSR with 8 DP saturations; c) 1D acquisition with flip angle
16° and TR 50 ms; d) 1D acquisition with flip angle 11° and TR 25 ms; e) 1D acquisition
with flip angle 7° and TR 10 ms; c) 1D acquisition with flip angle 7° and TR 30
ms.