2346
Evaluation of Ventilation Function Using 3D Ultrashort Echo-Time Imaging Without Exogeneous Gases1Department of Biomedical Engineering, Sungkyunkwan University, Suwon, Republic of Korea, 2Department of Biomedical Engineering, Hankuk University of Foreign Studies, Yongin, Republic of Korea, 3Department of Radiology and Center for Imaging Science, Samsung Medical Center, Seoul, Republic of Korea, 4Center for Neuroscience Imaging Research, Institute for Basic Science, Suwon, Republic of Korea
Synopsis
Lung MRI is widely used for diagnosis pulmonary disease, there has been continuing interest in the possibility of using MRI to detect the pulmonary lesion. Recent works acquired ventilation defect region using ventilation map. Here we proposed another method, which evaluates ventilation flow map and regional fractional ventilation flow-volume loop using 3D UTE. These methods provide valuable information to evaluate pulmonary ventilation function as well as ventilation map. The potential of methods was demonstrated by different ventilation flow map and regional fractional ventilation flow volume loops in healthy subjects.
Introduction
Lung MRI has several challenging issues such as short T2*, low proton density, and large magnetic susceptibility difference between lung tissue and air. Most of the challenges in lung MRI can be overcome by using ultrashort echo time (UTE) imaging techniques1. UTE Lung MRI can be used not only for providing the structural information, but also for providing some functional information like a ventilation map, e.g., in oxygen enhanced MRI2, 3 and SENSEFUL-MRI4. The ventilation map is typically obtained by calculating the voxel-wise signal difference between end-inspiration and end-expiration after image registration, and defect regions appear dark in the ventilation map showing little signal difference, that is, dysfunction in ventilation5,6. In this study, we suggest another functional map that can evaluate air flow in ventilation as well as regional fractional ventilation flow-volume loops7 in 3D UTE-MRI.Methods
Regional FV flow-volume loop: The FV flow-volume loop introduced in the 2D PREFUL-MRI7 was evaluated for 10 segmented regions of the lung, i.e., 5 regions in each right and left lung, respectively (Fig.3C).Ventilation map: The ventilation map[%] was calculated in a typical way, that is,$$Ventilation=\frac{S(\text{end_expiration})-S(\text{end_inspiration})}{S(\text{end_expiration})}×100.$$
Ventilation flow map: To generate an air flow map in ventilation, we employed the concept of the fractional ventilation (FV) flow which is a physical quantity that corresponds to the longitudinal axis of the FV flow-volume loops mentioned above. The ventilation flow[%] is defined as $$\text{Ventilation flow}= \frac{∆FV}{∆t},\text{where FV} =\frac{S(\text{end_expiration})-S(t)}{S(\text{end_expiration})}×100.$$
The ventilation flow map is then determined by calculating the voxel-wise difference between the maximum and minimum ventilation flow.
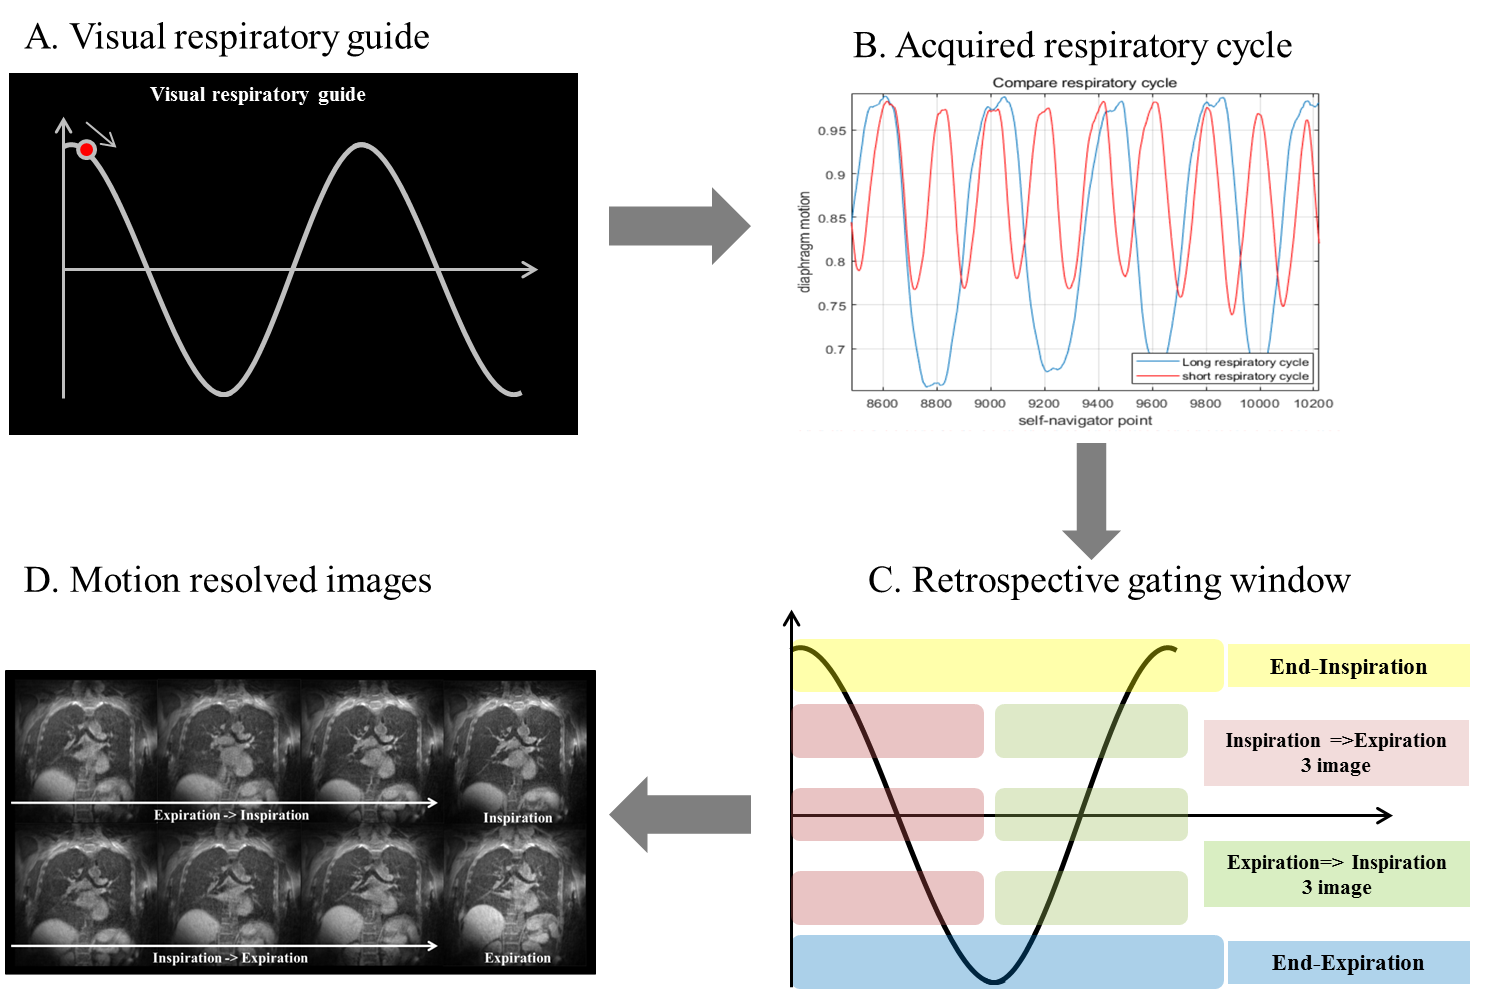
Long breathing vs. short breathing: To validate the ventilation flow map as well as the FV flow-volume loop, a volunteer was instructed to have a long breathing in one scan and a short breathing in another scan with a period of 14 s and 7 s, respectively. A visual guidance to a respiratory motion was presented to the volunteer during the experiment (Fig.1A), displaying the simulated sinusoidal waves for long breathing and short breathing with the same amplitude but with a different period (14s and 7s).
Imaging: This study was approved by the Institutional Review Board of Sungkyunkwan University and performed in full accordance with guidelines. Two healthy volunteers were scanned at Siemens 3T (Prisma) using a 26-channel reception coil. For all experiments, a gradient-echo-based 3D UTE sequence called CODE (Concurrent-Dephasing-and-Excitation) was used with fat suppression using a spectral preparation pulse8,9. Scan parameters were: TR/TE = 2.3/0.15ms, FOV = 400mm3, FA = 5°, number of projections = 200k, matrix size = 2003, isotropic resolution = 2 mm3. A fat saturation pulse was applied every ten TR. A retrospective respiratory gating was performed having eight respiratory phases including end-expiration and end-inspiration. The number of radial views at each respiratory phase was same as 15,000. A self-navigation method developed by our group was used to trace the respiratory motion10.
Data Processing and Analysis: Images were reconstructed with a home-built MATLAB program using FFT with gridding. Image registration and volume segmentation were performed using ANTs and ITK-SNAP, respectively.
Results and Discussion
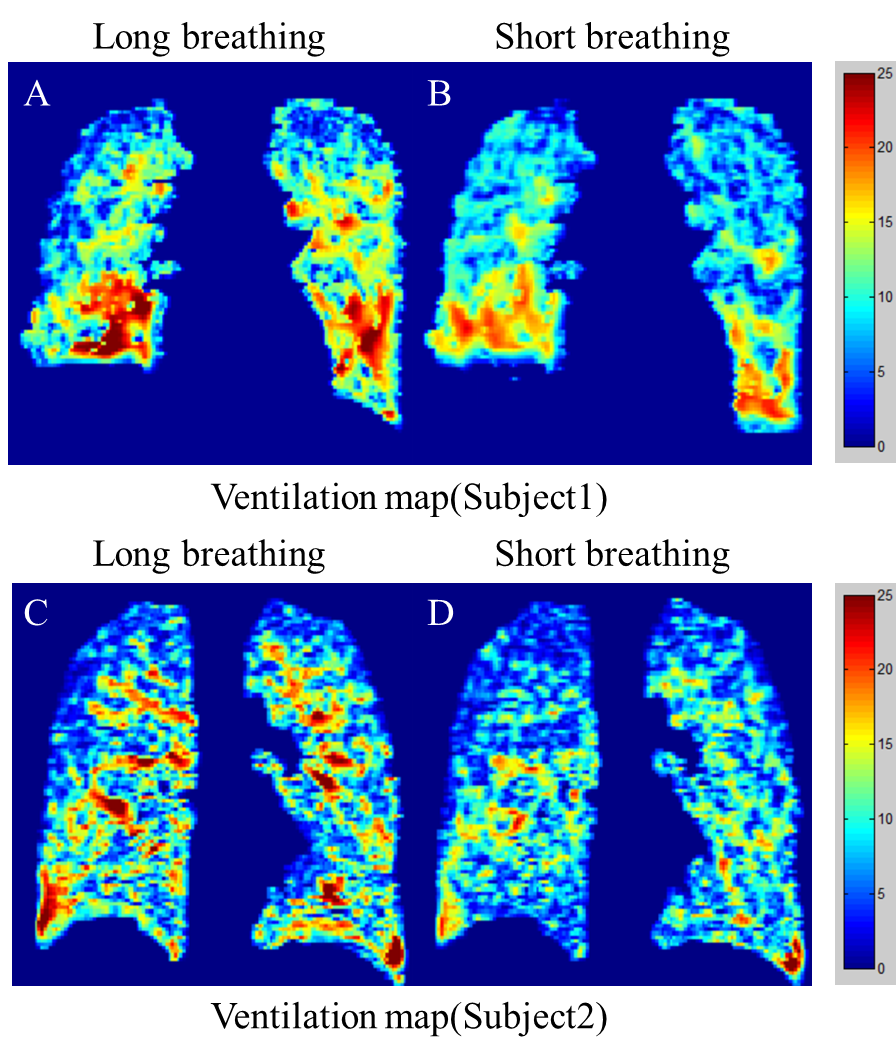
Figure 1 show the acquired respiratory cycles for both long and short breathing (Fig.1B). Although the visual guidance was displaying the sinusoidal waves with same amplitude for long and short breathing, the real amplitudes of the two respiratory cycles were different, that is, larger amplitude in long breathing. Figure 3 shows the FV flow-volume loops obtained from the whole lung (A) and the 10 segmented regions (B) demarcated as shown in Fig.3C. In terms of long vs. short breathing, the amplitude of the FV flow in the ordinate was larger in short breathing as expected since short breathing has higher ventilation rate. However, the amplitude of the FV in the abscissa was smaller in short breathing because of larger amplitude of long breathing in the respiratory cycle in Fig.1B. In terms of the segmented regions, the size of the flow-volume loop became larger in the lower lobes and smaller in the upper lobes as already known (Fig.3B). Figures 4 and 5 show the ventilation maps and the ventilation flow maps, respectively, which present two types of voxel-wise information about the ventilation function, i.e., one is for ventilation itself and the other for the ventilation rate. As expected from the flow-volume loop in Fig.3, overall ventilation looks higher in long breathing (Figs.4A,C) than short breathing (Figs.4 B,D) in the ventilation map, and overall ventilation flow looks shorter in long breathing (Figs.5A,C) than short breathing (Figs.5B,D) because ventilation rate is expected be higher in short breathing.Conclusion
For improved evaluation of ventilation function, we here proposed a voxel-wise ventilation flow map as well as regional FV flow-volume loop in the 10 segmented lung regions. These methods are expected to provide valuable information of ventilation function along with the ventilation map which was very recently developed. From a diagnostic standpoint, the ventilation flow map might be helpful for airway disease and the regional FV flow-volume loops can be used to evaluate two types of ventilation function simultaneously, i.e., ventilation and ventilation rate, in different lung regions. A further study is warranted for a large cohort of subjects including the patients with obstructive and restrictive pulmonary diseases.Acknowledgements
This study was supported by National Research Foundation of Korea NRF-2017R1A2B2004944 and NRF-2018-Global Ph.D. Fellowship Program.References
1. Bergin CJ, Pauly JM, Macovski A. Lung parenchyma : projection reconstruction MR imaging. Radiology. 1991;179(3):777-781.
2. Wei Zha et al. Pulmonary Ventilation Imaging in Asthma and Cystic Fibrosis Using Oxygen-Enhanced 3D Radial Ultrashort Echo Time MRI. J Magn Reson Imaging. 2018 May;47(5):1287-1297.
3. J Kruger et al. Oxygen-Enhanced 3D Radial Ultrashort Echo Time Magnetic Resonance Imaging in the Healthy Human Lung. NMR Biomed. 2014 Dec; 27(12): 1535–1541.
4. Mendes Pereira et al. UTE-SENSCEFUL: first results for 3D high-resolution lung ventilation imaging. Magn. Reson. Med. 2018;1-10
5. Zapke M et al. Magnetic resonance lung function a breakthrough for lung imaging and functional assessment? A phantom study and clinical trial. Respir Res. 2006 Aug 6;7:106.
6. Tanguy Boucneau et al. 3D Magnetic Resonance Spirometry, Proc. Intl. Soc. Mag. Reson. Med. 27 (2019), 0002
7. Andreas Voskrebenzev et al. Feasibility of quantitative regional ventilation and perfusion mapping with phase‐resolved functional lung (PREFUL) MRI in healthy volunteers and COPD, CTEPH, and CF patients. Magn. Reson. Med. 2018;Apr;79(4):2306-2314
8. Park JY et al. Short echo-time 3D radial gradient-echo MRI using concurrent dephasing and excitation. Magn. Reson. Med. 2012; 67 (2): 428–436.
9. Jinil Park et al. A radial sampling strategy for uniform k-space coverage with retrospective respiratory gating in 3D ultrashort-echo-time lung imaging. NMR Biomed. 2016; 29: 576–587.
10. Jinil Park et al. A Robust Self-navigation for Respiratory Gating in 3D Radial Ultrashort Echo-time Lung MRI using Concurrent Dephasing and Excitation. Journal of the Korean Physical Society, Vol. 73, No. 1, July 2018, pp. 138∼144.
Figures