2344
Resolving the discrepancy between theoretical and experimental polarization of HP 129Xe using numerical simulations and optical spectroscopy1Physics and Astronomy, University of North Carolina - Chapel Hill, Chapel Hill, NC, United States
Synopsis
For emerging biomedical applications of hyperpolarized xenon, the ability to obtain high nuclear spin polarization levels is imperative. Yet, experimental nuclear spin polarization levels of xenon obtained by continuous flow spin-exchange optical pumping are highly variable and often well below theoretical predictions. Identifying possible depolarization mechanisms has been the focus of those trying to rectify this discrepancy. Instead, we revisit assumptions made about the physical system. By using a combination of numerical simulations and in situ optical spectroscopy measurements, we found that lower Rb densities and shorter residence times than typically assumed lead to lower, not higher, theoretical polarization values.
Introduction
Despite rigorous and well-studied theoretical models for hyperpolarization and continuous flow spin-exchange optical pumping (SEOP), there remains a substantial discrepancy between the theoretical and experimental polarization of 129Xe; inexplicably, seemingly similar experimental setups can yield very different polarization values.1–3 The main focus on resolving this discrepancy has been to identify possible depolarization mechanisms. Instead, this study reexamines the assumptions made about the physical system. Specifically, for mathematical convenience, current theoretical treatments of continuous flow SEOP assume that liquid Rb inside the optical cell is in thermal equilibrium with its vapor. In the case of continuous flow SEOP, where cold gas is flowed atop a pool of hot liquid Rb, the Rb vapor density and distribution inside the optical cell can deviate significantly from thermal equilibrium values. Yet, models for homogeneous, temperature dependent Rb distributions, such as the Smithells and the Killian formula, are standard.4,5 The validity of these assumptions are investigated through finite element analysis simulations of fluid dynamics inside the optical cell during SEOP, while in situ optical measurements were used to validate the results of the simulations.Methods
Three different models of commercially available optical cells were built in SOLIDWORKS for finite element simulations in COMSOL Multiphysics. The contribution of laser heat and resultant Rb density were found using iterative methods. Particle tracings were used to calculate the distribution of residence times in the cells. To validate the simulations, atomic absorption spectroscopy was used to directly measure the Rb density inside the optical cell during continuous flow. Measurements were done during three stages in the lifetime of an optical cell: 1) a brand-new cell; 2) a well broken in, high functioning cell; 3) the same cell, when polarization started to decrease substantially.Results
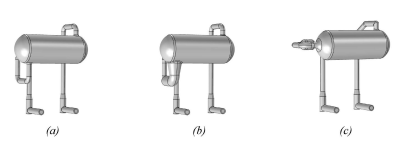
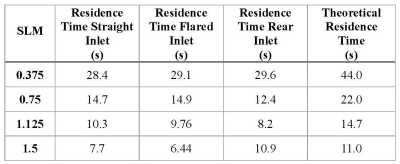
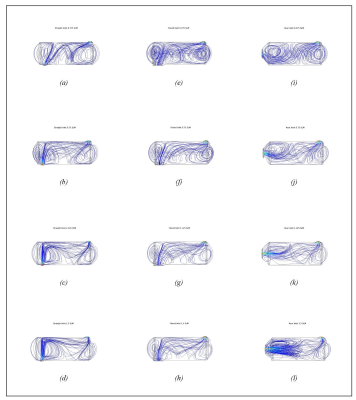
The velocity fields based on flow rate are shown in Fig. 2 for three different cell geometries, all with the same main body volume. These simulations reveal that the mean residency time of the gas inside the optical cell depends on the specific cell geometry, with the largest deviation from the commonly used relation tres=Vcell/Q at low flow rates (Table 1). The simulations also point towards a Rb density that is an order of magnitude smaller than what empirical models predict. This is not surprising as some have measured Rb densities factors of 2-3 lower than what is predicted by the Killian formula, even in closed cells.6,7 The absorption measurements also confirm a Rb density that diverges significantly from the empirical models. When new cells are installed, during their initial use, the Rb density is typically low, at an average of 6.9x10¹⁷ m-3. Broken-in cells, on the other hand, have the highest Rb density. For our broken-in cell, at the top of its performance, Rb density was approximately 3.1x10¹⁸ m-3. When the polarization started to rapidly decrease, the Rb density in the same cell appeared to be an order of magnitude smaller at 2.4x10¹⁷ m-3.Discussion
From the simulations of three different full-size optical cell models, it is apparent that the geometry, not just the volume, matters. For the exact same cell volume, the geometry and location of the cell inlet leads to different residence times. In all cases, residence times are shorter than what theory predicts, especially at the lowest flow rates, where the largest deviance from theory is typically observed. The simulations and absorption measurements show that in most cases, during normal continuous flow SEOP, the Rb density is substantially lower than predicted by the Killian formula. It is not until the walls are also fully coated that the density appears to reach an order of magnitude that is comparable to that suggested by the Killian formula. This is why optical cells have a breaking-in period – even if the presaturation coil temperature is raised substantially, the Rb density will still be much lower than expected until the walls are coated. This can be seen in our own experimental data of the brand-new optical cell installed on our polarizer. It should be noted that the computational solutions are for the steady state case, thus the Rb density should be thought of as the upper limit.Conclusion
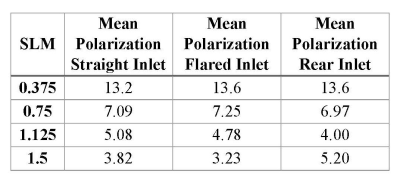
The discrepancy between the polarization given by SEOP theory and what is experimentally achieved can thus be attributed to two sources: a) a reduction in the residence time of the gas inside the cell; b) a lower Rb density than what is theoretically assumed. Interestingly, as revealed by Table 2, when both are corrected, theoretical polarization values are actually lower than what is achieved experimentally, suggesting that other assumptions made in the theoretical model must also be incorrect.Acknowledgements
This material is based upon work supported by the National Science Foundation Graduate Research Fellowship under Grant No. DGS-1650116.References
1. Fink, A. & Brunner, E. Optimization of continuous flow pump cells used for the production of hyperpolarized 129Xe: A theoretical study. Appl. Phys. B Lasers Opt. 89, 65–71 (2007).
2. Norquay, G., Parnell, S. R., Xu, X., Parra-Robles, J. & Wild, J. M. Optimized production of hyperpolarized 129 Xe at 2 bars for in vivo lung magnetic resonance imaging. J. Appl. Phys. 113, 044908 (2013).
3. Ruset, I. C. Hyperpolarized xenon-129 production and applications. Univ. New Hampshire (2005).
4. Killian, T. J. Thermionic Phenomena Caused By Vapors of Rubidium and Potassium. Phys. Rev. 27, 578–587 (1926).
5. Smithells, C. J. Metal Reference Book. (Interscience Publishers, 1955).
6. Chann, B., Babcock, E., Anderson, L. W. & Walker, T. G. Measurements of 3He spin-exchange rates. Phys. Rev. A - At. Mol. Opt. Phys. 66, 9 (2002).
7. Shao, W., Wang, G. & Hughes, E. W. Measurement of spin-exchange rate constants between Xe129 and alkali metals. Phys. Rev. A - At. Mol. Opt. Phys. 72, 1–10 (2005).
Figures


