2342
Evaluating the accuracy of time-domain Voigt fitting of dissolved-phase 129Xe spectra in the lungs1POLARIS, Infection, Immunity and Cardiovascular Disease, University of Sheffield, Sheffield, United Kingdom
Synopsis
This work quantifies the accuracy of time-domain Voigt fitting of dissolved-phase 129Xe peak parameters (xenon in red blood cells and tissue/blood plasma). It is shown that time-domain Voigt fitting of dissolved-phase 129Xe resonances in the lungs is accurate to within 5% when the SNR values of the spectra are >100 and the gas phase resonance amplitude is < factor of 2 higher than each of the dissolved-phase 129Xe resonances.
Introduction
MR imaging and spectroscopy of 129Xe dissolved in pulmonary red blood cells (RBCs) and parenchymal tissue/plasma (TP) is of interest for investigating gas (G) exchange dynamics in a range of pulmonary pathologies1,2,3. Key to the success of dissolved-phase 129Xe spectroscopy and imaging is the ability to reliably measure the signal amplitude and chemical shift of 129Xe in RBCs and TP within an MR acquisition. While previous studies considered dissolved-phase 129Xe spectra as consisting of two simple Lorentzian RBC and TP resonances, recent work with time-domain (TD) Voigt fitting suggests that the TP resonance is more structured with a measurable Gaussian component to its linewidth4 . Within this study we evaluate the accuracy of fitting the G, RBC and TP 129Xe resonances with a TD Voigt function over a range of SNR values by comparing fitted peak parameters with peak parameters from synthetically generated FIDs.Methods
The time-domain Voigt function $$$\nu(t)$$$ used for data fitting to the real and imaginary parts of the synthetic FIDs is given by$$Re[\nu(t)]=\sum_{n=1}^3A_{n}\exp(-\pi\Gamma_{n}^lt)\exp\left[-\left(\frac{\pi\Gamma_{n}^gt}{2\sqrt{\ln2}}\right)^2\right]\cos[(\omega_{0,n}-\omega_{t})t+\phi_{n}]\quad\quad\quad \\ Im[\nu(t)]=\sum_{n=1}^3A_{n}\exp(-\pi\Gamma_{n}^lt)\exp\left[-\left(\frac{\pi\Gamma_{n}^gt}{2\sqrt{\ln2}}\right)^2\right]\sin[(\omega_{0,n}-\omega_{t})t+\phi_{n}]\quad\quad(1)$$ where $$$A$$$ is FID the amplitude, $$$\Gamma^{l}$$$ and $$$\Gamma^{g}$$$ are Lorentzian and Gaussian linewidths, $$$\omega_0-\omega_{t}=\Delta\omega$$$ is frequency difference between the resonance frequency and RF transmit frequency and $$$\phi$$$ is the phase of the $$$n=$$$(G,TP,RBC) 129Xe resonant peaks. (N.B. For a given time-domain Gaussian function defined by $$$g(t)=A\exp(-t^2/2\sigma_t^2)$$$, where $$$\sigma_t^2$$$ describes the TD width, it possible to replace $$$\sigma_{t}$$$ for the FWHM $$$\Gamma^g=\sqrt{2\ln{2}}/\pi\sigma_t$$$ of the corresponding FD Gaussian function $$$G(f)=A\sigma_t\sqrt{2\pi}\exp[-2(\pi\sigma_tf)^2]$$$ s.t the TD Gaussian function is written as $$$g(t)=A\exp[-(\pi\Gamma^gt/2\sqrt{\ln2})^2]$$$.)FIDs (BW $$$=$$$ 16 kHz, samples $$$=$$$ 512) were generated in MATLAB with fixed RBC ($$$A=$$$ 0.25, $$$\Gamma^l=$$$ 180 Hz, $$$\Gamma^g=$$$ 0 Hz, $$$\phi=-$$$ 1.94 rad, $$$\Delta\omega=-$$$778 rad-1) and TP ($$$A=$$$ 0.5, $$$\Gamma^l=$$$ 150 Hz, $$$\Gamma^g=$$$ 100 Hz, $$$\phi=-$$$ 0.55 rad, $$$\Delta\omega=$$$1,221 rad-1) peak parameters and variable G amplitudes ($$$A=$$$ 0.1 to 1, $$$\Gamma^l=$$$25 Hz, $$$\Gamma^g=$$$ 0 Hz, $$$\phi=$$$ 0.13 rad, $$$\Delta\omega=$$$ 23,190 rad-1 ). Complex Gaussian white noise ranging from $$$N=5\times10^{-4}$$$ to $$$2.5\times10^{-2}$$$ (SD in real part of time domain) was added to all FIDs. 50 synthetic FIDs with varying G amplitudes and noise levels were generated resulting in a total of 50×20×21 = 21,000 (20 noise values, 21 G amplitudes) to be fitted with Eq. 1 using the non-linear Levenberg-Marquardt least squares algorithm. The accuracy of each fitted parameter was calculated from the mean absolute percentage error $$ M=\frac{100\%}{n}\sum^n_{t=1}\vert\frac{A_{t}-F_{t}}{A_t}\vert \quad\quad (2) $$ where $$$n=$$$ 50 FIDs, and $$$A_{t}$$$ and $$$F_{t}$$$ are the actual and fitted values of the peak parameters for varying noise levels and G amplitudes. The initial parameter guesses prior to fitting were as follows: RBC peak: $$$A=$$$ 0.5, $$$\Gamma^l=$$$ 100 Hz, $$$\Gamma^g=$$$ 0 Hz, $$$\phi=$$$ 0 rad, $$$\Delta\omega=-$$$500 rad-1; TP peak $$$A=$$$ 0.5, $$$\Gamma^l=$$$ 100 Hz, $$$\Gamma^g=$$$ 100 Hz, $$$\phi=$$$ 0 rad, $$$\Delta\omega=$$$ 1,000 rad-1 ; G peak: $$$A=$$$ 0.5, $$$\Gamma^l=$$$ 10 Hz, $$$\Gamma^g=$$$ 0 Hz, $$$\phi=$$$ 0 rad, $$$\Delta\omega=$$$ 20,000 rad-1.
Results and Discussion
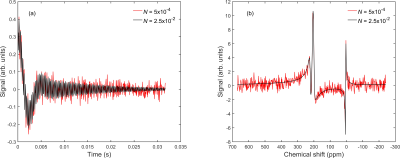
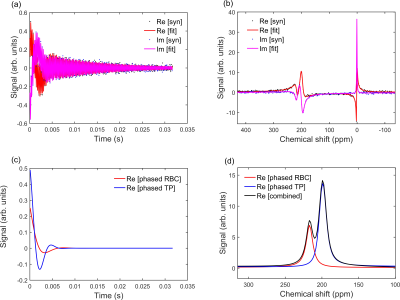
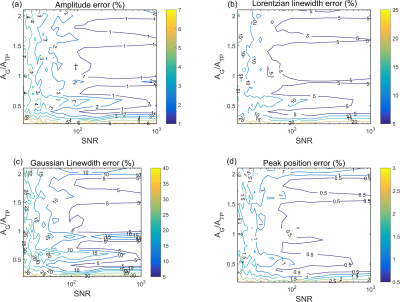
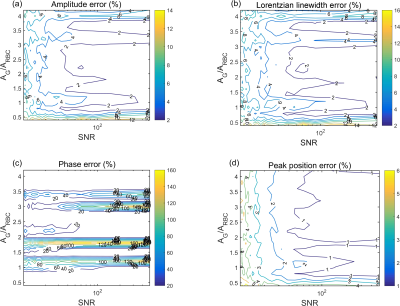
Fig. 1 (a) and (b) show synthetic FIDs in the time- and frequency-domain, respectively for the lower ($$$N=5\times10^{-4}$$$) and upper ($$$2.5\times10^{-2}$$$ ) noise levels and a G amplitude of 0.2. Fig. 2 shows a representative Voigt fit for a noise level of 0.0113 (TP SNR = 44, RBC SNR = 22). The mean absolute percentage error of the fitted TP, RBC 129Xe peak parameters are shown as contour plots in Figs. 3 and 4, respectively.The contour plots from the TP resonance show that all peak parameters have <5% error for SNR values >100 and a G:TP ratio of ~1.25; the contour plots from the RBC resonance show that the all peak parameters have <5% error for SNR values >100 and a G:TP ratio of ~2.5. For both TP and RBC resonances, the highest error in peak parameters is for low gas amplitudes, suggesting an inherent error in the fitting routine when the intial guess for the gas amplitude is much higher than the actual gas amplitude. For SNRs below 100, the parameter with the largest fitting error for the TP resonance is the Gaussian linewidth, which has an error of 15-20% for SNR values lower than 50.
The data in Figs. 3 and 4 show that if that gas amplitude is a factor of ~2 higher, there is a resulting error of >5% for all TP peak parameters at SNRs <100 and a resulting error of >5% for all RBC peak parameters at all SNR values. Fig 4 (c) shows a high intermittent error in the phase for the RBC resonance, which is most likely due to the initial guess for the RBC phase of 0 rad being far away from the actual phase of -1.94 rad, suggesting error sensitivity to poor initial guess for the RBC phase. Further work quantifying the effect of the initial starting guess on peak parameter accuracy prior to fitting is underway.
Conclusions
It has been shown that time-domain Voigt fitting results in <5% error for 129 Xe TP and RBC peak parameters for SNR values of >100 and gas:dissolved amplitude ratios of <2. This work should enable accuracy quantification of TP and RBC >129Xe resonances for any ongoing in vivo spectroscopy studies of 129 Xe in the lungs.Acknowledgements
I would like to thank Paul Hughes, Laura Saunders and Guilhem Collier for useful conversations throughout this study.
References
[1] Wang Z, et al., Quantitative analysis of hyperpolarized 129Xe Gas Transfer MRI. Medical Physics. 44(6), 2017.
[2] Kaushik SS, et al., Measuring diffusion limitation with a perfusion-limited gas—Hyperpolarized 129Xe gas-transfer spectroscopy in patients with idiopathic pulmonary fibrosis. Journal of Applied Physiology. 117(6), 2014.
[3] Weatherley ND, et al., Hyperpolarised xenon magnetic resonance spectroscopy for the longitudinal assessment of changes in gas diffusion in IPF. Thorax. 74(5), 2019.
[4] Bier et al., A protocol for quantifying cardiogenic oscillations in dynamic 129Xe gas exchange spectroscopy: The effects of idiopathic pulmonary fibrosis. NMR in Biomedicine. 32(1), 2019.
Figures


