2341
Rapid 3D B1+-Compensated, Simultaneous Whole Breast T1, T2, and Apparent Diffusion Coefficient Quantification with MR Multitasking1Department of Bioengineering, University of California, Los Angeles, Los Angeles, CA, United States, 2Biomedical Imaging Research Institute, Cedars-Sinai Medical Center, Los Angeles, CA, United States
Synopsis
Quantitative relaxation and diffusion mapping are desirable in clinical breast MRI as biomarkers for tissue characterization and prediction of treatment response. Conventional multi-parametric mappings are typically acquired in separate scans. We simultaneously generate high quality, co-registered T1/T2/ADC maps without image distortion for 3D whole breast coverage in 8.5min, incorporating B1+ compensation into the Multitasking framework to improve T1 accuracy. We demonstrate excellent agreement of T1/T2/ADC measurements between the proposed Multitasking approach and available reference methods, as well as good repeatability. We also show that all T1/T2/ADC measurements produced by the Multitasking framework agree with literature range.
Introduction
Quantitative T1/T2/ADC mapping allow characterization of subtle changes in tissue biomarkers, and are promising for early detection, discrimination of benign and malignant tumors, and prediction of treatment response in clinical breast MRI1-5. However, quantitative multi-parametric MRI is typically performed in separate 2D acquisitions, which is time-consuming and may suffer from inter-scan motion and image distortion. We previously developed a whole-brain simultaneous T1/T2/ADC quantification approach using the Multitasking framework6. In breast MRI, however, the significant nonuniformity of the B1+ field can result in inaccurate T1 measurements7-8. We extended the previously proposed Multitasking framework to achieve rapid, simultaneous whole-breast T1/T2/ADC quantification, incorporating a separately acquired B1+ map to compensate for the nonuniform B1+ variation. The agreement with reference approaches/literature values and measurement repeatability are evaluated in healthy subjects.Methods
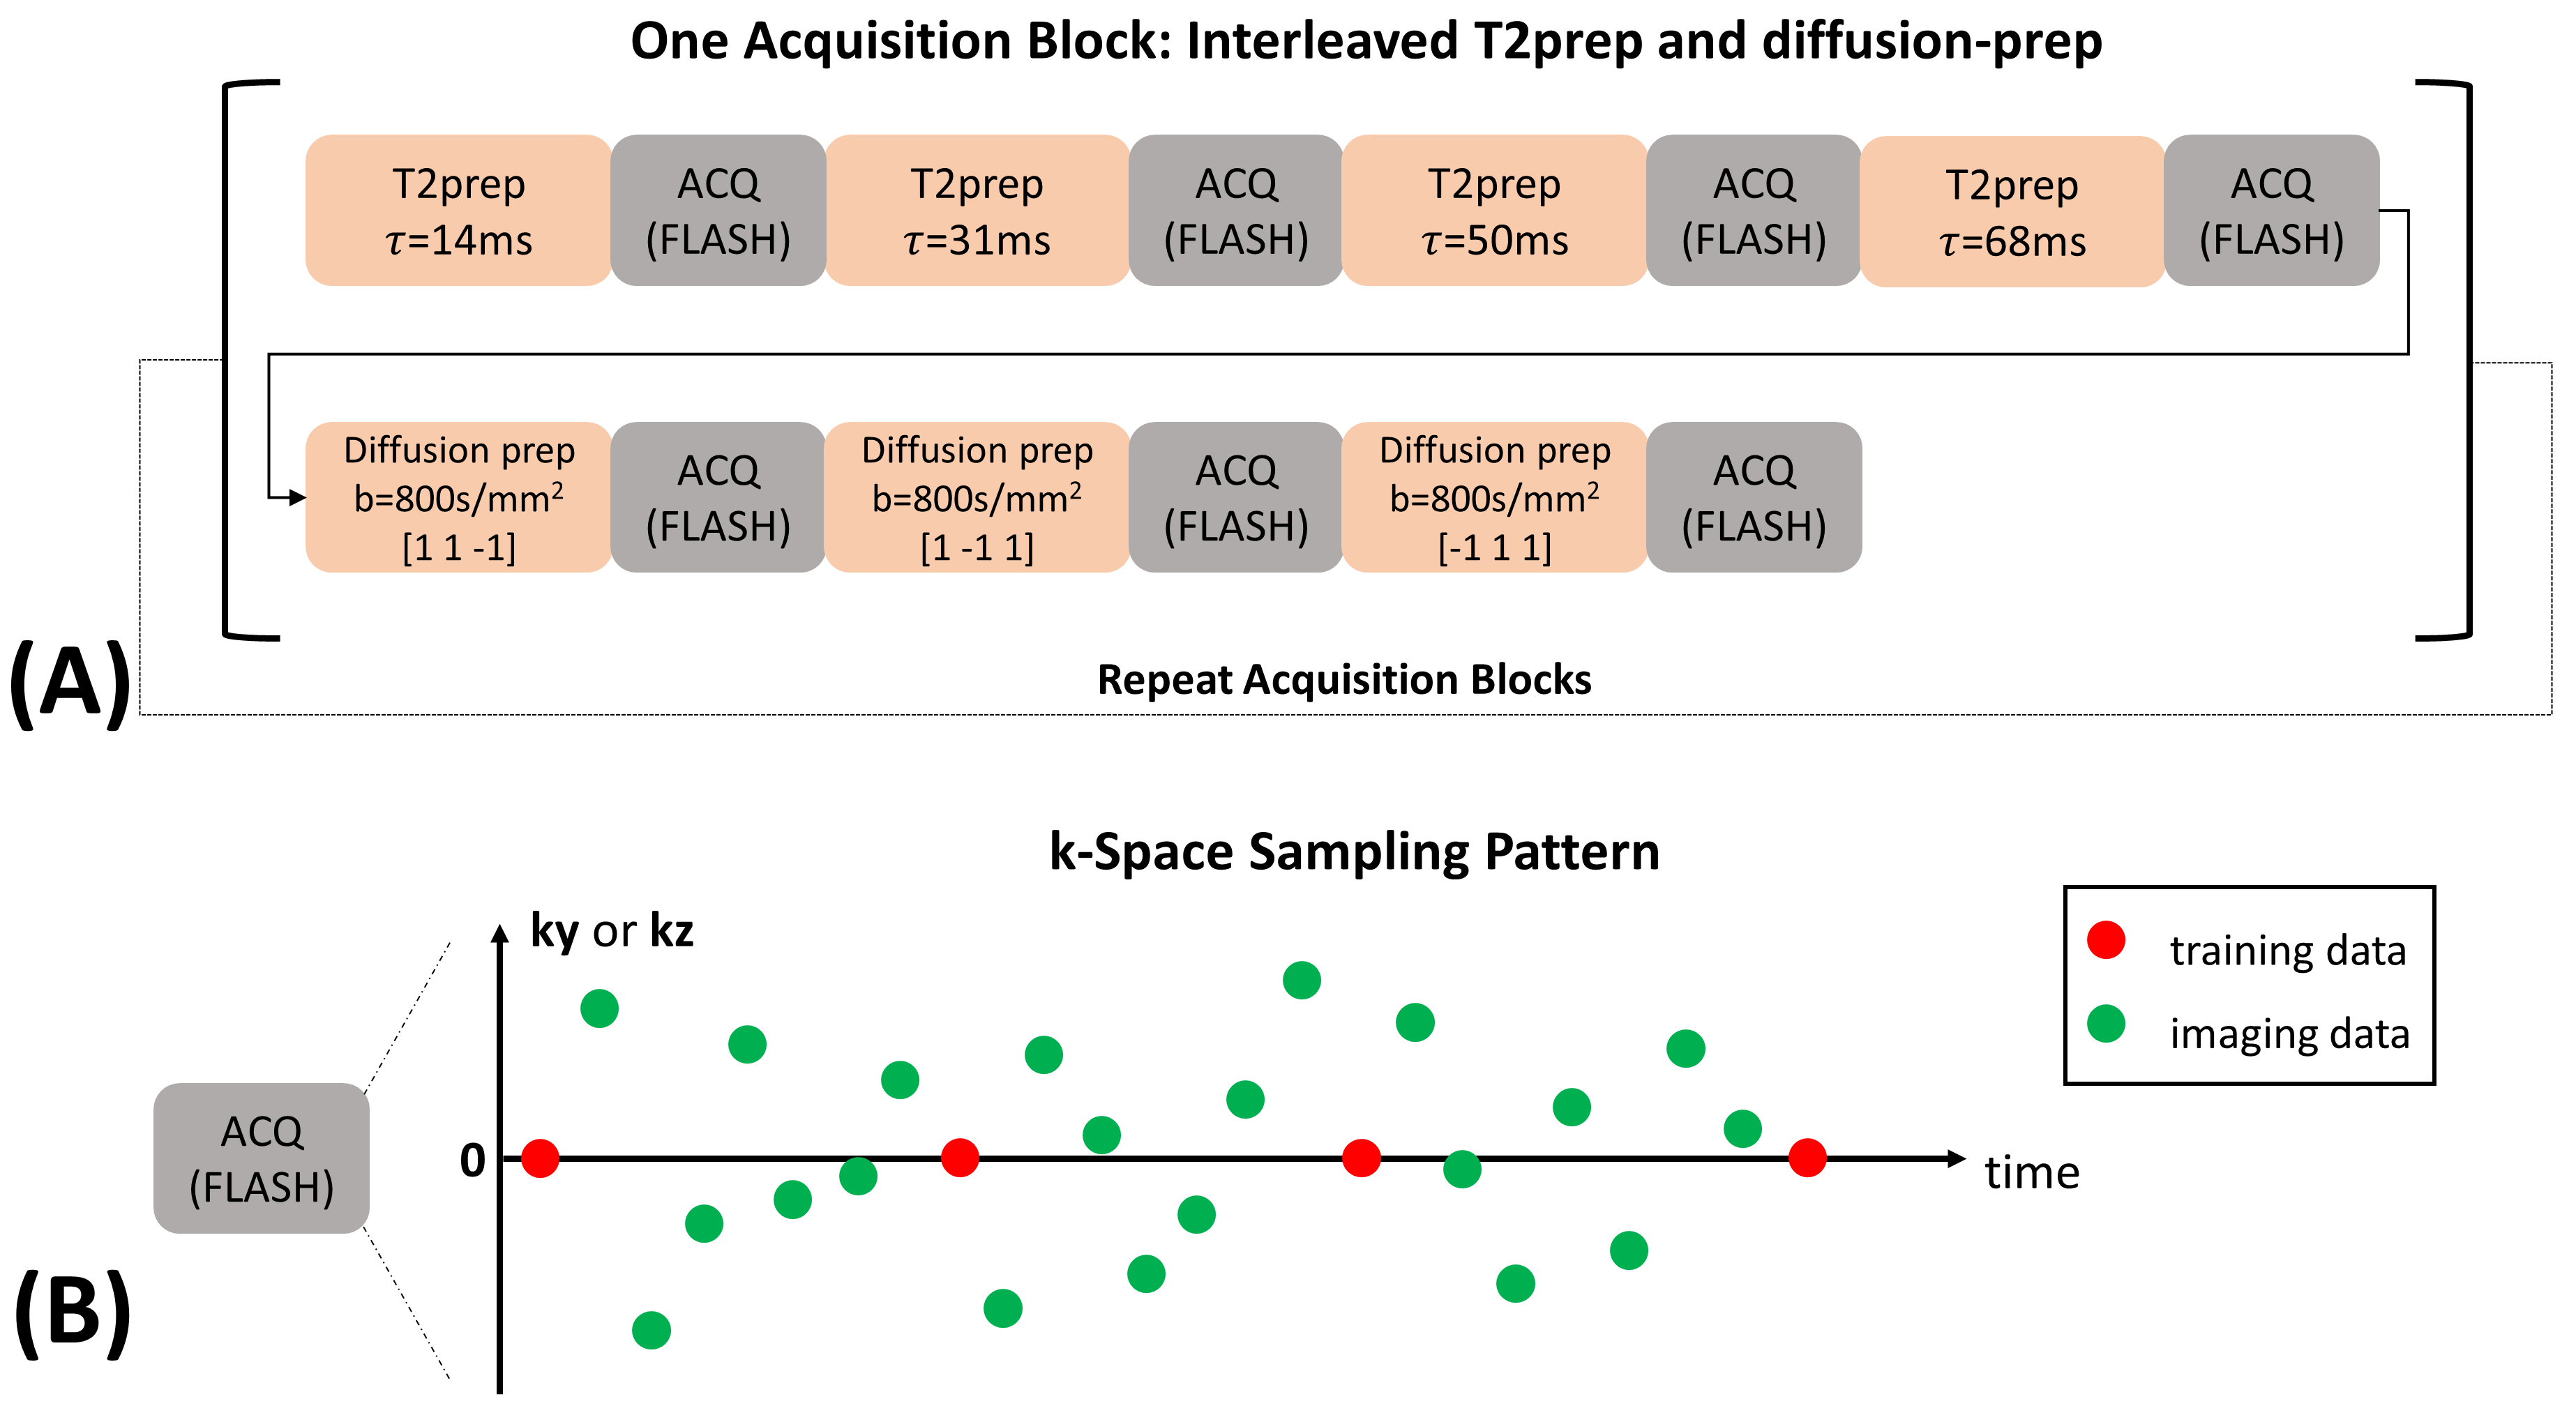
Pulse Sequence and Data Acquisition: The pulse sequence and data acquisition are similar to what we previously proposed for whole-brain T1/T2/ADC quantification6. Specifically, T1/T2/diffusion contrasts were generated by cycling through a series of 4 T2-preparations (durations $$$\tau$$$=14, 31, 50, 68ms) and 3 diffusion-preparations ($$$b$$$=800s/mm2, diffusion directions $$$d$$$=[1 1 -1],[1 -1 1],[-1 1 1]) (Fig. 1A). The T2-preparation with $$$\tau$$$=31ms had the same duration as diffusion-preparations, acting as $$$b$$$=0 module. Data acquisition was performed using 3D segmented FLASH readouts (flip angle=5$$$^{\circ}$$$, TR/TE=11.1/5.8ms), resulting in the signal equation:$$S_{n}=\frac{1}{2}\cdot A\cdot(e^{-\frac{TR}{T1}}\cos(\alpha))^{n}\cdot e^{-\frac{\tau }{T2}}\cdot e^{-bD}\cdot\sin(\alpha),$$where $$$A$$$ absorbs proton density, overall B1 receive sensitivity, and T2* weighting, $$$n$$$ is the readout index, $$$\alpha$$$ denotes FLASH flip angle, and $$$D$$$ represents the diffusion coefficient associated with $$$d$$$. Imaging data ($$$\mathbf{d}_{\text{img}}$$$) were sampled with Gaussian variable density along $$$\mathbf{k}_{y}$$$ and $$$\mathbf{k}_{z}$$$, while training data ($$$\mathbf{d}_{\text{tr}}$$$) were sampled every 8 readouts at k-space center (Fig. 1B).Image Reconstruction: We represent the underlying multidimensional image as a 5-way low-rank tensor $$$\mathcal{X}$$$ with the first dimension concatenating all voxel locations $$$\mathbf{r}=(x,y,z)$$$ and four dimensions indexing four time/parameter variables $$$n,\tau, b, d$$$ respectively. The image model is expressed as $$$\mathbf{X}_{(1)}=\mathbf{U}\mathbf{\Phi}$$$ where $$$\mathbf{X}_{(1)}$$$ denotes mode-1 matricization of $$$\mathcal{X}$$$, $$$\mathbf{U}$$$ contains spatial coefficient maps, and $$$\mathbf{\Phi}$$$ contains separable multidimensional temporal basis functions describing the dynamic processes of the four time/parameter dimensions9. A time-resolved phase map $$$\mathbf{P}$$$ is used to compensate for inter- and intra-shot phase inconsistencies6.
We first estimate $$$\mathbf{P}$$$ from a “real-time” reconstruction with only one time dimension (elapsed time $$$t$$$) mixing T1 decay, T2 relaxation, and diffusion contrasts:$$\mathbf{P}=\angle\mathbf{I}_{0},\text{with}\ \mathbf{I}_{0}=\mathbf{U}_{\text{rt,0}}\mathbf{\Phi}_{\text{rt,0}},\text{where}\ \mathbf{U}_{\text{rt,0}}=\arg\min_{\mathbf{U}_{\text{rt,0}}}\left\|\mathbf{d}_{\text{img}}-E(\mathbf{U}_{\text{rt,0}}\mathbf{\Phi}_{\text{rt,0}})\right\|^{2},$$where the real-time temporal subspace $$$\mathbf{\Phi}_{\text{rt,0}}$$$ is extracted from SVD of $$$\mathbf{d}_{\text{tr}}$$$, and $$$E(\cdot)$$$ combines spatial encoding and sampling.
Secondly, $$$\mathbf{\Phi}$$$ is determined via Bloch-constrained low-rank tensor completion of the features extracted from the phase-free $$$\left | \mathbf{I}_{0} \right |$$$ and reorganized as a training tensor6, followed by high-order SVD9 of the completed training tensor.
Lastly, $$$\mathbf{U}$$$ is recovered by incorporating $$$\mathbf{P}$$$ and $$$\mathbf{\Phi}$$$ into the forward model10 and solving:$$\mathbf{U}=\arg\min_{\mathbf{U}}\left\|\mathbf{d}_{\text{img}}-E(\mathbf{P}\circ(\mathbf{U}\mathbf{\Phi}))\right\|^{2}+R_{s}(\mathbf{U}),$$where $$$R_{s}(\cdot)$$$ performs spatial total variation regularization.
Experiment Design: Data were collected on a 3T scanner (Vida, Siemens) on a homemade T1 phantom11 and n=13 healthy subjects. In phantom, inversion-recovery-TSE (IR-TSE) images were collected for reference T1 mapping to validate our B1+-compensated Multitasking T1 mapping. In vivo protocols included fat-saturated T1-weighted and T2-STIR imaging, along with multi-echo-spin-echo for reference T2 mapping, and diffusion-weighted readout-segmented-EPI for reference ADC mapping. There is no widely accepted T1 mapping method in breast MRI. Reference B1+ maps were separately acquired for both in vitro and in vivo using a turbo-FLASH sequence preceded by a pre-saturation pulse with prescribed flip angle 80$$$^{\circ}$$$12 (scan time=25s). The Multitasking sequence (scan time=8min) was run twice to test the repeatability for in vivo study. Imaging parameters were: FOV=240x240x140mm3, resolution=1.5x1.5x5mm3.
Image Analysis: Multi-parametric fitting of $$$A$$$, $$$\alpha$$$, T1, T2, and diffusion coefficients of 3 directions was performed. The B1+ map was incorporated as the initial guess of $$$\alpha$$$ to compensate for B1+ field variation. Intra-class correlation coefficients (ICC) were compared between Multitasking and references for both phantom and in vivo studies.
Results
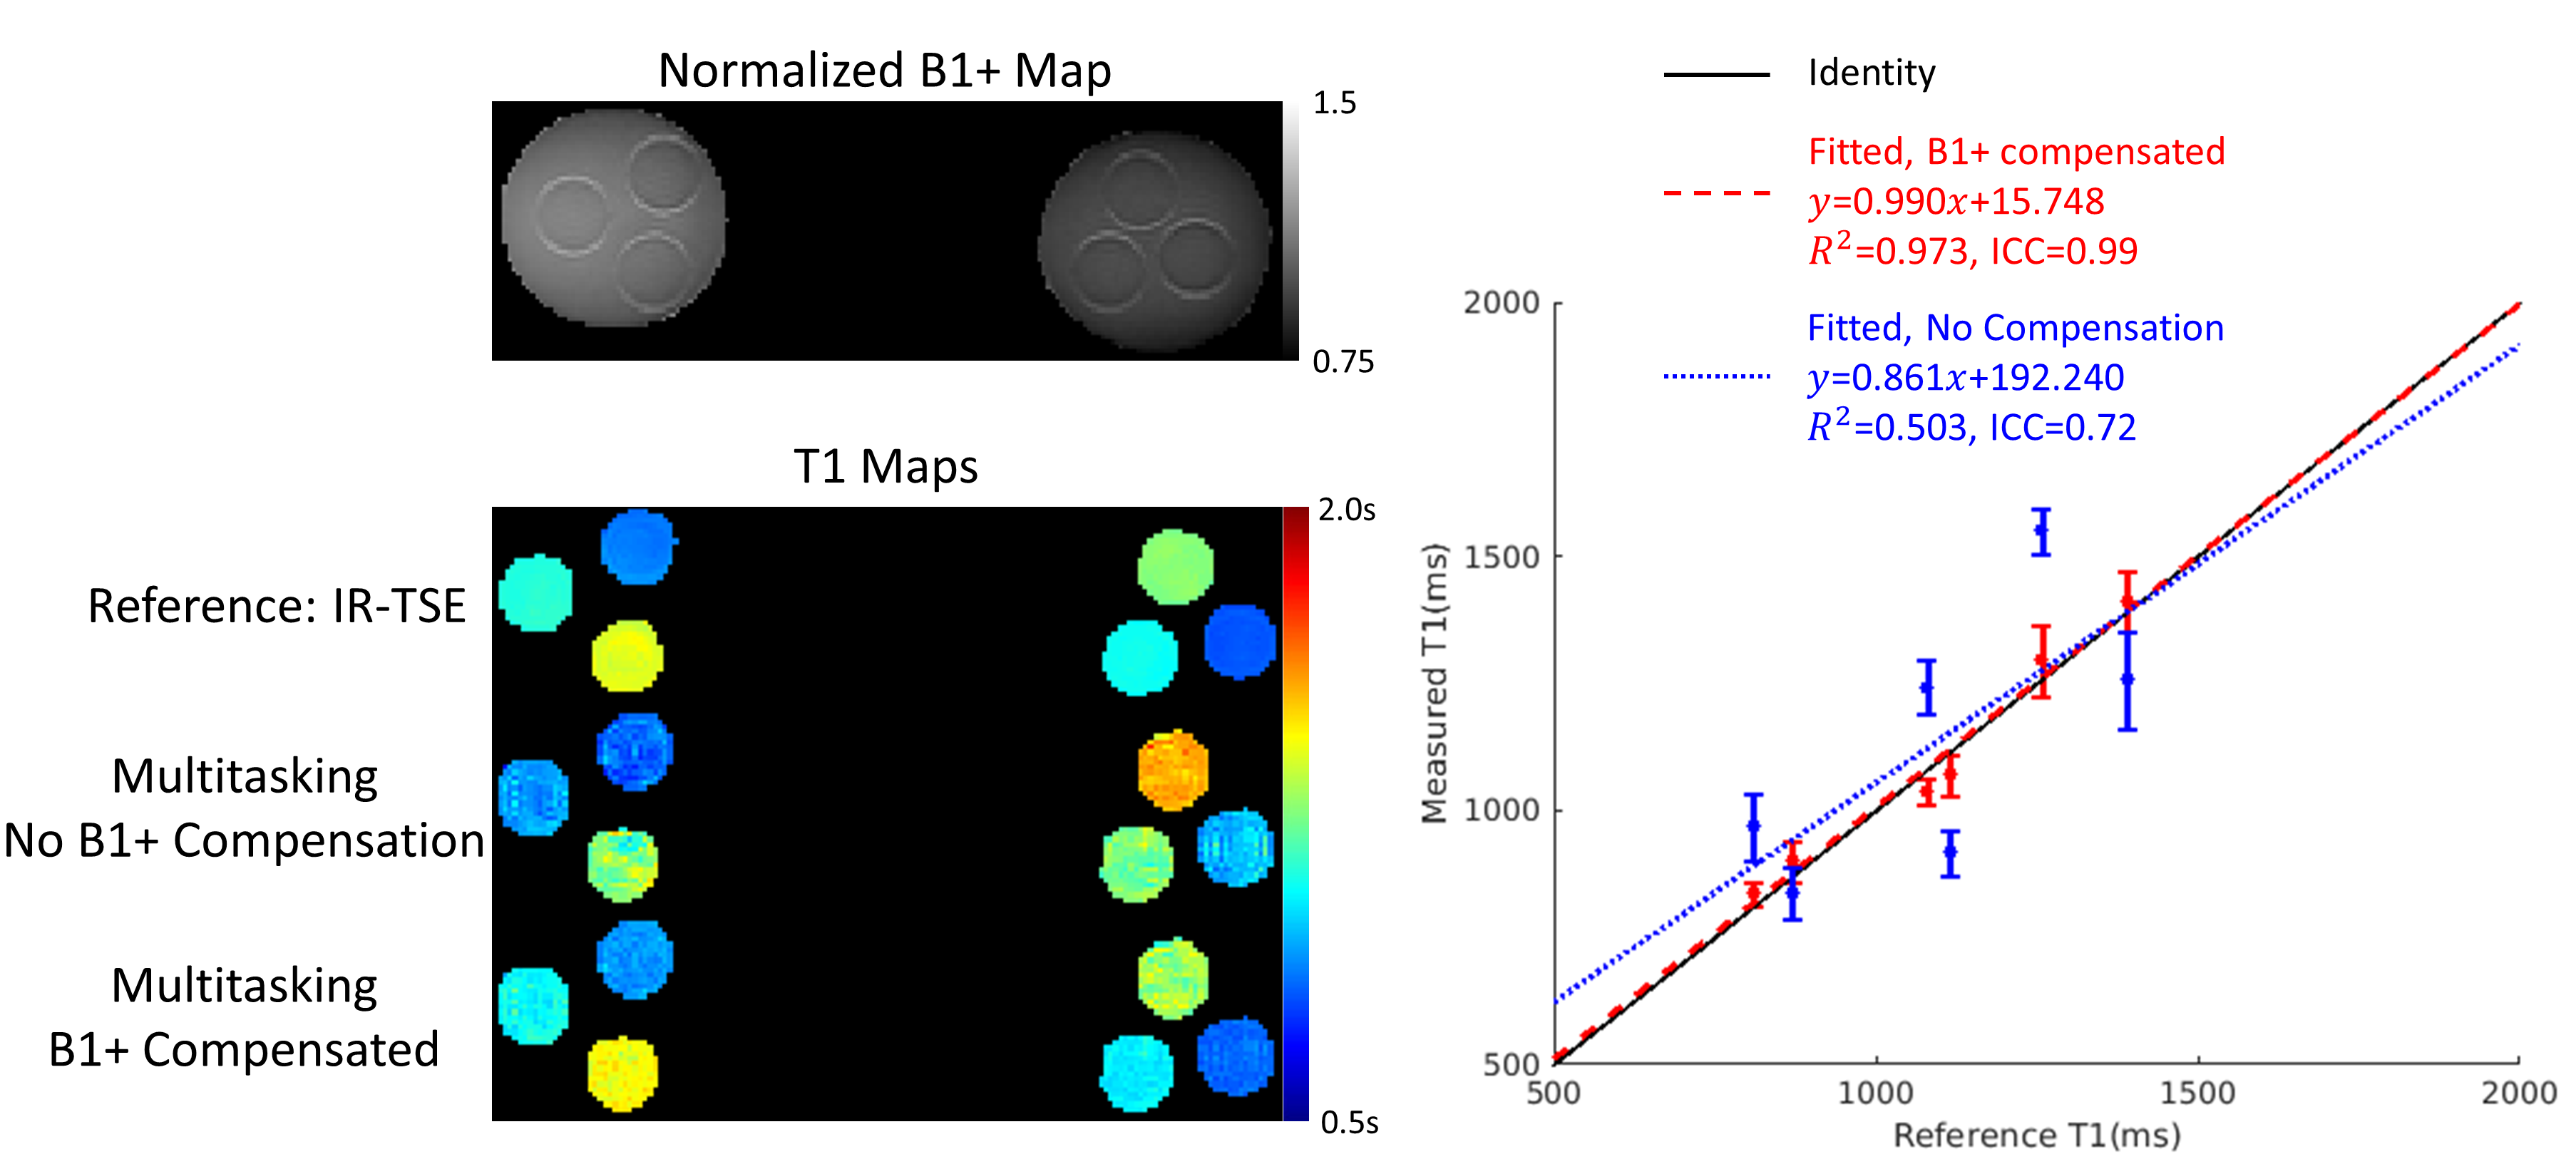
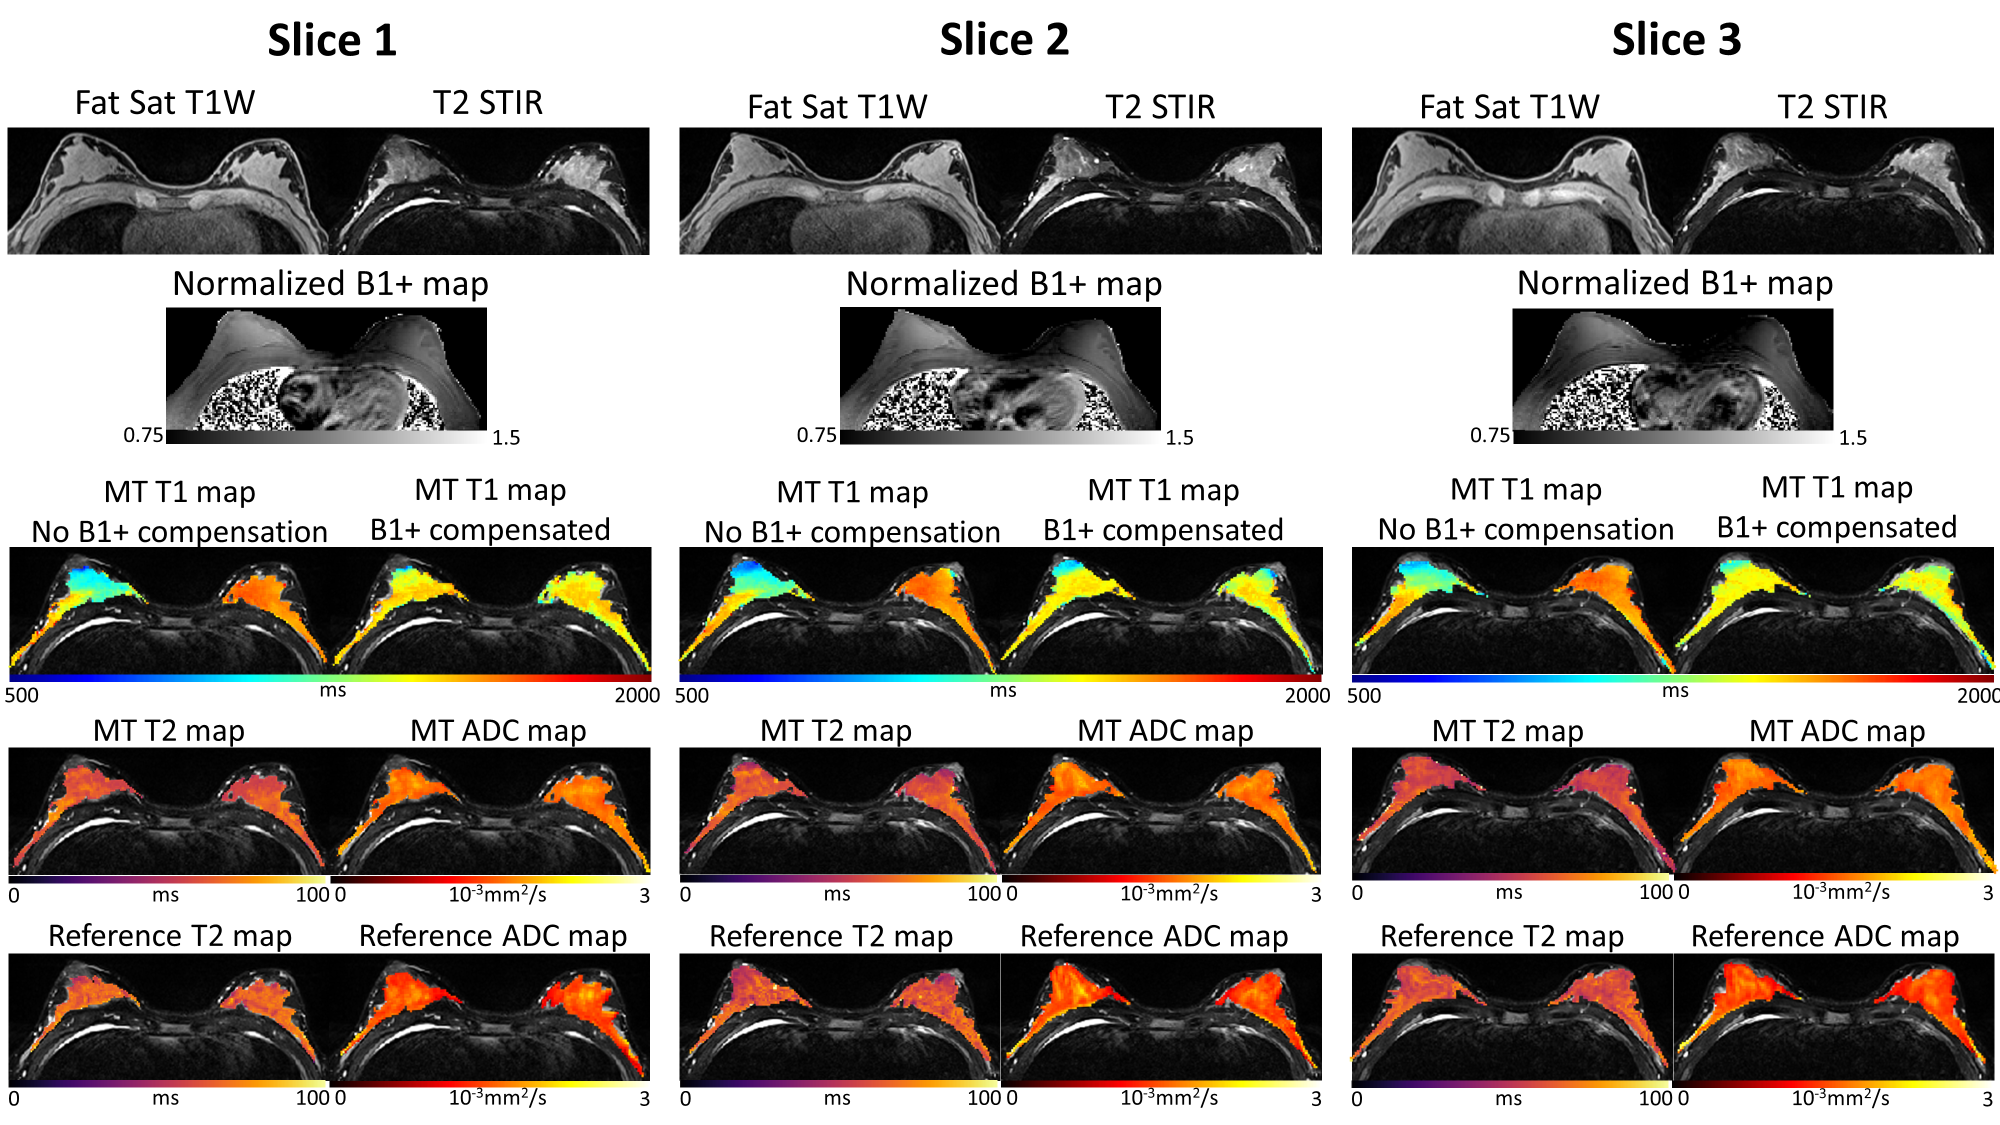
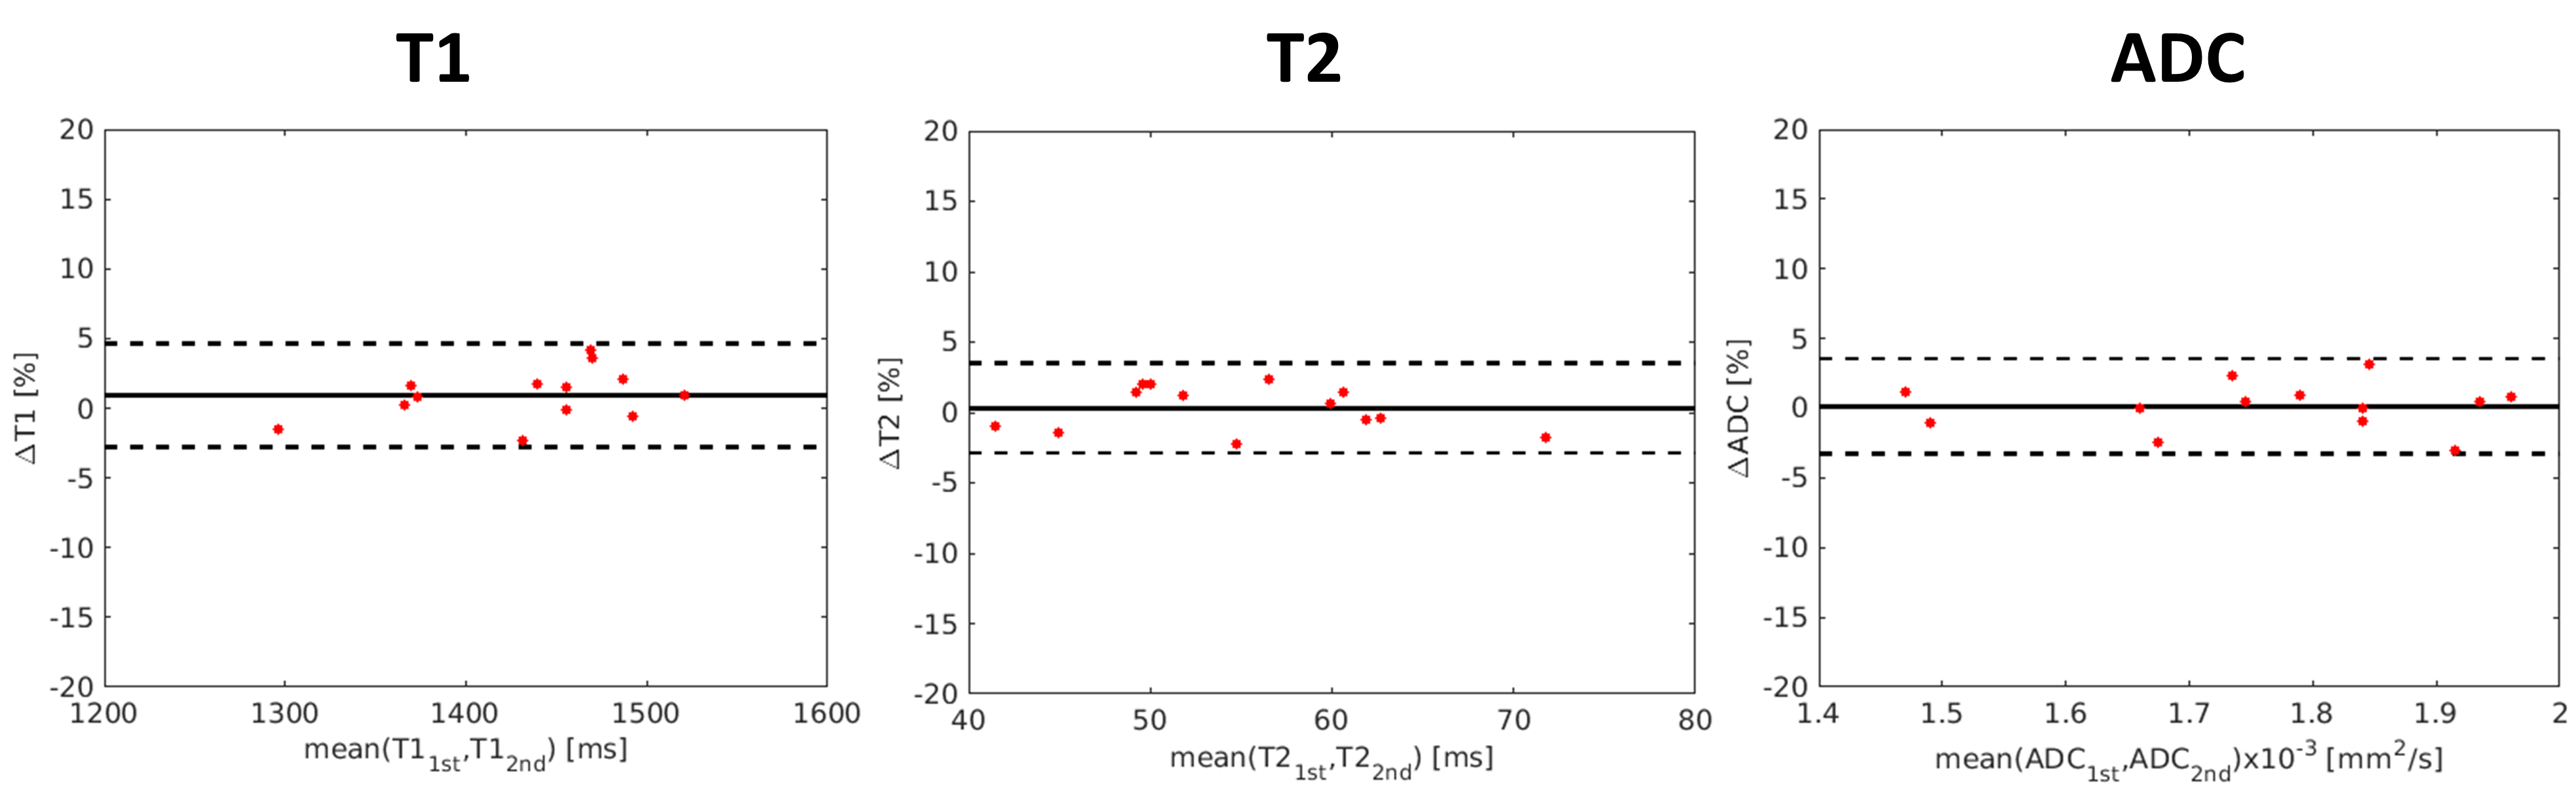
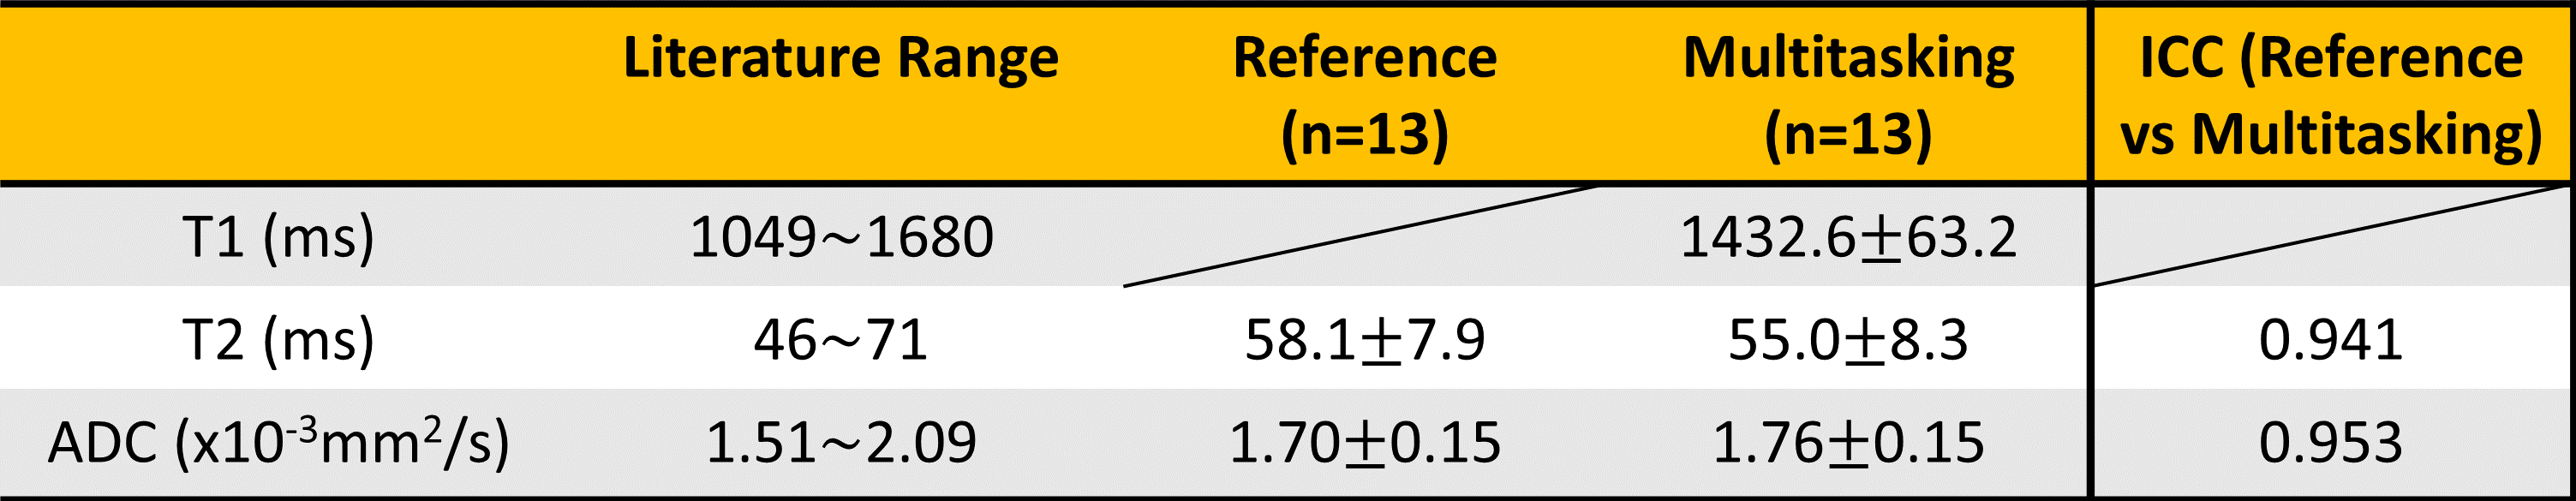
With B1+ compensation, phantom T1 measurements agrees substantially better ($$$R^{2}$$$=0.973, ICC=0.99) with reference T1 measurements than without B1+ compensation ($$$R^{2}$$$=0.503, ICC=0.72) (Fig.2). High quality, co-registered breast T1/T2/ADC maps are presented, where T2/ADC are consistent with the references and uniform T1 is generated with B1+ compensation (Fig.3). T1/T2/ADC measurements show good repeatability between the first and second Multitasking experiment (Fig.4). Multitasking T1/T2/ADC population measurements are shown in Table 1, where T2/ADC show excellent agreement with reference values (ICC>0.94), and all three measurements fall within the literature range13-17.Discussion
High quality, co-registered quantitative T1/T2/ADC maps were generated with the Multitasking framework. The substantial T1 variation caused by the nonuniformity of the B1+ field in the breast coil was compensated, resulting in uniform T1 mapping of the breast. T1/T2/ADC measurements agreed with literature values and reference methods where available.Conclusion
We presented simultaneous quantification of whole-breast T1/T2/ADC with the MR Multitasking framework in 8.5min, incorporating a separate B1+ map to compensate for the nonuniform B1+ field commonly occurred in breast MRI scans. Co-registered, distortion-free T1/T2/ADC maps are provided, and the values are repeatable and agree well with the references and literature values. Clinical validations will be conducted in future work. The proposed method has the potential to provide imaging biomarkers for comprehensive tumor characterization, early detection, staging, and treatment monitoring of breast cancer.Acknowledgements
This work was supported by NIH 1R01EB028146.References
1. Liu L, Yin B, Shek K, Geng D, Lu Y, Wen J, et al. Role of quantitative analysis of T2 relaxation time in differentiating benign from malignant breast lesions. J Int Med Res. 2018;46(5):1928-1935.
2. Liu L, Yin B, Geng DY, Lu YP, Peng WJ. Changes of T2 Relaxation Time From Neoadjuvant Chemotherapy in Breast Cancer Lesions. Iran J Radiol. 2016;13(3):e24014.
3. Tan SLL, Rahmat K, Rozalli FI, Mohd-Shah MN, Aziz YFA, Yip CH, et al. Differentiation between benign and malignant breast lesions using quantitative diffusion-weighted sequence on 3 T MRI. Clin Radiol. 2014;69(1):63-71.
4. Partridge SC, Zhang Z, Newitt DC, Gibbs JE, Chenevert TL, Rosen MA, et al. Diffusion-weighted MRI Findings Predict Pathologic Response in Neoadjuvant Treatment of Breast Cancer: The ACRIN 6698 Multicenter Trial. Radiology. 2018;289(3):618-627.
5. Iwasa H, Kubota K, Hamada N, Nogami M, Nishioka A. Early prediction of response to neoadjuvant chemotherapy in patients with breast cancer using diffusion-weighted imaging and gray-scale ultrasonography. Oncol Rep. 2014;31:1555-60.
6. Ma S, Nguyen C, Han F, Wang N, Deng Z, Binesh N, et al. Three-Dimensional Simultaneous Brain T1, T2, and Apparent Diffusion Coefficient Mapping with MR Multitasking. Magn Reson Med, 2019. In press.
7. Sung K, Daniel BL, Hargreaves BA. Transmit B1+ field inhomogeneity and T1 estimation errors in breast DCE-MRI at 3 tesla. J Magn Reson Imaging. 2013;38(2):454-459.
8. Azlan CA, Di Giovanni P, Ahearn TS, Semple SI, Gilbert FJ, Redpath TW. B1 transmission-field inhomogeneity and enhancement ratio errors in dynamic contrast-enhanced MRI (DCE-MRI) of the breast at 3T. J Magn Reson Imaging. 2010;31(1):234-239.
9. Christodoulou AG, Shaw JL, Nguyen C, Yang Q, Xie YB, Wang N, et al. Magnetic resonance multitasking for motion-resolved quantitative cardiovascular imaging. Nat Biomed Eng. 2018;2(4):215-226.
10. Ma S, Nguyen C, Christodoulou AG, Luthringer D, Kobashigawa J, Lee S-E, Chang H-J, et al.. Accelerated Cardiac Diffusion Tensor Imaging Using Joint Low-Rank and Sparsity Constraints. IEEE Trans BioMed Eng 2018;65(10): 2219-2230.
11. Shaw J, Yang Q, Zhou Z, Deng Z, Nguyen C, Li D, et al. Free-breathing, non-ECG, continuous myocardial T1 mapping with cardiovascular magnetic resonance multitasking. Magn Reson Med, 2019; 81(4): 2450-2463.
12. Chung S, Kim D, Breton E, Axel L. Rapid B1+ mapping using a preconditioning RF pulse with TurboFLASH readout. Magn Reson Med. 2010;64(2):439-446.
13. Rakow‐Penner R, Daniel B, Yu H, Sawyer-Glover A, Glover GH. Relaxation times of breast tissue at 1.5 T and 3T measured using IDEAL. J Magn Reson Imaging, 2006, 23(1): 87-91.
14. Edden RAE, Smith SA, Barker PB. Longitudinal and Multi-Echo Transverse Relaxation Times of Normal Breast Tissue at 3 Tesla. J Magn Reson Imaging, 2010; 32(4): 982-987.
15. Chen Y, Panda A, Pahwa S, Hamilton JI, Dastmalchian S, McGivney DF, et al. Three-Dimensional MR Fingerprinting for Quantitative Breast Imaging. Radiol. 2019;290: 33-40.
16. Pineda FD, Medved M, Fan X, Karczmar GS. B1 and T1 mapping of the breast with a reference tissue method. Magn Reson Med, 2015; 75(4):1565-1573.
17. Partridge SC, McDonald ES. Diffusion weighted MRI of the breast: Protocol optimization, guidelines for interpretation, and potential clinical applications. Magn Reson Imaing Clin N Am, 2013; 21(3): 601-624.
Figures