2340
Simultaneously acquired DWI and PET for early prediction of pathological response to neoadjuvant chemotherapy in breast cancer1Department of Medical Imaging, National Taiwan University Hospital and College of Medicine, Taipei, Taiwan, 2Siemens Healthcare Limited, Taipei, Taiwan, 3Siemens Healthcare, Erlangen, Germany, 4Department of Surgery, National Taiwan University Hospital and College of Medicine, Taipei, Taiwan
Synopsis
Neoadjuvant chemotherapy (NAC) for treatment of breast cancer has the potential benefit of reducing tumor size before surgery. The response to NAC may also provide prognostic information which may lead to more effective chemotherapy. Combining PET and MRI information is useful for assessing the tumor response to NAC in a comprehensive manner. In this study, we performed texture analysis which indicated that the entropy of ADC and difference entropy of SUV were related and can be used to predict pCR with high areas under the receiver operating characteristic curve (AUC).
Introduction
NAC has become a standard treatment for locally advanced breast carcinoma. Patients with pCR have excellent long-term survival1,2. In terms of predicting chemotherapy response, FDG PET/CT has shown 65-88% accuracy after the first or second cycle of NAC3,4. Previous studies have also demonstrated that the ADC value can be used as a valuable parameter for evaluating the early response to treatment5,6,7. The MR-PET system is a new diagnostic tool enabling the simultaneous acquisition of morphologic and multiple functional data, thus allowing for diversified characterization of oncological diseases. It is expected to improve therapy response prediction9,10. A prior study suggested that voxel-wise DWI and FDG-PET correlation might provide a sophisticated spatial characterization of pulmonary lesions8. The aim of this study was to prospectively explore whether simultaneously acquired DWI and PET can be used to predict pCR following NAC for treatment of breast cancer.Methods
This study was approved by the Institutional Review Board of the hospital, and informed consent was obtained from all the enrolled subjects. Between January 2015 and June 2019, 46 patients with breast cancer who had received NAC and subsequent surgery were prospectively enrolled. Tumor characteristics of the patients are given in Table 1. Images were acquired on a 3T MR-PET scanner (Biograph mMR, Siemens Healthcare, Erlangen, Germany). DWI was acquired by single-shot EPI sequence with FOV = 360 x 180 mm2, slice thickness = 4 mm, matrix size = 198 x 78, TR/TE=7200/83, b-value of 50 and 1000 s/mm2. Patients were injected intravenously with 3.7-5.55 MBq/kg (0.1-0.15 mCi/kg) of 18F-FDG. Each patient underwent 18F-FDG PET/MRI examination before NAC (T0) and after the first cycle of NAC (T1). PET parameters included SUVmax, SUVmean, SUV SD, SUVmedian, SUV 5%, SUV 95%, SUV Skewness, SUV E.Kurtosis, SUV DiffEntropy, SUV DiffVariance, SUV Contrast, and SUV Entropy. DWI parameters included ADCmin, ADCmean, ADC SD, ADCmedian, ADC 5%, ADC 95%, ADC Skewness, ADC E.Kurtosis, ADC DiffEntropy, ADC DiffVariance, ADC Contrast, and ADC Entropy. These analyses were performed with the MR Multiparametric Analysis prototype software (Siemens Healthcare, Erlangen, Germany). Patients were divided into pCR or non-pCR groups. pCR is defined as the ypT0 ypN0 in the current AJCC staging system. The performance of each imaging parameters was assessed both alone and in combination to predict pCR. AUC was analyzed to compare the diagnostic performance of imaging parameters from PET and DWI. The best cut-off values of the imaging parameters to achieve the maximal sum of sensitivity and specificity were analyzed to indicate the optimal criteria for the prediction. Sensitivity, specificity, and AUC for distinguishing pCR from non-pCR were calculated for each imaging parameters in single and in combination.Results
Of the 46 patients, 11 (23.9%) exhibited a pCR and 35 (76%) exhibited a non-pCR. The AUC for tumor size, ADC Entropy, SUV SD, SUV 95%, and SUVmax at T1 and the percentage change in SUV DiffEntropy, SUV Contrast, and SUVmax were greater than 0.75. The AUC for all other parameters listed in the Methods section were lower than 0.75. All variables that have an AUC greater than 0.75 were analyzed using forward regression. Three variables, which are ADC Entropy, SUVmax, and percent change in SUV DiffEntropy, are considered to be the best subset of predictors from ADC and PET parameters, respectively. The AUC for the percentage change in SUV DiffEntropy (0.784, 95% CI 0.652 to 0.917) was similar to that for the ADC Entropy (0.768, 95% CI 0.623 to 0.912) and SUVmax (0.787, 95% CI 0.651 to 0.923) (Figure 1). The specificity of SUVmax in predicting pCR was 54.3% and that of ADC Entropy was 68.6%. The sensitivity of SUVmax in predicting pCR was 90.9% and that of ADC Entropy was 81.8%. When the SUVmax and percent change in SUV DiffEntropy criterion were combined, the sensitivity was 90.9% and the specificity was 71.4% (Table 2).Discussion
Earlier studies from the ACRIN 6698 multicenter trial found that ADC is predictive of pathological response to neoadjuvant therapy12. SUVmax is also known to be a powerful predictive factor for PET parameters in MR-PET studies13. Our current findings are consistent with these previous studies. In the expansion of these earlier findings, we also investigated entropy as an important pCR indicator. Our findings indicate that the measurements of entropy of ADC value, difference entropy of SUV, and maximal SUV may serve as key parameters critical in predicting pCR. This study showed an AUC greater than 0.75 when using these parameters. Entropy was found to be one of the significant texture features of DCE MRI important for predicting response to NAC14. Our data also strongly indicated that the response to NAC reflects entropyConclusion
Our study investigated multiple parameters by correlating the PET and MRI images using a 3T MR-PET system in order to investigate the predictive parameters for pCR. Although this study was limited by the small study population, our results demonstrate that simultaneously acquired ADC and SUV can be used to predict pCR after the first cycle of NAC for treatment of breast cancer.Acknowledgements
No acknowledgement found.References
1. Rubovszky G, Horváth Z. Recent advances in the neoadjuvant treatment of breast cancer. J Breast Cancer. 2017;20:119–31.
2. von Minckwitz G, Untch M, Blohmer JU, et al. Definition and impact of pathologic complete response on prognosis after neoadjuvant chemotherapy in various intrinsic breast cancer subtypes. J Clin Oncol. 2012;30:1796–804.
3. Rousseau C, Devillers A, Sagan C, et al. Monitoring of early response to neoadjuvant chemotherapy in stage II and III breast cancer by [18F]fluorodeoxyglucose positron emission tomography. J Clin Oncol. 2006;24:5366–72.
4. Schwarz-Dose J, Untch M, Tiling R, et al. Monitoring primary systemic therapy of large and locally advanced breast cancer by using sequential positron emission tomography imaging with [18F]fluorodeoxyglucose. J Clin Oncol. 2009;27:535–41.
5. Iwasa H, Kubota K, Hamada N, Nogami M, Nishioka A. Early prediction of response to neoadjuvant chemotherapy in patients with breast cancer using diffusion-weighted imaging and gray-scale ultrasonography. Oncol Rep. 2014;31:1555–60.
6. Richard R, Thomassin I, Chapellier M, Scemama A, de Cremoux P, Varna M, Giacchetti S, Espié M, de Kerviler E, de Bazelaire C. Diffusion-weighted MRI in pretreatment prediction of response to neoadjuvant chemotherapy in patients with breast cancer. Eur Radiol. 2013;23:2420–31.
7. Gao W, Guo N, Dong T. Diffusion-weighted imaging in monitoring the pathological response to neoadjuvant chemotherapy in patients with breast cancer: a meta-analysis. World J Surg Oncol. 2018 Jul 18;16(1):145.
8. Bitencourt AG, Lima EN, Chojniak R, et al. Multiparametric evaluation of breast lesions using PET-MRI: initial results and future perspectives. Medicine (Baltimore). 2014;93(22):e115.
9. Buchbender C, Heusner TA, Lauenstein TC, Bockisch A, Antoch G. Oncologic PET/MRI, part 1: tumors of the brain, head and neck, chest, abdomen, and pelvis. J Nucl Med. 2012;53:928–38.
10. Avril S, Muzic RF Jr, Plecha D, Traughber BJ, Vinayak S, Avril N. 18F-FDG PET/CT for monitoring of treatment response in breast cancer. J Nucl Med. 2016;57:34S–9S.
11. Fowler AM, Mankoff DA, Joe BN. Imaging Neoadjuvant Therapy Response in Breast Cancer. Radiology. 2017 Nov;285(2):358-375. doi: 10.1148/radiol.2017170180.
12. Partridge SC, Zhang Z, Newitt DC, Gibbs JE, Chenevert TL, Rosen MA, Bolan PJ, Marques HS, Romanoff J, Cimino L, Joe BN, Umphrey HR, Ojeda-Fournier H, Dogan B, Oh K, Abe H, Drukteinis JS, Esserman LJ, Hylton NM; ACRIN 6698 Trial Team and I-SPY 2 Trial Investigators. Diffusion-weighted MRI Findings Predict Pathologic Response in Neoadjuvant Treatment of Breast Cancer: The ACRIN 6698 Multicenter Trial. Radiology. 2018 Dec;289(3):618-627.
13. Cho N, Im SA, Cheon GJ, Park IA, Lee KH, Kim TY, Kim YS, Kwon BR, Lee JM, Suh HY, Suh KJ. Integrated 18F-FDG PET/MRI in breast cancer: early prediction of response to neoadjuvant chemotherapy. Eur J Nucl Med Mol Imaging. 2018 Mar;45(3):328-339.
14. Teruel JR, Heldahl MG, Goa PE, Pickles M, Lundgren S, Bathen TF, Gibbs P. Dynamic contrast-enhanced MRI texture analysis for pretreatment prediction of clinical and pathological response to neoadjuvant chemotherapy in patients with locally advanced breast cancer. NMR Biomed. 2014 Aug;27(8):887-96.
Figures
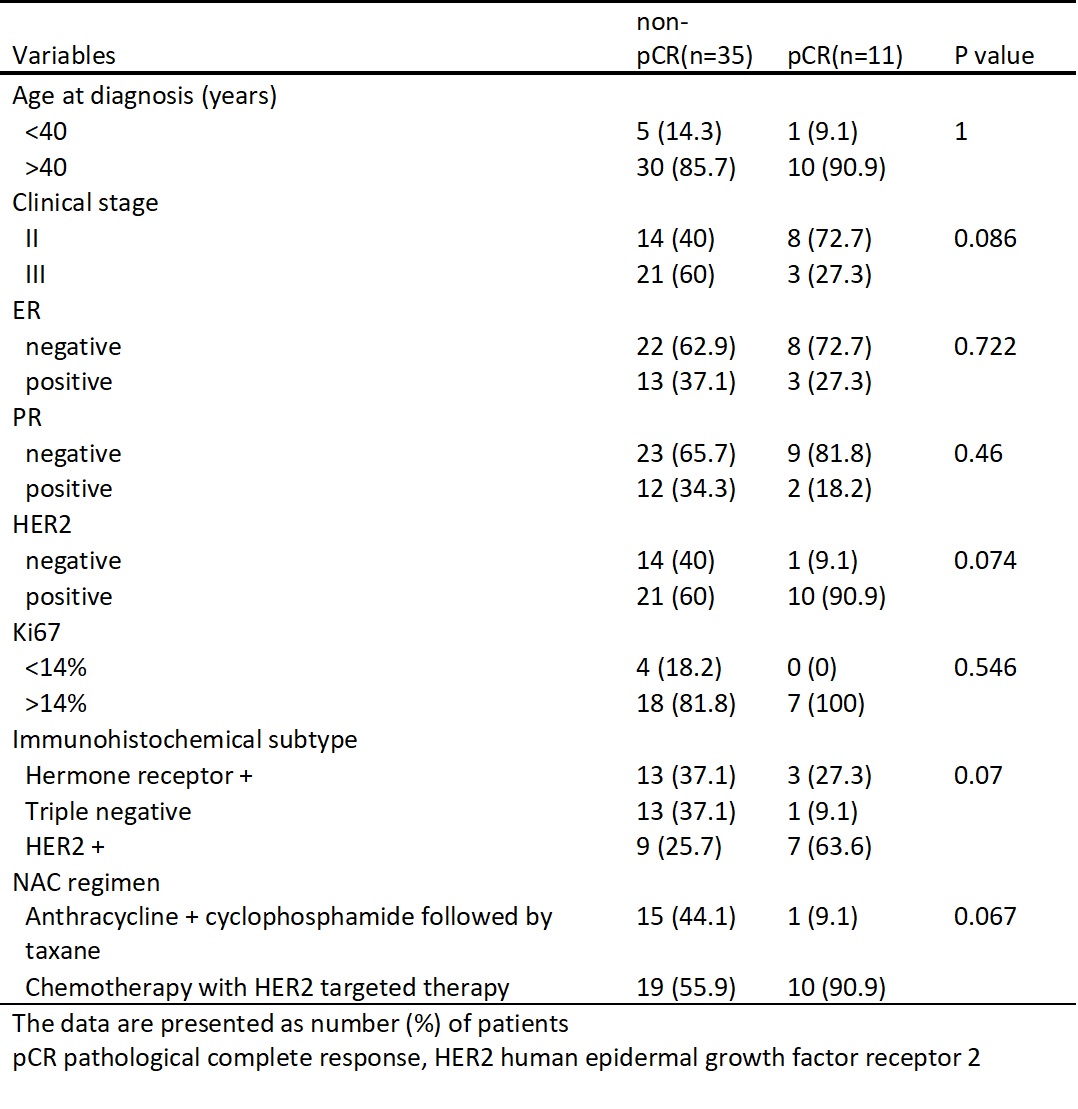
Table 1. Patient and tumor characteristics in relation to the pathological response
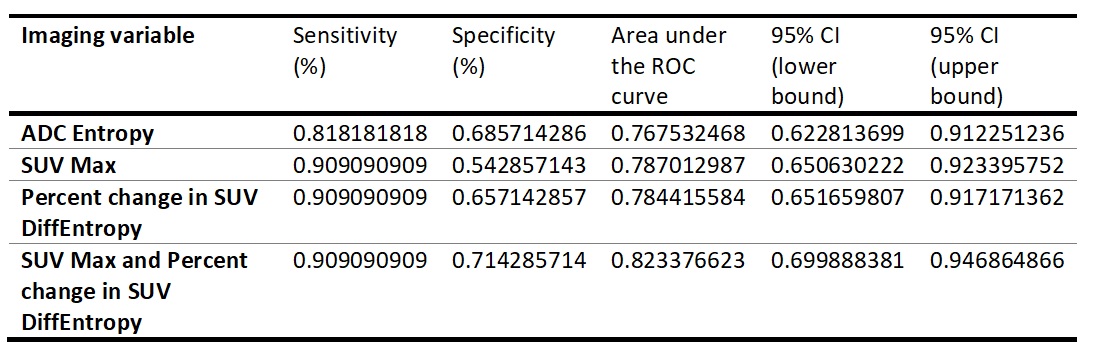
Table 2. Diagnostic performance of PET and DWI in the early prediction of pCR

Figure 1. AUC analysis of four different combination of the parameters, Entropy of ADC, percent changes in difference entropy of SUV, maximal SUV and combination of maximal SUV and percent changes in SUV difference entropy, showed larger than 0.75. Combination of maximal SUV and percent changes in SUV difference entropy has the best performance to differentiate pCR from non-pCR group.