2338
Comparative Analysis of the Value of APTWI and IVIM in Evaluating the Benign and Malignant Breast Lesions: A pilot study1Department of Radiology, Zhengzhou University People’s Hospital & Henan Provincial People’s Hospital, Academy of Medical Sciences, Zhengzhou University, Zhengzhou, China, 2Department of MRI, the First Affiliated Hospital of Xinxiang Medical University, Weihui, China, 3Department of Pediatrics, Zhengzhou Central Hospital, Zhengzhou University, Zhengzhou, China, 4GE Healthcare, MR Research China, Beijing, China, 5Department of Radiology, Zhengzhou University People’s Hospital & Henan Provincial People’s Hospital, Zhengzhou, China
Synopsis
Amide proton transfer-weighted imaging (APTWI) has unique advantages in displaying the metabolism of diseased proteins. Intravoxel incoherent motion (IVIM) method is able to obtain a variety of quantitative parameters, including D, D* and f values, which reflect the perfusion and diffusion information of the tissues. Our results show that APTWI and IVIM have similar diagnostic performance in the diagnosis of benign and malignant breast tumors.
Introduction
Breast cancer is one of the most common cancers in women worldwide, with its age of onset becoming younger. Magnetic resonance imaging (MRI) has been increasingly used in diagnosing patients with suspicious breast lesions owing to its excellent soft-tissue contrast and noninvasive nature compared with other imaging modalities 1. Amide proton transfer-weighted imaging (APTWI) is a chemical exchange saturation transfer (CEST) imaging technology and an MRI technology used to detect mobile protein and peptide contents in living tissue without using an exogenous magnetic resonance contrast agent 2. Intravoxel incoherent motion (IVIM) imaging is a technique with the potential for simultaneously assessing both tissue perfusion and diffusion by using a single diffusion weighted imaging with a different number of b values 3. At present, several studies have explored the possibility of using APTWI 4 or IVIM 5 alone for the diagnosis of benign or malignant breast lesions, but there are few comparative studies on APTWI and IVIM in breast lesions. This research aims to explore the possibility of using APTWI and IVIM to identify and diagnose benign and malignant breast tissues, and to compare which technique has a better diagnostic effect.Material and Methods
With pathological results as the gold standard, 124 patients were selected in this research, including 65 patients with malignant breast lesions (48 infiltrating ductal carcinomas, 10 ductal carcinomas in situ, 4 invasive papillary carcinomas, and 3 mucinous cancer) and 59 patients with benign breast lesions (32 fibroadenoma, 18 breast hyperplasia, and 9 mastitis lesions). Studies were conducted on a 3.0 T MR scanner (Discovery MR750, GE Healthcare) with an 8 channel phased-array breast coil. The IVIM sequence was set with the following parameters: TR= 2100 ms, TE= 60.3 ms; b-values = 0, 25, 50, 75, 100, 150, 200, 300, 400, 500, 600, 800, and 1000 s/mm2, NEX=1, 1, 1, 1, 1, 1, 2, 2, 4, 4, 6, 6, 8. After the IVIM scan was completed, under the guidance of an experienced radiologist, all layers containing the tumor subject were scanned using the APTWI sequence layer by layer. The scanning parameters were as follows: TR, 3000 ms; TE, 12.0 ms; RF, 2.0 μT; saturation time, 500 ms (4 pulses were applied for saturation); frequency list, 5000, 5000, 5000, ±600, ±575, ±550, ±525, ±500, ±475, ±450, ±425, ±400, ±375, ±350, ±325, ±300, ±275, ±250, ±225, ±200, ±175, ±150, ±125, ±100, ±75, ±50, ±25 Hz. The ROI was placed to cover as many solid tumor parts as possible to avoid large vessels and hemorrhagic, calcified, cystic and necrotic areas.SPSS 23.0 and Medcalc 15.0 were used for data analysis. The independent sample t-test was applied for between-group analyses. The correlation between MTRasym (3.5ppm) and D, D*, f were analyzed by using the Pearson correlation coefficient. The ROC curve was generated to evaluate each parameter’s diagnostic accuracy and threshold. The Delong method was used to compare the AUCs of different parameters. P<0.05 is considered statistically significant.Results
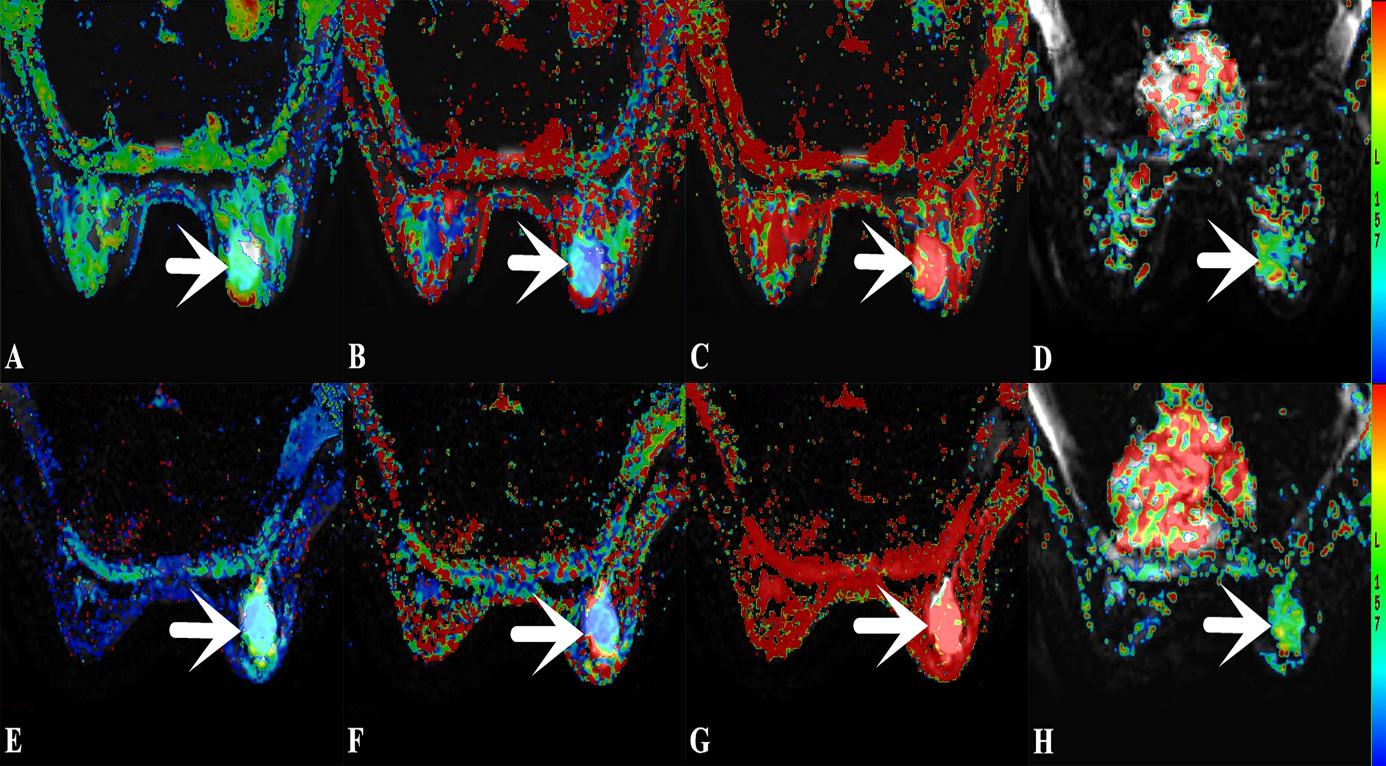
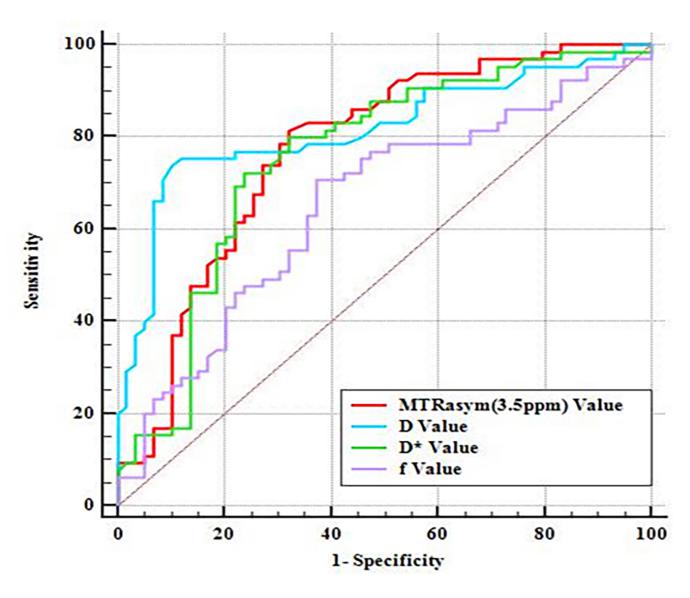
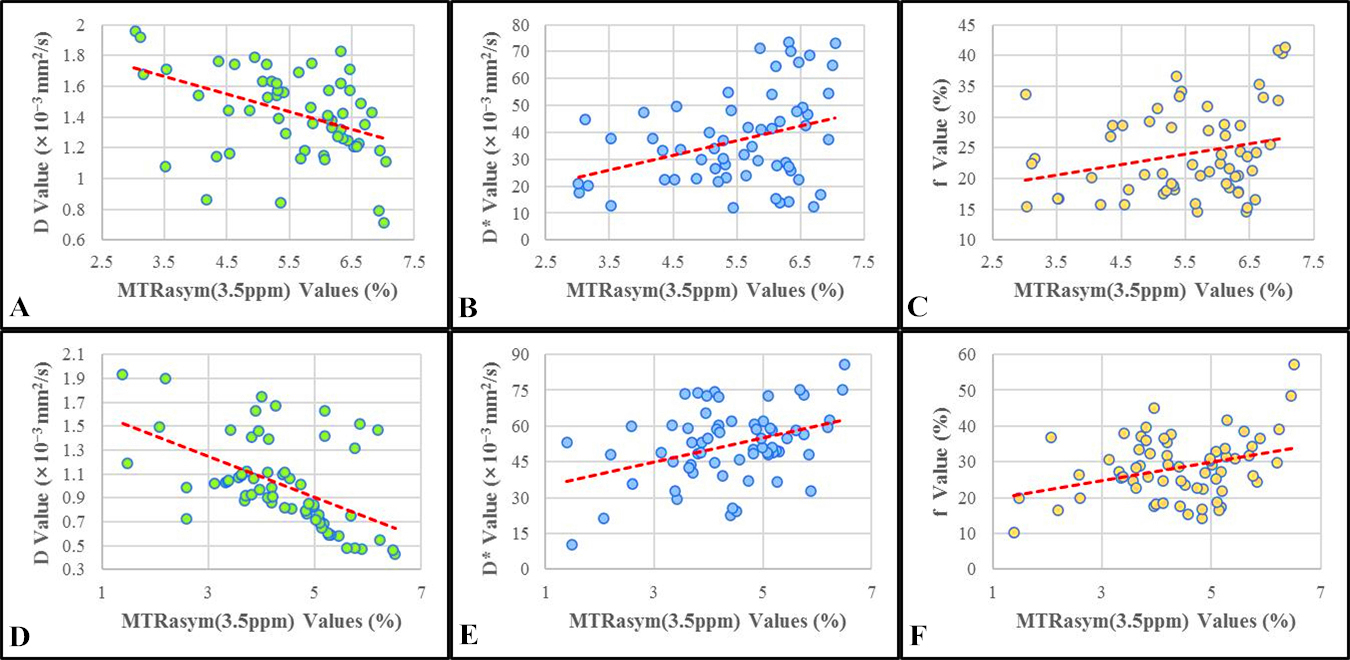
The MTRasym(3.5ppm) and D values of the benign [(5.52 ± 1.08)%, (1.43 ± 0.29) ×10−3 mm2/s] group are higher than that in the malignant [(4.39 ± 1.13)%, (1.01 ± 0.37) ×10−3 mm2/s] group, the D* and f values in the benign [(24.03 ± 7.18) ×10−3 mm2/s, (37.05 ± 17.13)% ]group is lower than that of the malignant [(28.42 ± 8.79) ×10−3 mm2/s, 52.13 ± 14.89) %] group (Figure 1, 2). The MTRasym(3.5ppm) from APTWI demonstrated the AUC of 0.774, which is not significantly different from the parameters ( D, D* and f ) derived from IVIM (Z= 0.687, 1.641, and 0.230, P= 0.492, 0.101, and 0.818, Figure 3 ). In benign and malignant groups, the MTRasym(3.5ppm) were both moderately negatively correlated with D with r values of -0.419, -0.525, and weekly positively correlated with D* and f with r values of 0.342, 0.257, 0.381, and 0.336 ( Figure 4 ).Discussion
The MTRasym(3.5ppm) and D values of the benign group are higher than those in the malignant group. The reason may be associated with the structure and function of cells. Compared with malignant lesions, the benign lesions are loose in structure and can secrete a large amount of mucus to increases the content of proteins and peptides6, benefiting the diffusion of water molecules. D and D* values are significantly different between benign lesions and malignant lesions. The results may be related to the blood volume of microcirculation perfusion, length of capillaries in the microcirculation perfusion and blood flow velocity7. In addition to these reasons, these results may also be related to the heterogeneous microenvironment and cell atypia.Conclusion
We concluded that APTWI and IVIM are both useful techniques for breast tumors, and they have similar diagnostic efficacy in the diagnosis of benign and malignant breast lesions.Acknowledgements
The National Natural Science Foundation of China (grants 81271565 and 31470047) and the National Clinical Key Specialty of China.References
1. Filli L, Ghafoor S, Kenkel D, et al. Simultaneous multi-slice readout segmented echo-planar imaging for accelerated diffusion-weighted imaging of the breast. Eur J Radiol 2016;85:274–278.
2. Zhou J, Payen JF,Wilson DA,et al.Using the amide proton signals of intracellular proteins and peptides to detect pH effects in MRI[J].Nature medicine,2003,9(8):1085-1090.
3. Le Bihan D, Breton E,Lallemand D,et al.MR imaging of intravoxel incoherent motions: application to diffusion and perfusion in neurologic disorders[J].Radiology,1986,161(2):401-407.
4. Krikken E, Khlebnikov V, Zaiss M, et al.Amide chemical exchange saturation transfer at 7T: a possible biomarker for detecting early response to neoadjuvant chemotherapy in breast cancer patients[J].Breast cancer research : BCR,2018,20(1):51.
5. Cho GY, Moy L,Kim SG,et al.Evaluation of breast cancer using intravoxel incoherent motion (IVIM) histogram analysis: comparison with malignant status, histological subtype, and molecular prognostic factors[J].European radiology,2016,26(8):2547-2558.
6. Ohno Y, Yui M, Koyama H, et al.Chemical Exchange Saturation Transfer MR Imaging: Preliminary Results for Differentiation of Malignant and Benign Thoracic Lesions. Radiology,2016,279(2):578-589.
7. Vidić I, Jerome NP, Bathen TF,et al.Accuracy of breast cancer lesion classification using intravoxel incoherent motion diffusion-weighted imaging is improved by the inclusion of global or local prior knowledge with bayesian methods[J].Journal of magnetic resonance imaging: JMRI,2019,50(5):1478-1488.
Figures