2333
A Pilot Evaluation of IVIM Imaging Combined with DCE-MRI Characterize Architectural Distortion Detected on Mammography1Radiology Department, The First Affiliated Hospital of Dalian Medical University, DaLian, China, 2GE Healthcare, MR Research China, Beijing, Beijing, China
Synopsis
Intravoxel incoherent motion (IVIM) imaging provides quantitative measurement of cellularity and vascularity. The parameters derived from IVIM can distinguish malignant and benign breast tumors. This study concerned clinical and conventional MRI features, perfusion as well as diffusion parameters using IVIM imaging, and then compared these parameters to conventional MRI images on the classification of Architectural Distortion lesions detected on Mammography.
Introduction
Architectural distortion (AD) is the third most common mammographic manifestation of nonpalpable breast cancer[1]. Primary AD, including all causes without a known history of breast intervention, trauma, or infection, has been found to be associated with breast malignancy in one-half to two-thirds of the cases in which it was observed. AD may mimic the normal appearance of overlapping breast tissue, which can be subtle and particularly difficult to detect on mammography. Previous studies had showed that dynamic contrast-enhanced magnetic resonance imaging (DCE-MRI) and normalized ADC (nADC) values was more reliable than mammography in differentiate the nature of disease manifesting as primary AD on mammography[2,3] . Nevertheless, few investigations have specifically evaluated IVIM findings of AD detected on mammography[4]. In this study, we aimed to evaluate the diagnostic values of IVIM combined with DCE-MRI in lesions that manifested with AD on mammography.Methods
Forty-four AD cases on full-field digital mammography (FFDM) images with preoperative examinations including conventional MRI and axial IVIM were performed from July 2015 to October 2019. The cases were enrolled in this study with pathologically confirmed by percutaneous biopsies or surgery. Two independent radiologists reviewed all MRI data and recorded lesion characteristics according to the Breast Imaging Reporting and Data System (BI-RADS,2013). The enrolled patients were categorised into three groups: invasive cancer, intraductal cancer in situ (DCIS) and benign lesions. Conventional MRI and DCE-MRI morphologies and clinical information, such as age of presentation, were analysed using a chi-square test or Fisher’s exact test. Analysis was performed using SPSS software (SPSS Version 19, SPSS Inc., Chicago, IL, USA). Student t-test was performed to assess the agreement, P<0.05 was considered indicative of a statistically significant difference among the groups. All statistical analyses concerning of IVIM parameters among the three groups and between any two groups, respectively, were performed using R language.Results
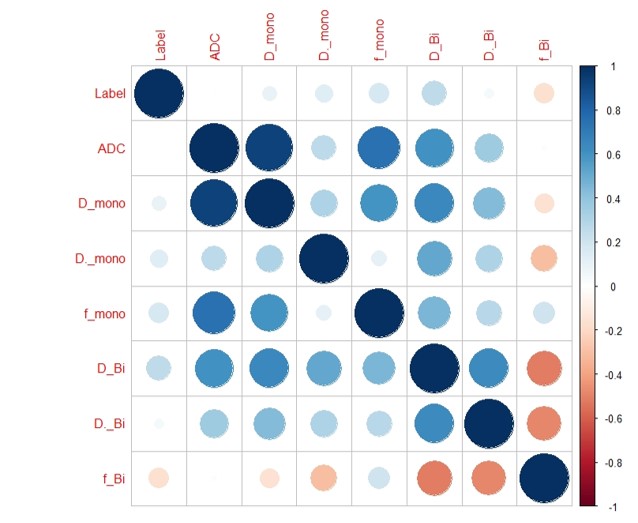
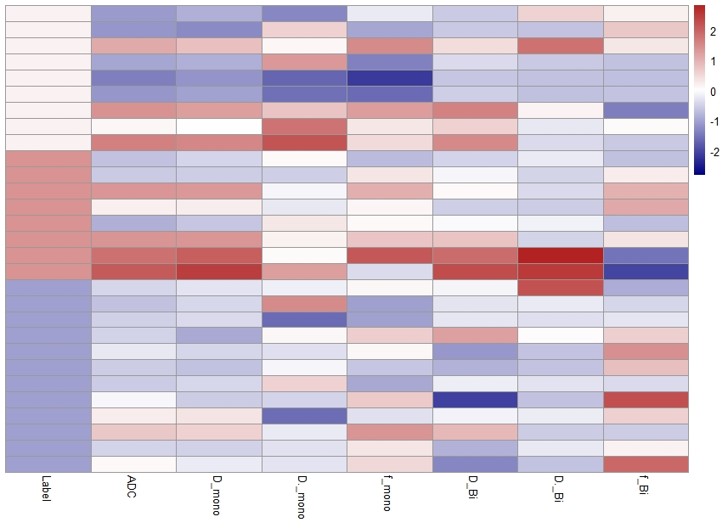
Fifteen of these 44 cases were excluded due to negative on MRI. Thus, 29 lesions with unilateral were enrolled in this study (Group1: 9 invasive cancer, mean age =50.10±12.62; Group2: 7 DCIS, mean age =49.14±7.86; Group3:13 benign lesions, mean age =48.69±12.06). The three groups did not vary significantly in fibrograndular tissue (FGT) (χ2=1.323, P =0.858) ,background parenchymal enhancement (BPE)(χ2=5.141, P=0.273) or enhancement type (χ2=5.684, P =0.224). Most of lesions were c degree of FGT (Group1:4/9, Group2:5/7, Group3:7/13) and minimal BPE (Group1:6/9, Group2:3/7, Group3:10/13). Non-mass enhancement (NME) was found in Group1(6/9) and Group2 (6/7), mass enhancement was found in Group3 (8/13). There was significant difference in type of kinetic curve (χ2=14.989, P =0.005) among the three groups. Most of malignant AD lesions (15/16) showed plateau type except one with washout type of kinetic curve. All benign lesions manifested persistent type of kinetic curve. The distribution of IVIM parameters among the three groups were showed in Fig1 and Fig2. Lower D * and higher f value of malignant lesions were showed compared with benign lesions.Discussion and Conclusion
Lesions showing AD are challenging to diagnose and remain a common cause of false-negative mammography, because of subtlety and variability in presentation[2,3]. Few investigations have specifically evaluated DCE-MRI combined with ADC values provides a higher specificity than DCE-MRI in AD lesions detected by FFDM[1]. The results of this preliminary study suggest that there is significant difference when considering plateau type of kinetic curve in verifying malignancy. There were some characteristics on DCE among different pathological breast AD lesions including FGT, BPE, and enhancement type. We also can speculate lower D * and higher f value of malignant AD lesions. It reflects that IVIM-DWI might provide helpful tissue characterization parameters in AD lesions.Acknowledgements
This work was supported by the grant of the Basic Scientific Research Projects of the Universities in Liaoning Province (5061104) and The Provincical Natural Science Foundation of China (2019-ZD-0907) .References
[1] Ethan Cohen, MD, Jessica W.T. Leung, MD. Problem-Solving MR Imaging for Equivocal Imaging Findings and Indeterminate Clinical Symptoms of the Breast [J]. Magn Reson Imaging Clin N Am, 2018,26(2):221-233.
[2] Iima M, Kataoka M, Kanao S, et al. Intravoxel Incoherent Motion and Quantitative Non-Gaussian Diffusion MR Imaging: Evaluation of the Diagnostic and Prognostic Value of Several Markers of Malignant and Benign Breast Lesions[J]. Radiology, 2018,287(2):432-441.
[3] Si L, Zhai R, Liu X, et al. MRI in the Differential Diagnosis of Primary Architectural Distortion Detected by Mammography[J]. Diagn Interv Radiol, 2016,22(2):141–150.
[4] Giess CS, Chikarmane SA, Sippo DA, et al. Clinical Utility of Breast MRI in the Diagnosis of Malignancy After Inconclusive or Equivocal Mammographic Diagnostic Evaluation[J]. AJR Am J Roentgenol, 2017,208(6):1378-1385.
Figures