2332
Multiparametric approach of diagnosing breast lesions using DWI and ultrafast DCE MRI: compared with conventional DCE MRI1Diagnostic Imaging and Nuclear Medicine, Kyoto University Graduate School of Medicine, Kyoto, Japan, 2Breast Surgery, Kyoto University Graduate School of Medicine, Kyoto, Japan
Synopsis
Ultrafast dynamic contrast-enhanced (UF-DCE) MRI allows us to obtain kinetic information based on early inflow of contrast medium. A prediction model of diagnosing malignancy using maximum slope (MS) derived from UF-DCE MRI, ADC from DWI, lesion size and patient’s age was constructed. The second model using washout index (WI) derived from conventional DCE MRI instead of MS was constructed for comparison. The two multiparametric prediction models achieved almost the same AUC (AUC 0.91 vs 0.89, p=0.20). The multiparametric approach based on UF-DCE MRI, DWI and patient’s age provided excellent diagnostic performance with decreased scanning time.
Purpose
Maximum slope (MS) is one of the kinetic parameters derived from ultrafast dynamic contrast enhance (UF-DCE) MRI, which captures the very early contrast inflow into breast lesions with high spatial and temporal resolution. A previous study reported superior or equivalent diagnostic performance of MS compared to the kinetic information from conventional DCE-MRI, including WI, a semi-quantitative parameter to evaluate washout information [1-3]. Combining the parameters of conventional DCE MRI and DWI has superior diagnostic performance for breast cancer compared to DCE MRI alone, especially in specificity, presumably because DCE MRI and DWI evaluate different aspects of breast cancer [4-6]. However, the evidence is limited for the multiparametric approach using UF-DCE MRI. Also, there are other well-known parameters associated with malignancy of breast lesion including patient’s age and lesion size [7-8]. The purpose of this study is to evaluate diagnostic performance of multiparametric prediction model using DWI and UF-DCE MRI, compared with conventional DCE MRI. Patient’s age and lesion size were also used in the model.Material and Methods
Study population: In total 96 consecutive patients with 113 enhancing lesions (77 malignant / 36 benign lesions) were included. Pathological diagnosis of malignant lesions consisted of invasive ductal carcinoma (n=57), DCIS (8), invasive lobular carcinoma (6), mucinous carcinoma (2), other carcinoma (4). Benign lesions consisted of fibroadenoma (n=13), fibrocystic change (9), intraductal papilloma (6), phyllodes tumor (3), and other benign lesion (5).Image acquisition: Breast MRI studies were performed with a 3.0T scanner (MAGNETOM Skyla or Prisma: Siemens Healthcare GmbH) with 16 or 18ch dedicated bilateral breast coil. T2-weighted, T1-weighted, diffusion weighted (TR/TE 9200/ 57, 6300/ 50; FA 90; 2.0×2.0×3.0 mm3/voxel; 60 seconds) and fat-suppressed T1-weighted DCE images (TR/TE 3.8/1.4 ms; FA 15; 0.86×0.86×1.0 mm3/voxel) were obtained. Improved VIBE sequence were acquired 15 seconds before and 60 seconds after contrast injection, 2 seconds preparation time followed by 20 continuous phases taken at a rate of 3.7 s/phase (TR/TE 5.0-4.8/2.5; FA 15; 0.94×0.94×2.5 mm3/voxel). Two post contrast standard DCE images were obtained 1-2 min and 5-6 min after contrast injection.
Image analysis: The Maximum Slope (MS), a parameter to quantify contrast inflow in UF-DCE MRI (Improved VIBE, prototype), was evaluated using dedicated software (TWIST Breast Viewer, prototype), and calculated from percentage relative enhancement/second [%/s] (Fig.1). To quantify the value of the highest MS, 3mm circular ROIs were placed manually on the hotspot of the lesion in color coded MS maps using AQ net viewer (TERA recon), and mean MS values were recorded. As a semi-quantitative parameter for conventional DCE, we evaluated the washout index (WI) in ROI with highest washout with 3mm circular ROIs. WI was defined as WI=(SI delay-SI early)/ SI pre x100 (%) [3] (Fig. 1). ADC maps were automatically created from DWI at b=0 and b=1000 sec/mm². To quantify the value of the lowest ADC, 3mm circular ROIs were placed manually on the area with restricted diffusion on ADC maps, and mean ADC values were recorded.
Statistical analysis: Univariate logistic regression analysis was performed using MS, ADC, lesion size and patient’s age to select significant parameters for diagnosing malignant breast lesions. Then, multivariate logistic regression analysis was performed. A model to predict the probability of malignancy was constructed in multivariate logistic regression analysis (analysis 1, prediction model 1). Another prediction model using WI instead of MS was constructed in the same way including multivariate logistic regression analysis (analysis 2, prediction model 2). Then, the area under the ROC curve (AUC) of two prediction models were compared using DeLong’s test. Optimal cut-off point for diagnosing malignant lesions were determined as the value that maximize Youden index to calculate sensitivity and specificity. A p-value <0.05 was used as a criterion of statistical significance.
Results
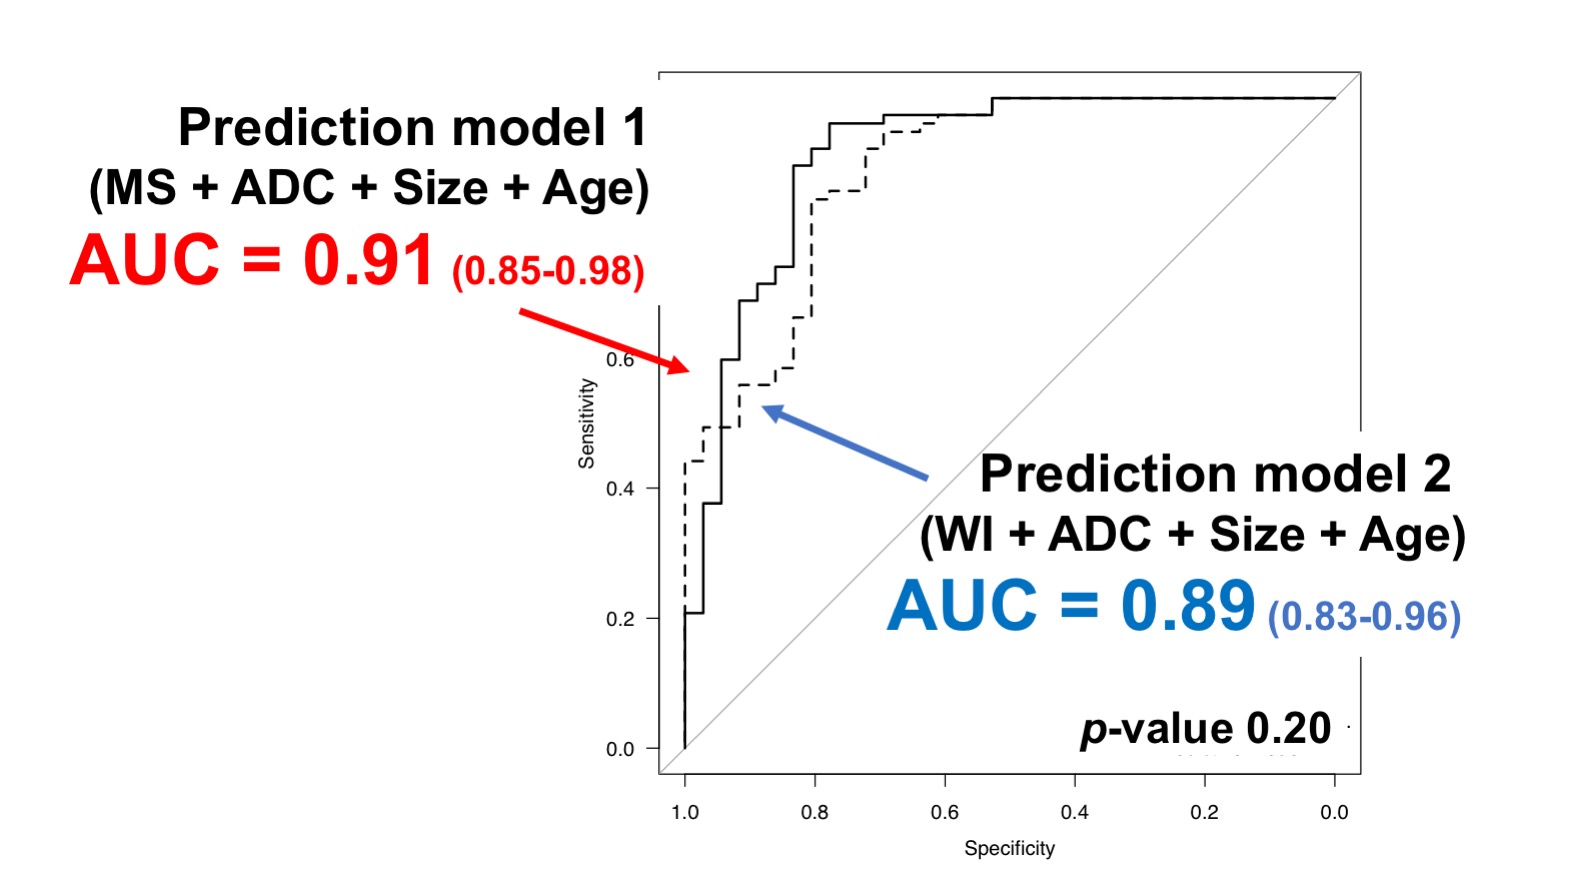
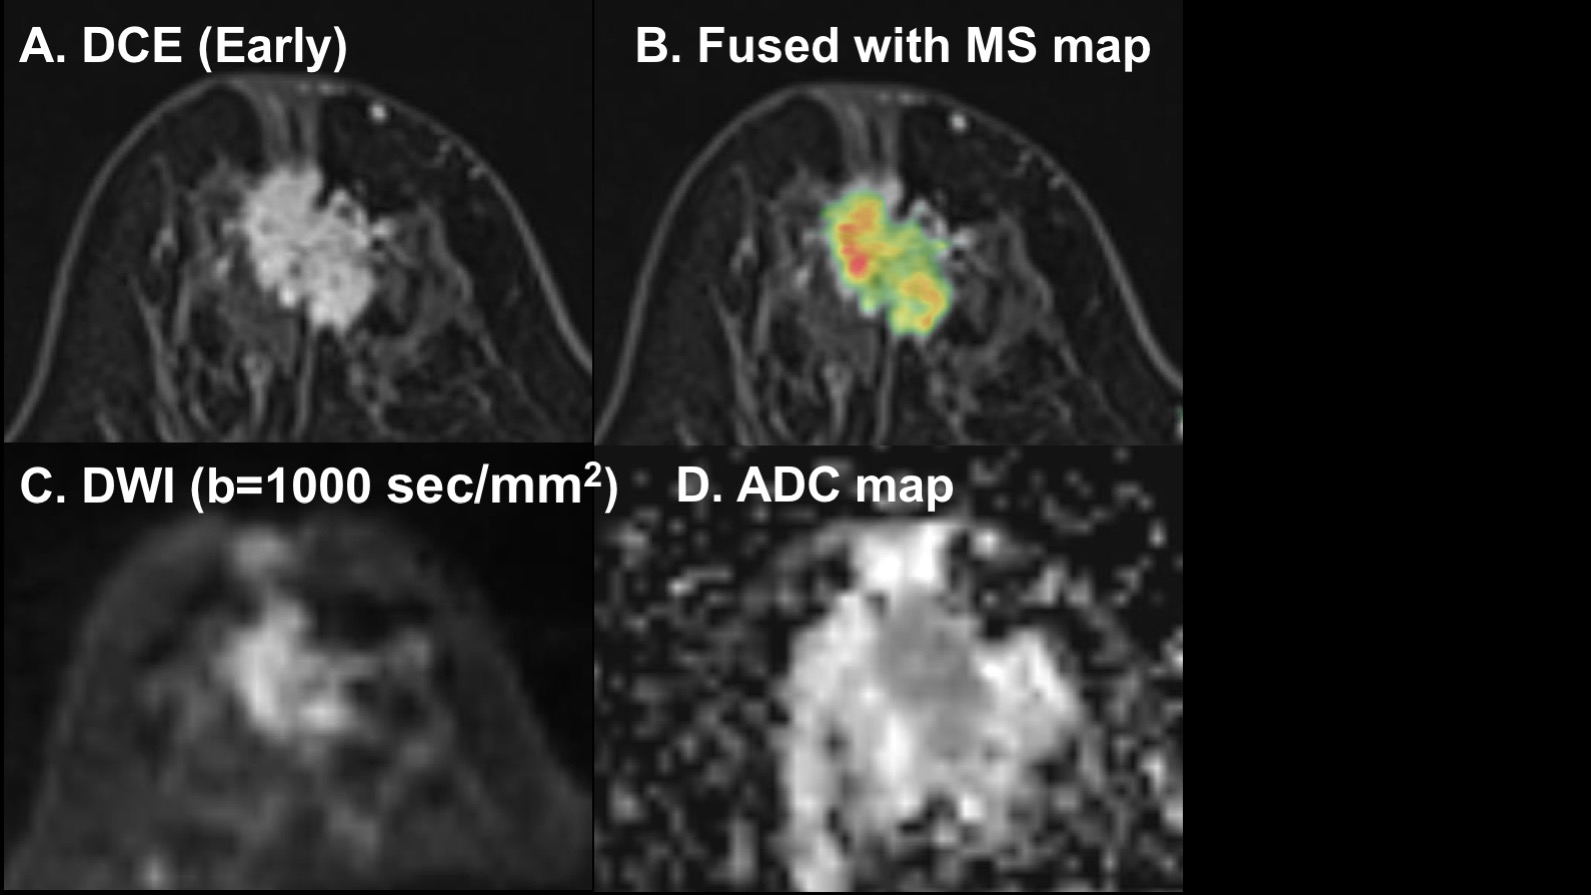
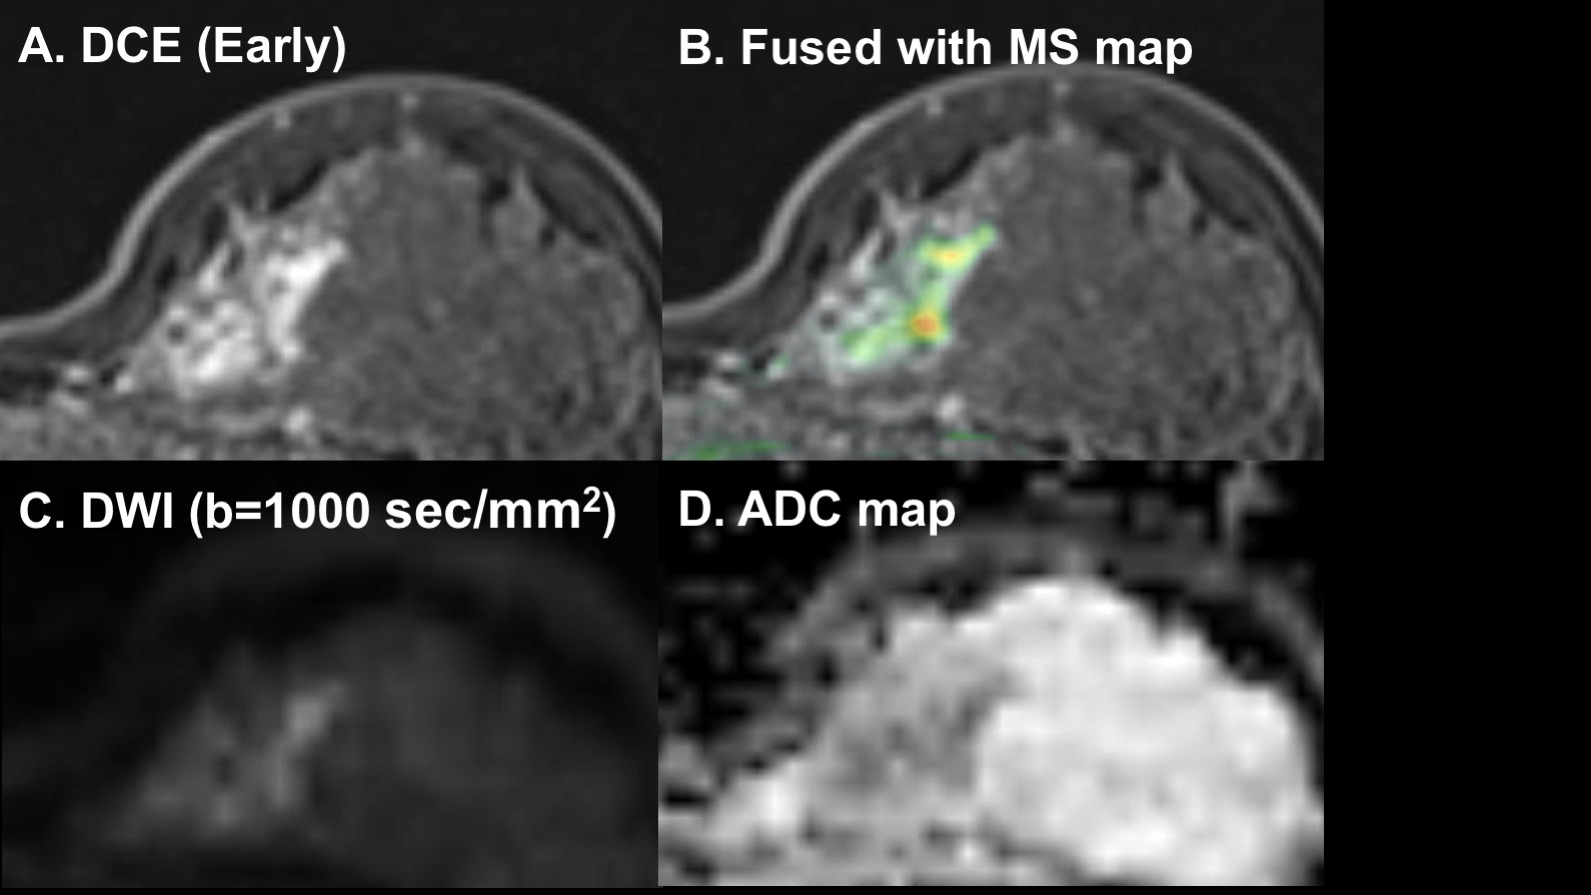
Univariate logistic regression analysis revealed that all parameters showed significant difference between malignant and benign lesions (p<0.05). ADC showed the highest AUC (0.86) among all parameters. Multivariate logistic regression analysis revealed significant difference in all parameters between malignant and benign lesions (p<0.05), except lesion size in analysis 1 (Fig. 2). Comparing diagnostic performance of both prediction models, the model 1 demonstrated almost the same AUC as the model 2 (AUC 0.91 vs 0.89, p=0.20) (Fig. 3). Sensitivity and specificity of the model 1 were 97%/ 78%, that of the model 2 were 84%/ 81%. Representative cases are shown in Fig 4-5.Discussion
The predictive model using MS provided excellent diagnostic performance for malignant breast lesions comparable to the model using WI. ADC itself showed high diagnostic performance approaching to the level of the prediction model. However, kinetic information contributed to even better diagnostic performance of the model. These results indicate that UF-DCE MRI might be alternatively used instead of full protocol of conventional DCE MRI because of shorter scanning time. Addition of DWI to UF-DCE MRI would require approximately only two more minutes’ acquisition time, which would be shorter than conventional breast DCE MRI in our study.Conclusion
The multiparametric approach based on UF-DCE MRI, DWI, lesion size, and patient’s age provided excellent diagnostic performance with decreased scanning time than conventional breast MRI.Acknowledgements
JSPS KAKENHI Grant Number 15K09922 and MEXT grant numbers 25120002, 25120008.
We thank Dr. Marcel Dominik Nickel, Siemens Healthcare GmbH, for support with the MR application predevelopment.
References
1 Mann R. et al, Investigative Radiology 49:579-585 (2014)
2 Honda M. et al, J Magn Reson Imaging 2019 Jun 18
3 Ohashi A. et al, Eur J Radiol 2019 Sep;118:285-292.
4 Kul S. et al, AJR 2011;196(1):210-7.
5 Pinker K. et al, Radiology 2015;276(2):360-70.
6 Zhang L. et al, Acta Radiol 2016;57(6):651-60.
7 Kawai M. et al, Magn Reson Med Sci 17(3) (2018) 203-210.
8 Onishi N. et al, European Radiology. 2019 Aug 29.
Figures
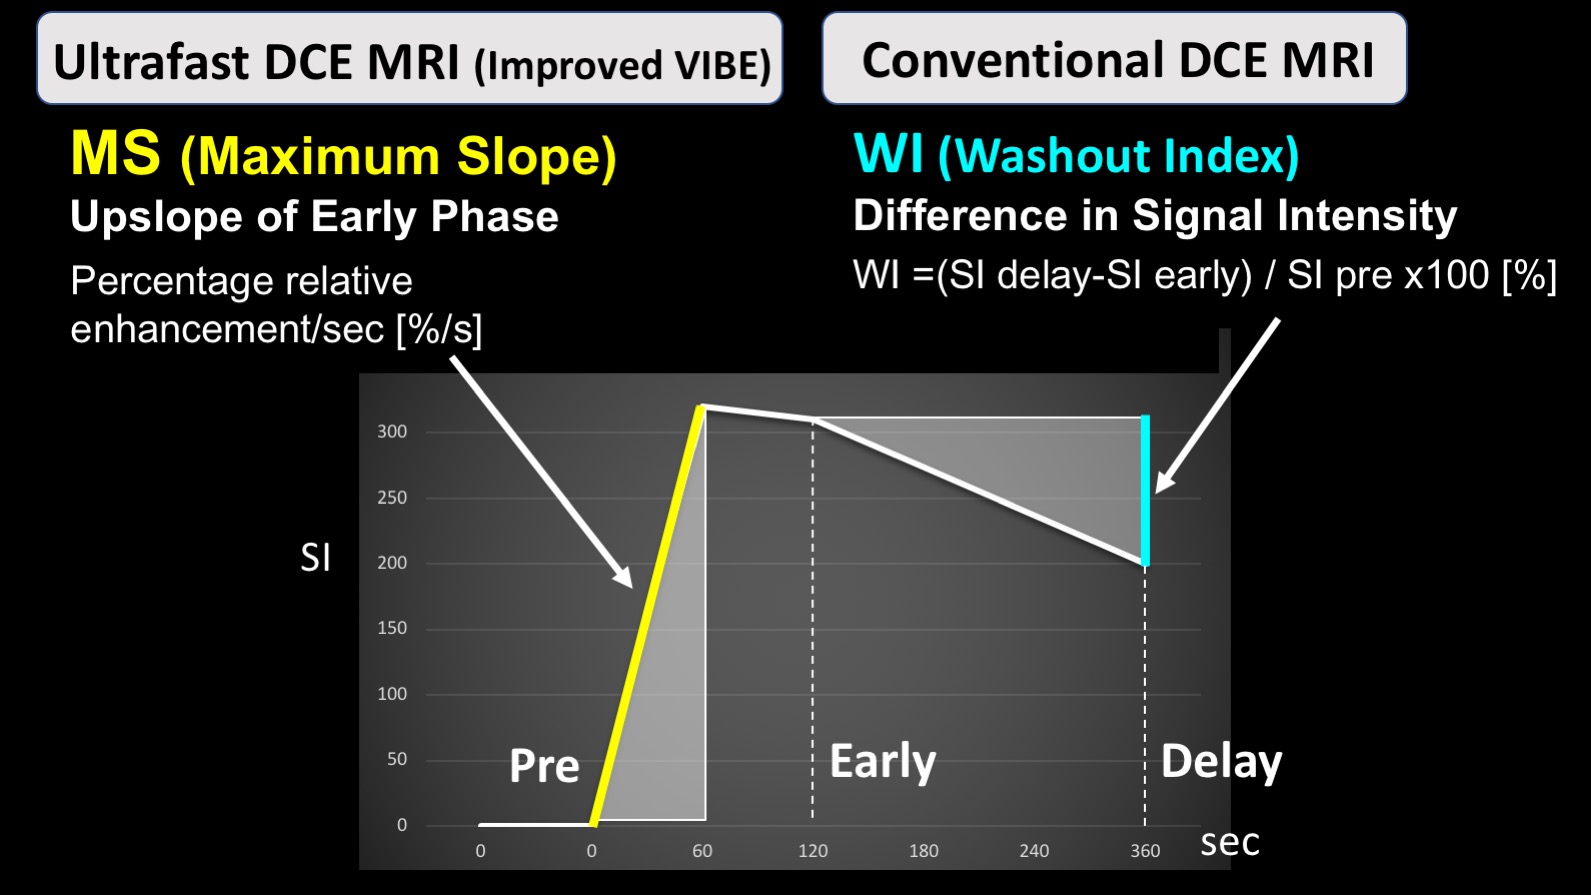
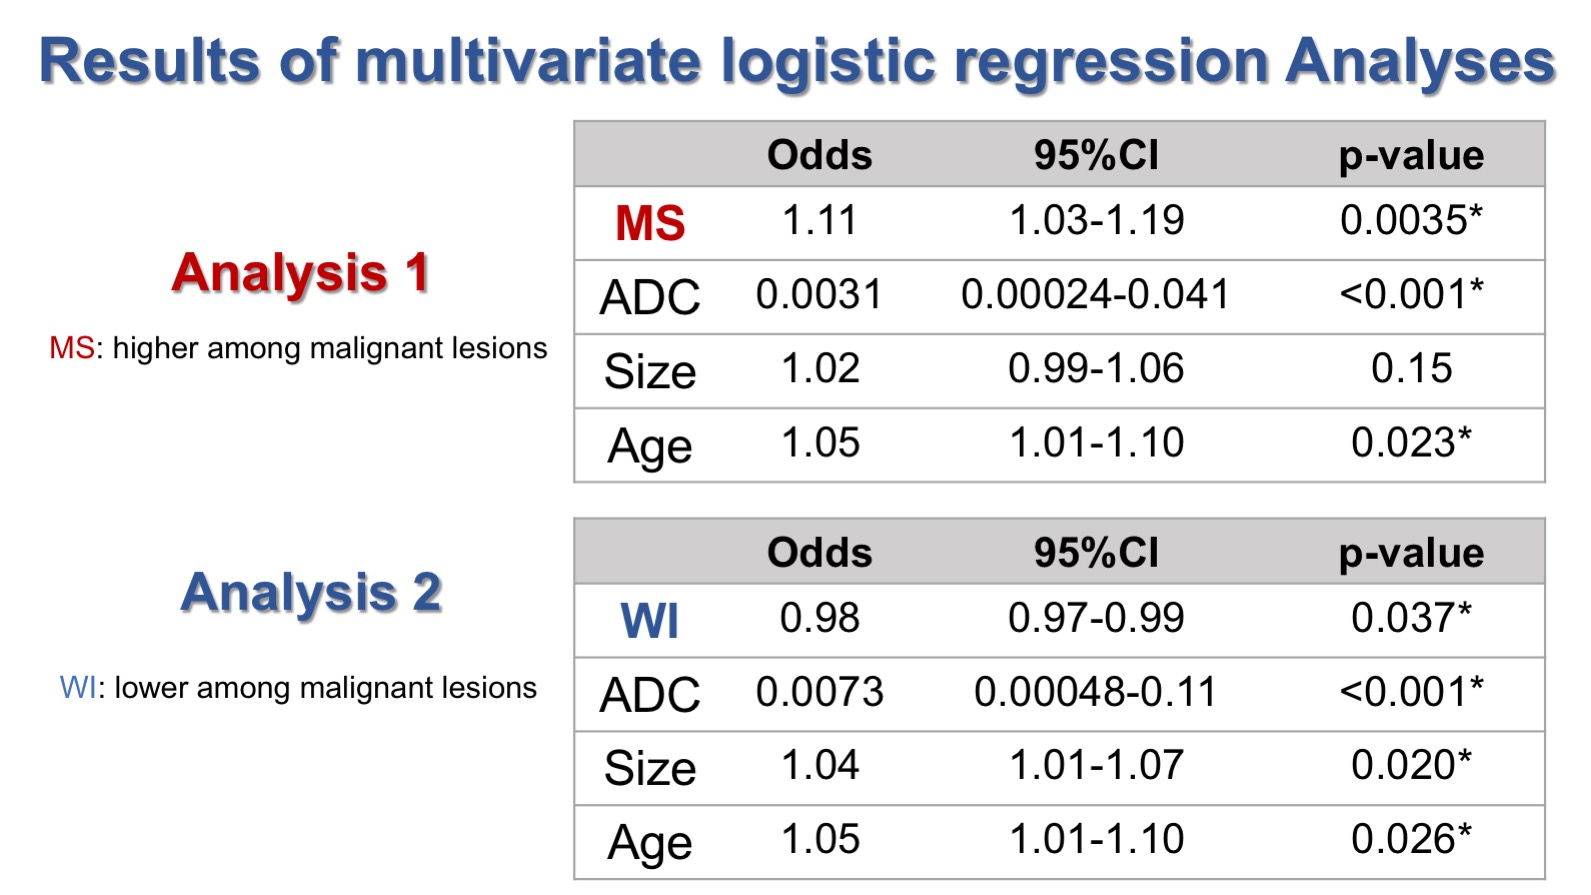
Fig. 2 Results of two multivariate logistic regression analyses.
*, Factors that remained statistically significant (p<0.05). MS maximum slope, ADC apparent diffusion coefficient, WI washout index, CI confident interval