2330
Discrimination of breast cancer from healthy breast tissues using a tri-exponential model1Department of Circulation and Medical Imaging, Norwegian University of Science and Technology, Trondheim, Norway, 2Department of Radiology, University of California, San Diego, La Jolla, CA, United States, 3Department of Physics, Norwegian University of Science and Technology, Trondheim, Norway, 4School of Medicine, University of California, San Diego, La Jolla, CA, United States, 5Department of Radiology and Nuclear Medicine, Norwegian University of Science and Technology, Trondheim, Norway, 6Department of Neurosciences, University of California, San Diego, La Jolla, CA, United States
Synopsis
The purpose of this work was to develop a method to discriminate breast cancer from healthy breast tissues using signal contribution maps from multi-b diffusion MRI acquisitions. Signal contributions were estimated using a tri-exponential model, with the ADC values for three distinct compartments assumed fixed across voxels and subjects. A linear discriminant function was constructed using the estimated signal contributions from the two lowest ADC components. Average ROC AUC for discriminating cancer from healthy breast tissues was 0.99 (CI95% = 0.98-1.00), superior to that of independent signal contributions, maximum b-value volume and conventional DWI estimates (ADC and apparent diffusion kurtosis).
Background
Diffusion-weighted imaging (DWI) has demonstrated comparable ability to gold-standard dynamic contrast-enhanced (DCE) imaging in discriminating between pre-defined benign and malignant lesions in small regions of interest (ROIs) in the breast[1]. However, DWI-based tools are underexplored for discrimination of cancer tissue from all other breast tissues, which is more relevant for general radiological evaluation, breast cancer screening, treatment evaluation, and surveillance, in the absence of pre-defined lesions.Multi-exponential modelling of signal over broad b-value ranges theoretically isolates the slowly-diffusing water component present in cancer tissue, in several organs[2-7]. The multi-exponential model has been investigated for breast cancer and healthy breast tissues, showing that the signal contribution of the two slowest components from a tri-exponential model had ~45 times higher cancer conspicuity compared to conventional DWI estimates[8]. This motivated our work to evaluate the ability of the contribution from these components to discriminate breast cancer from healthy breast tissues.
Methods
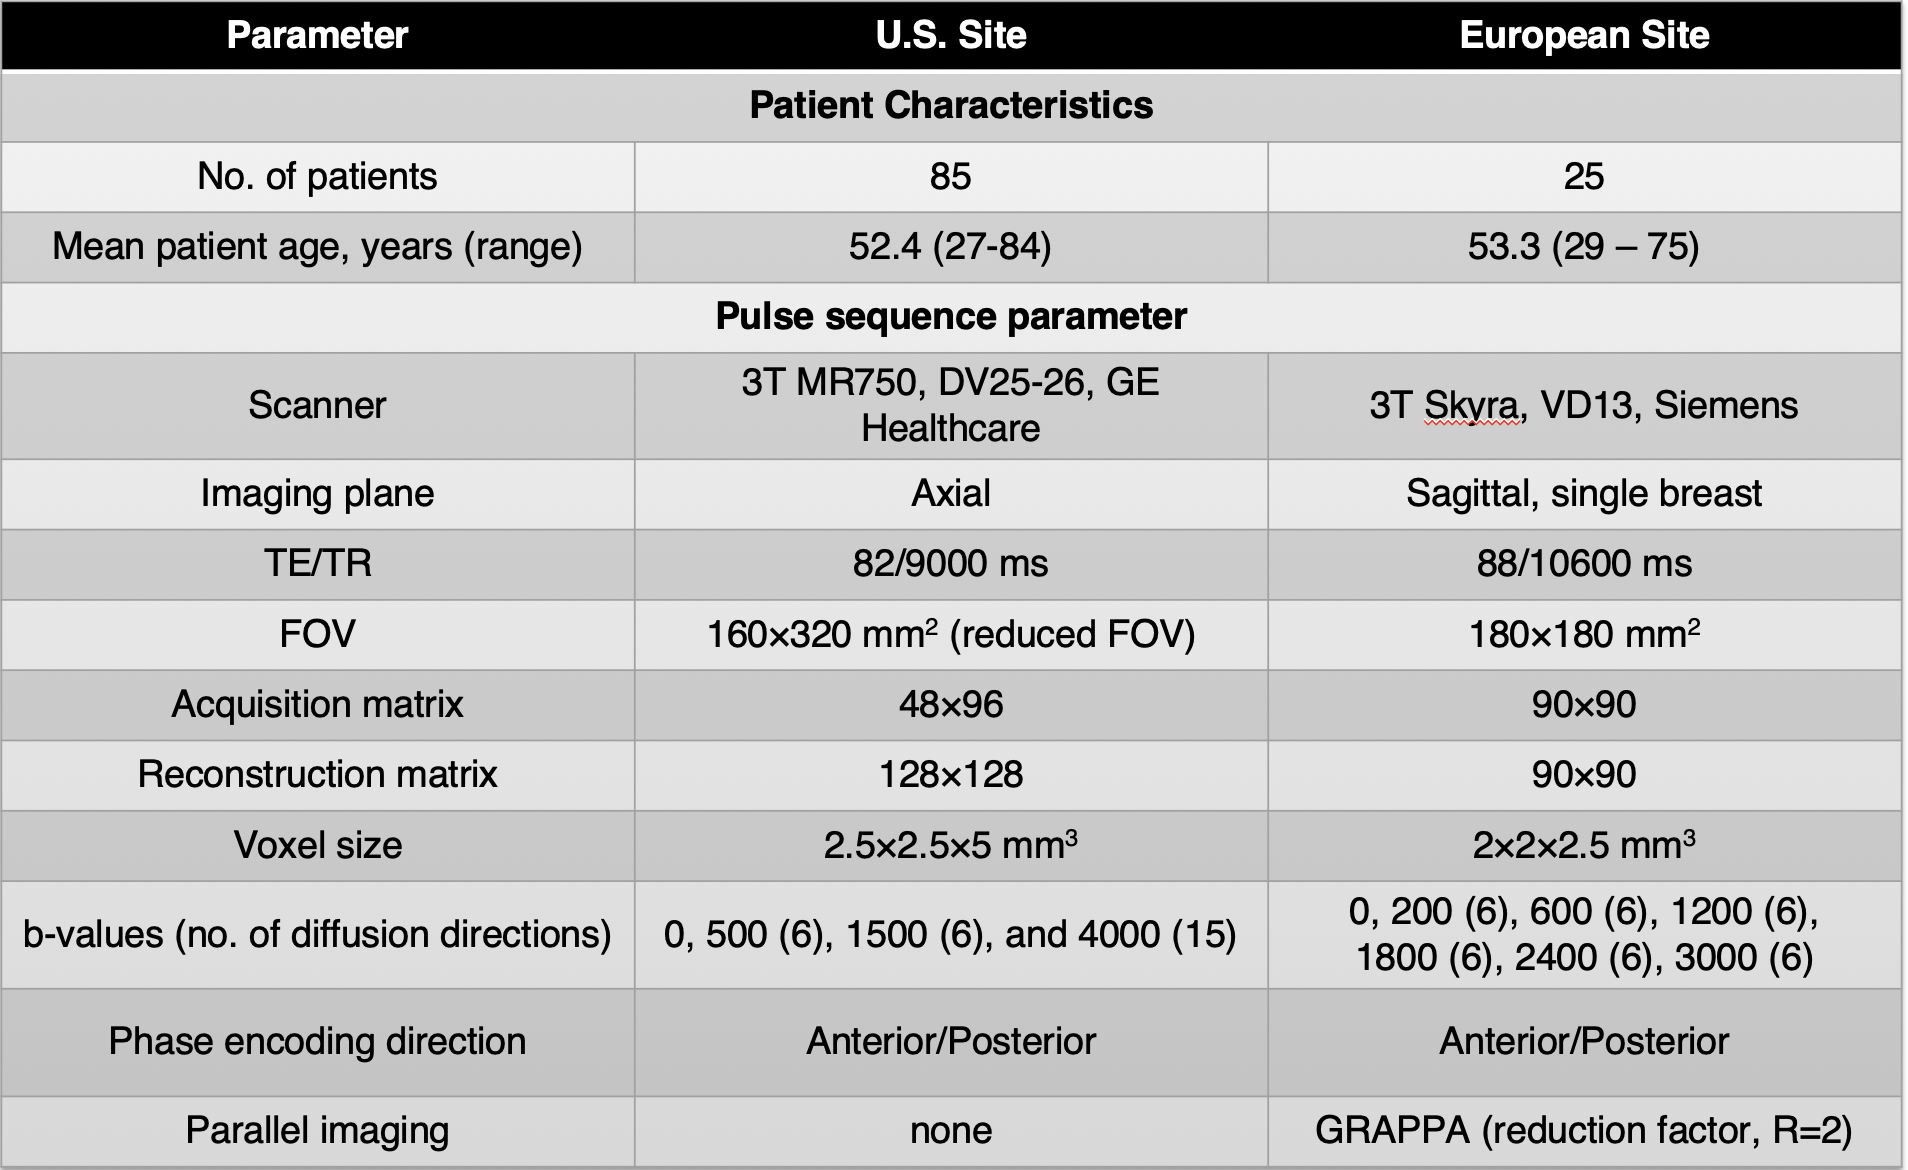
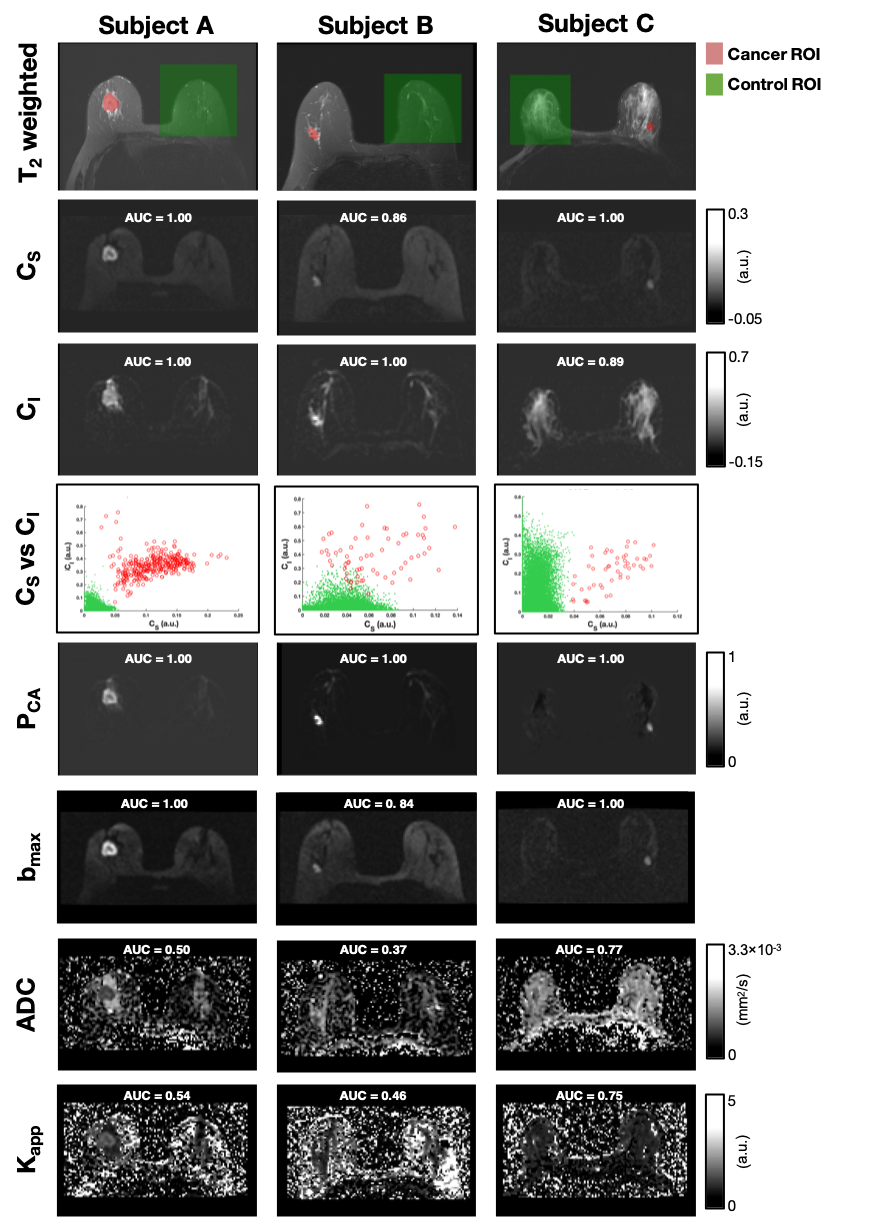
In order to validate the discriminatory power of the tri-exponential model across scanners and sites, two datasets of biopsy-proven breast cancer patients from a U.S. site (n=85) and a European site (n=25) were included. Note that 48 of the cases from the U.S. site and all cases from the European site were used to determine the tri-exponential model with fixed apparent diffusion coefficients (ADCs) in [8]. Both datasets included Gadolinium DCE-MRI and DWI acquisition; further details are given in Table.DWI data were averaged across directions for each b-value, noise corrected[9], and normalized to the maximum signal intensity value in the b=0 s/mm2 volume to preserve T2 influence on DWI data. Full volume ROIs were manually defined on DWI images assisted by T2 and DCE images (Figure 1) and validated by a breast radiologist. Cancer ROIs were drawn for the site of the biopsy-proven cancer, and control ROIs were drawn in the cancer-free contralateral or ipsilateral breast, excluding the axillary region and large cysts (>2.5 cm).
The DWI signal was modelled as a linear combination of three exponential decays across all available b-values, given as:
$$S_{DWI}(b) = C_s\cdot e^{-b\cdot 1.6 \cdot 10^{-9} mm^{2}/s} + C_I\cdot e^{-b\cdot 1.4 \cdot 10^{-3} mm^{2}/s} + C_F\cdot e^{-b\cdot 8.9 \cdot 10^{-3} mm^{2}/s},$$
where SDWI is the diffusion signal in arbitrary units, b is the b-value in s/mm2, and the voxel-wise unit-less signal contribution of each component is denoted C. The components were named “slow”, “intermediate”, and “fast” and given subscripts S, I, and F, respectively. Each component was fixed to the ADC value providing the best fit across all voxels from both healthy breast tissues and cancer tissue, patients and sites, reported in [8]. Fixing ADCs ensures comparability of signal contributions across voxels and patients, and avoids over-fitting.
The cancer probability (PCA) was estimated using a linear regression model including CS and CI, and CS*CI :
$$P_{CA} = B_0 + B_1 \cdot C_s + B_2 \cdot C_I + B_3 \cdot C_s \cdot C_I,$$
where PCA is set to 0 or 1 in the fitting, based on the manual annotations. CF was not included in the regression model, due to the low conspicuity[8]. The following parametric maps were estimated: PCA, CS, CI, maximum b-value volume (bmax), conventional ADC (ADC) and apparent diffusion kurtosis (Kapp)[10].
Performance in discriminating between cancer and healthy breast tissues was assessed for all voxels by receiver operating characteristic (ROC) and the corresponding area under the curve (AUC) for all parametric maps.
Results
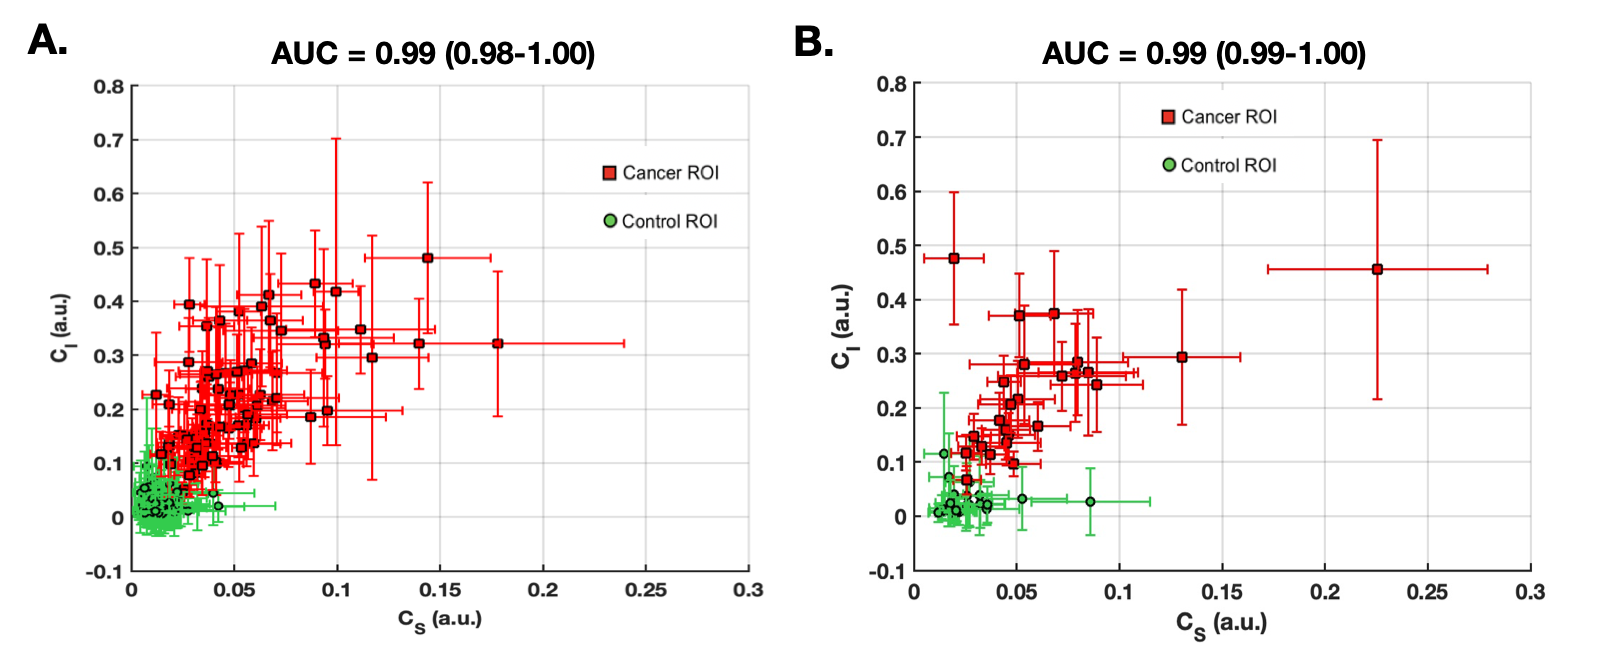
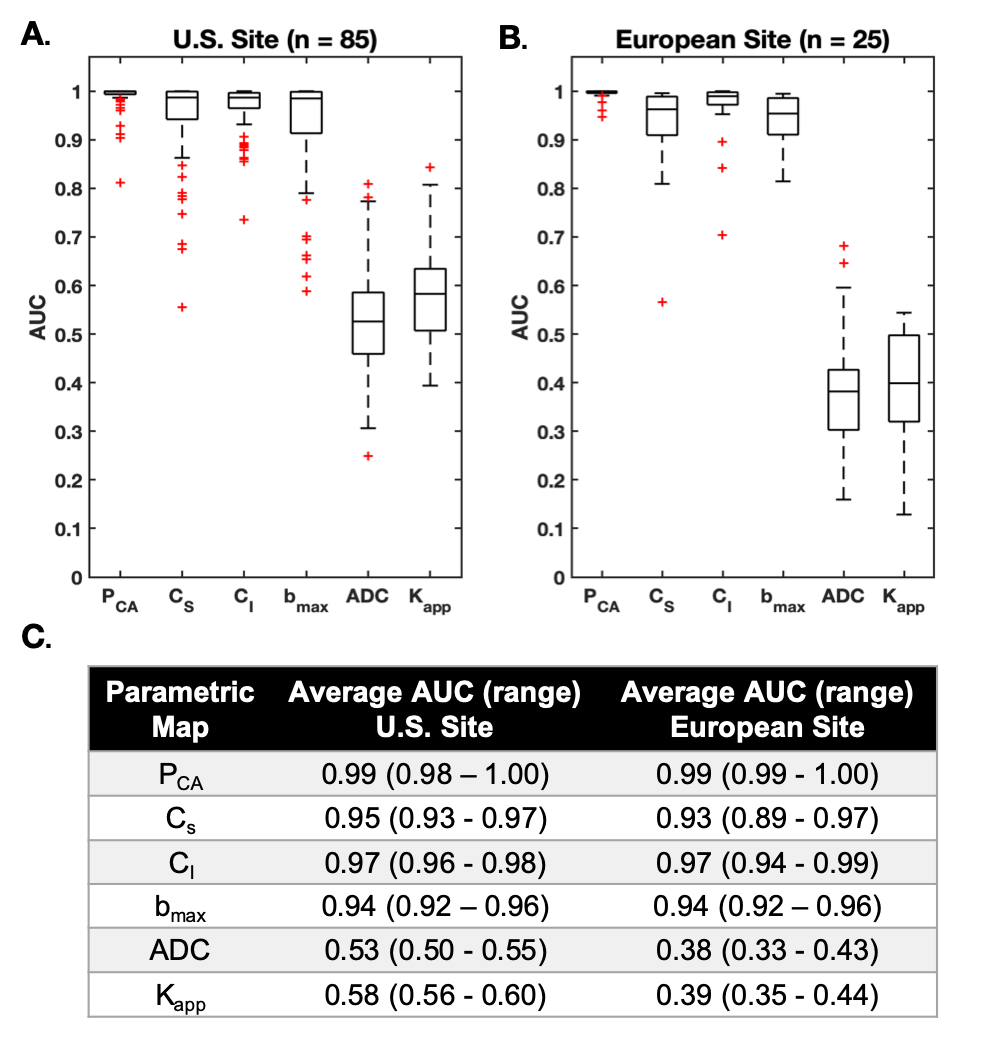
Linear regression for PCA map estimation yielded the following average values (+/-std) for coefficients B0, B1, B2 and B3: -0.01 (0.02), 0.46 (2.51), -0.05 (1.00) and 75.53 (78.04) for the U.S site and -0.03 (0.08), 0.97 (3.73), 0.07 (1.36) and 69.90 (67.96) for the European site. The relationship between CS and CI demonstrated a good two-dimensional separation between cancer (high on both dimensions) and control ROIs (Figure 2, Figure 4 row 4). Average AUCs for both sites were in the range of 0.93-0.99 (CI95% =0.89-1.00) for PCA, CS, and CI, 0.94 (CI95% =0.92-0.96) for bmax and 0.38-0.58 (CI95% =0.33-0.60) for ADC and Kapp (Figure 3).Discrimination performance varied depending on healthy tissue composition in relation to the magnitude of CS and CI in cancer tissue. AUCs were lower for CS, bmax, ADC and Kapp in a case with abundant suppressed fat tissue and high CI-magnitude of corresponding cancer tissue (Figure 4B), compared to abundant fibroglandular tissue and high CS-magnitude of corresponding cancer tissue (Figure 4C). Opposite was seen for CI, while PCA maps performed well across cases.
Discussion and Conclusion
Cancer probability maps PCA, displayed excellent discrimination performance (average AUC 0.99, CI95% =0.98-1.00) between cancer and healthy breast tissues. PCA share the same basic properties as bmax images (diffusion- and T2 weighting), however by combining information from the signal contributions of the two slowest components of a tri-exponential model we are able to suppress more of non-cancer tissue enhancement (e.g. fat). In addition, we hypothesize that a contributing factor to low discrimination performance of Kapp and ADC is a restricted diffusion component from suppressed fat tissue, also evident in the slightly lower performance of CS compared to CI and PCA. Our results warrant large scale studies for validation of PCA maps in routine breast cancer detection and follow-up.Acknowledgements
California Breast Cancer Research Program Early Career Award, GE Healthcare, Fulbright Scholarship Program and the Research Council of Norway.References
1. Chen, X., et al., Meta-analysis of quantitative diffusion-weighted MR imaging in the differential diagnosis of breast lesions. BMC Cancer, 2010.
2. White, N.S., et al., Diffusion-weighted imaging in cancer: Physical foundations and applications of restriction spectrum imaging. Cancer Research, 2014.
3. Rakow-Penner, R.A., et al., Novel technique for characterizing prostate cancer utilizing MRI restriction spectrum imaging: proof of principle and initial clinical experience with extraprostatic extension. Prostate Cancer Prostatic Dis, 2015.
4. Rakow-Penner, R.A., et al., Restriction spectrum imaging in breast cancer, in International Society of Magnetic Resonance Medicine. 2016: Singapore.
5. Rakow-Penner, R.A., et al., Restriction Spectrum Imaging in Breast Cancer: Improved Evaluation of Response to Neoadjuvant Chemotherapy, in International Society of Magnetic Resonance in Medicine. 2017: Honolulu, Hawaii.
6. Karunamuni, R.A., et al., Relationship between kurtosis and bi-exponential characterization of high b-value diffusion-weighted imaging: application to prostate cancer. Acta Radiologica, 2018.
7. Panagiotaki, E., et al., Microstructural characterization of normal and malignant human prostate tissue with vascular, extracellular, and restricted diffusion for cytometry in tumours magnetic resonance imaging. Invest Radiol, 2015.
8. Rodríguez-Soto, A.E., et al., Multi-exponential model of diffusion signal in healthy and cancerous breast tissue with fixed ADCs, in International Society of Magnetic Resonance Medicine 2020: Sydney, Australia.
9. Gudbjartsson, H. and S. Patz, The Rician distribution of noisy MRI data.Magn Reson Med, 1995.
10. Jensen, J.H., et al., Diffusional kurtosis imaging: the quantification of non-gaussian water diffusion by means of magnetic resonance imaging. Magn Reson Med, 2005.
Figures