2328
Multi-exponential model of diffusion signal in healthy and cancerous breast tissue with fixed ADCs1Department of Radiology, University of California, San Diego, La Jolla, CA, United States, 2Department of Circulation and Medical Imaging, Norwegian University of Science and Technology, Trondheim, Norway, 3School of Medicine, University of California, San Diego, La Jolla, CA, United States, 4Department of Physics, Norwegian University of Science and Technology, Trondheim, Norway, 5Department of Radiology and Nuclear Medicine, St. Olav's University Hospital, Trondheim, Norway, 6Radiation Medicine and Applied Sciences, University of California, San Diego, La Jolla, CA, United States, 7Department of Neurosciences, University of California, San Diego, La Jolla, CA, United States
Synopsis
Breast DWI has shown great potential to become a contrast-free diagnostic tool for breast cancer. The purpose of this work was to determine a unified model to describe the diffusion signal of cancer and healthy breast tissues, and compare tumor conspicuity of model components to DCE-MRI and DWI estimates. Multi-exponential models with fixed ADCs were determined and the weights of each component estimated. Tumor conspicuity, defined as contrast-to-noise ratio, was found to be ~3 times higher in DCE-MRI than in the weights of multi-exponential components. This model may increase the sensitivity and specificity of DWI for breast cancer diagnosis.
Introduction
Diffusion-weighted imaging (DWI) has shown great potential to become a contrast-free diagnostic tool for breast cancer screening and surveillance. In order for this to occur, DWI must be at least as sensitive and specific as the standard of care dynamic contrast-enhanced (DCE)-MRI. The diffusion signal behavior of certain breast cancer types has been described as bi-exponential [1,2]. This phenomenon is attributed to a shift in the relative size between slow and fast diffusion components due to increased cellularity in cancer [3]. To date, studies characterizing the diffusion properties of breast tissues typically compare DWI estimates between fibroglandular and tumor tissues in small regions of interest (ROIs)[1,4,5]. However, to increase the sensitivity and specificity of breast DWI for diagnostic purposes, it would be advantageous to discriminate cancer from all other healthy breast tissues. Towards this goal, the purpose of this work was to determine a unified multi-exponential model to describe both cancerous and healthy breast tissues, and to evaluate tumor conspicuity compared to DCE-MRI and DWI estimates.Methods
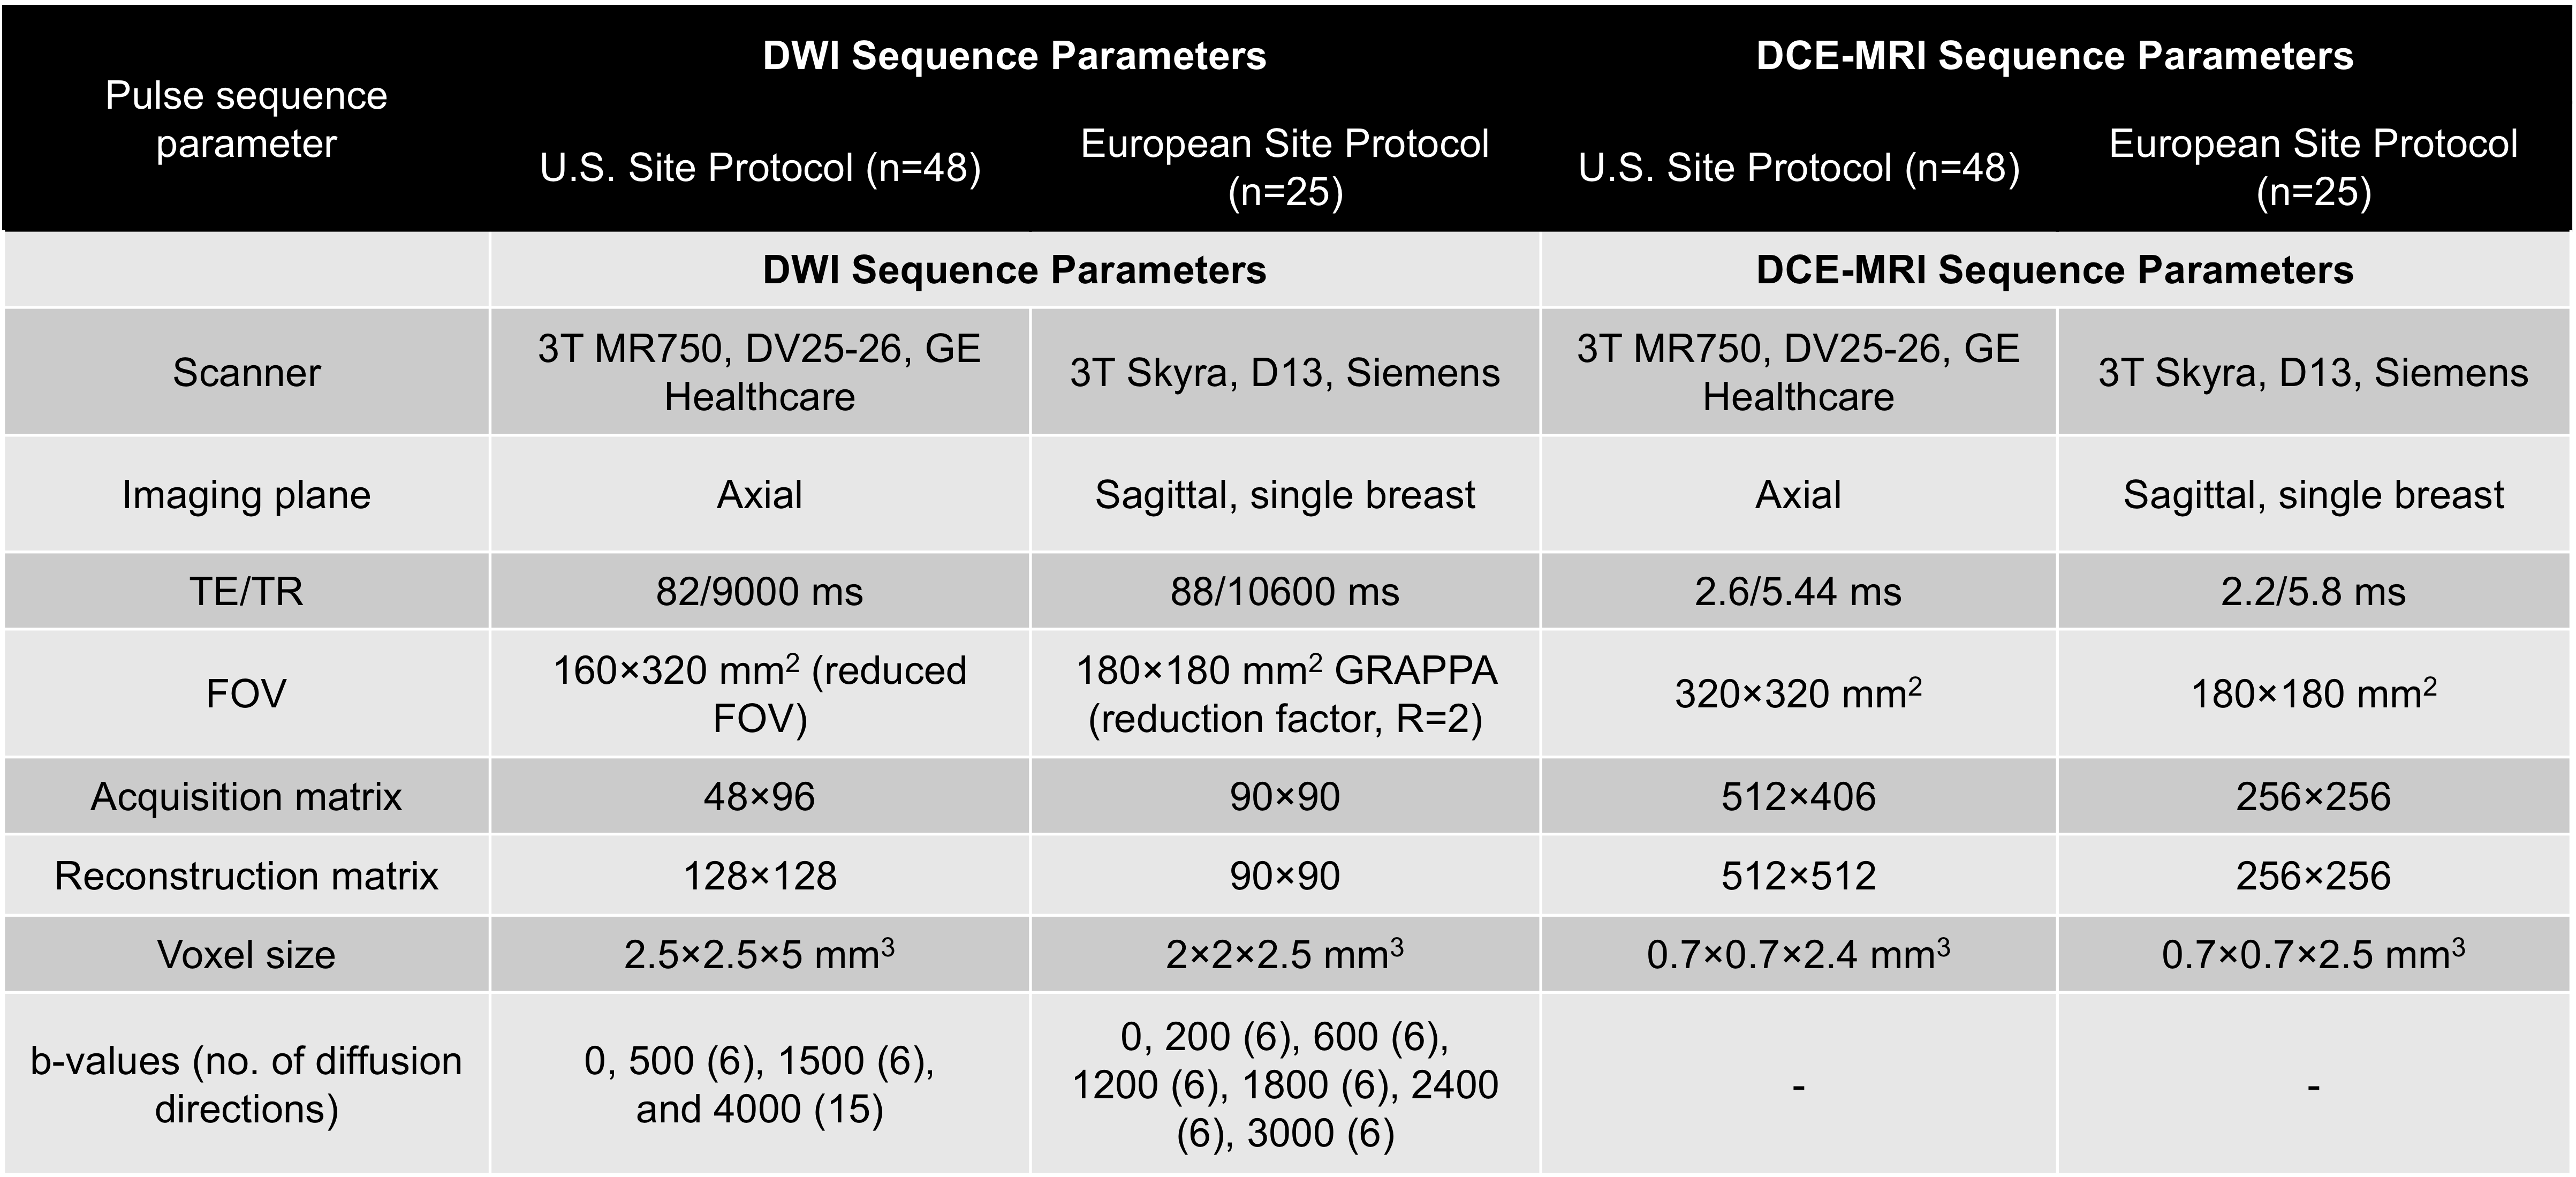
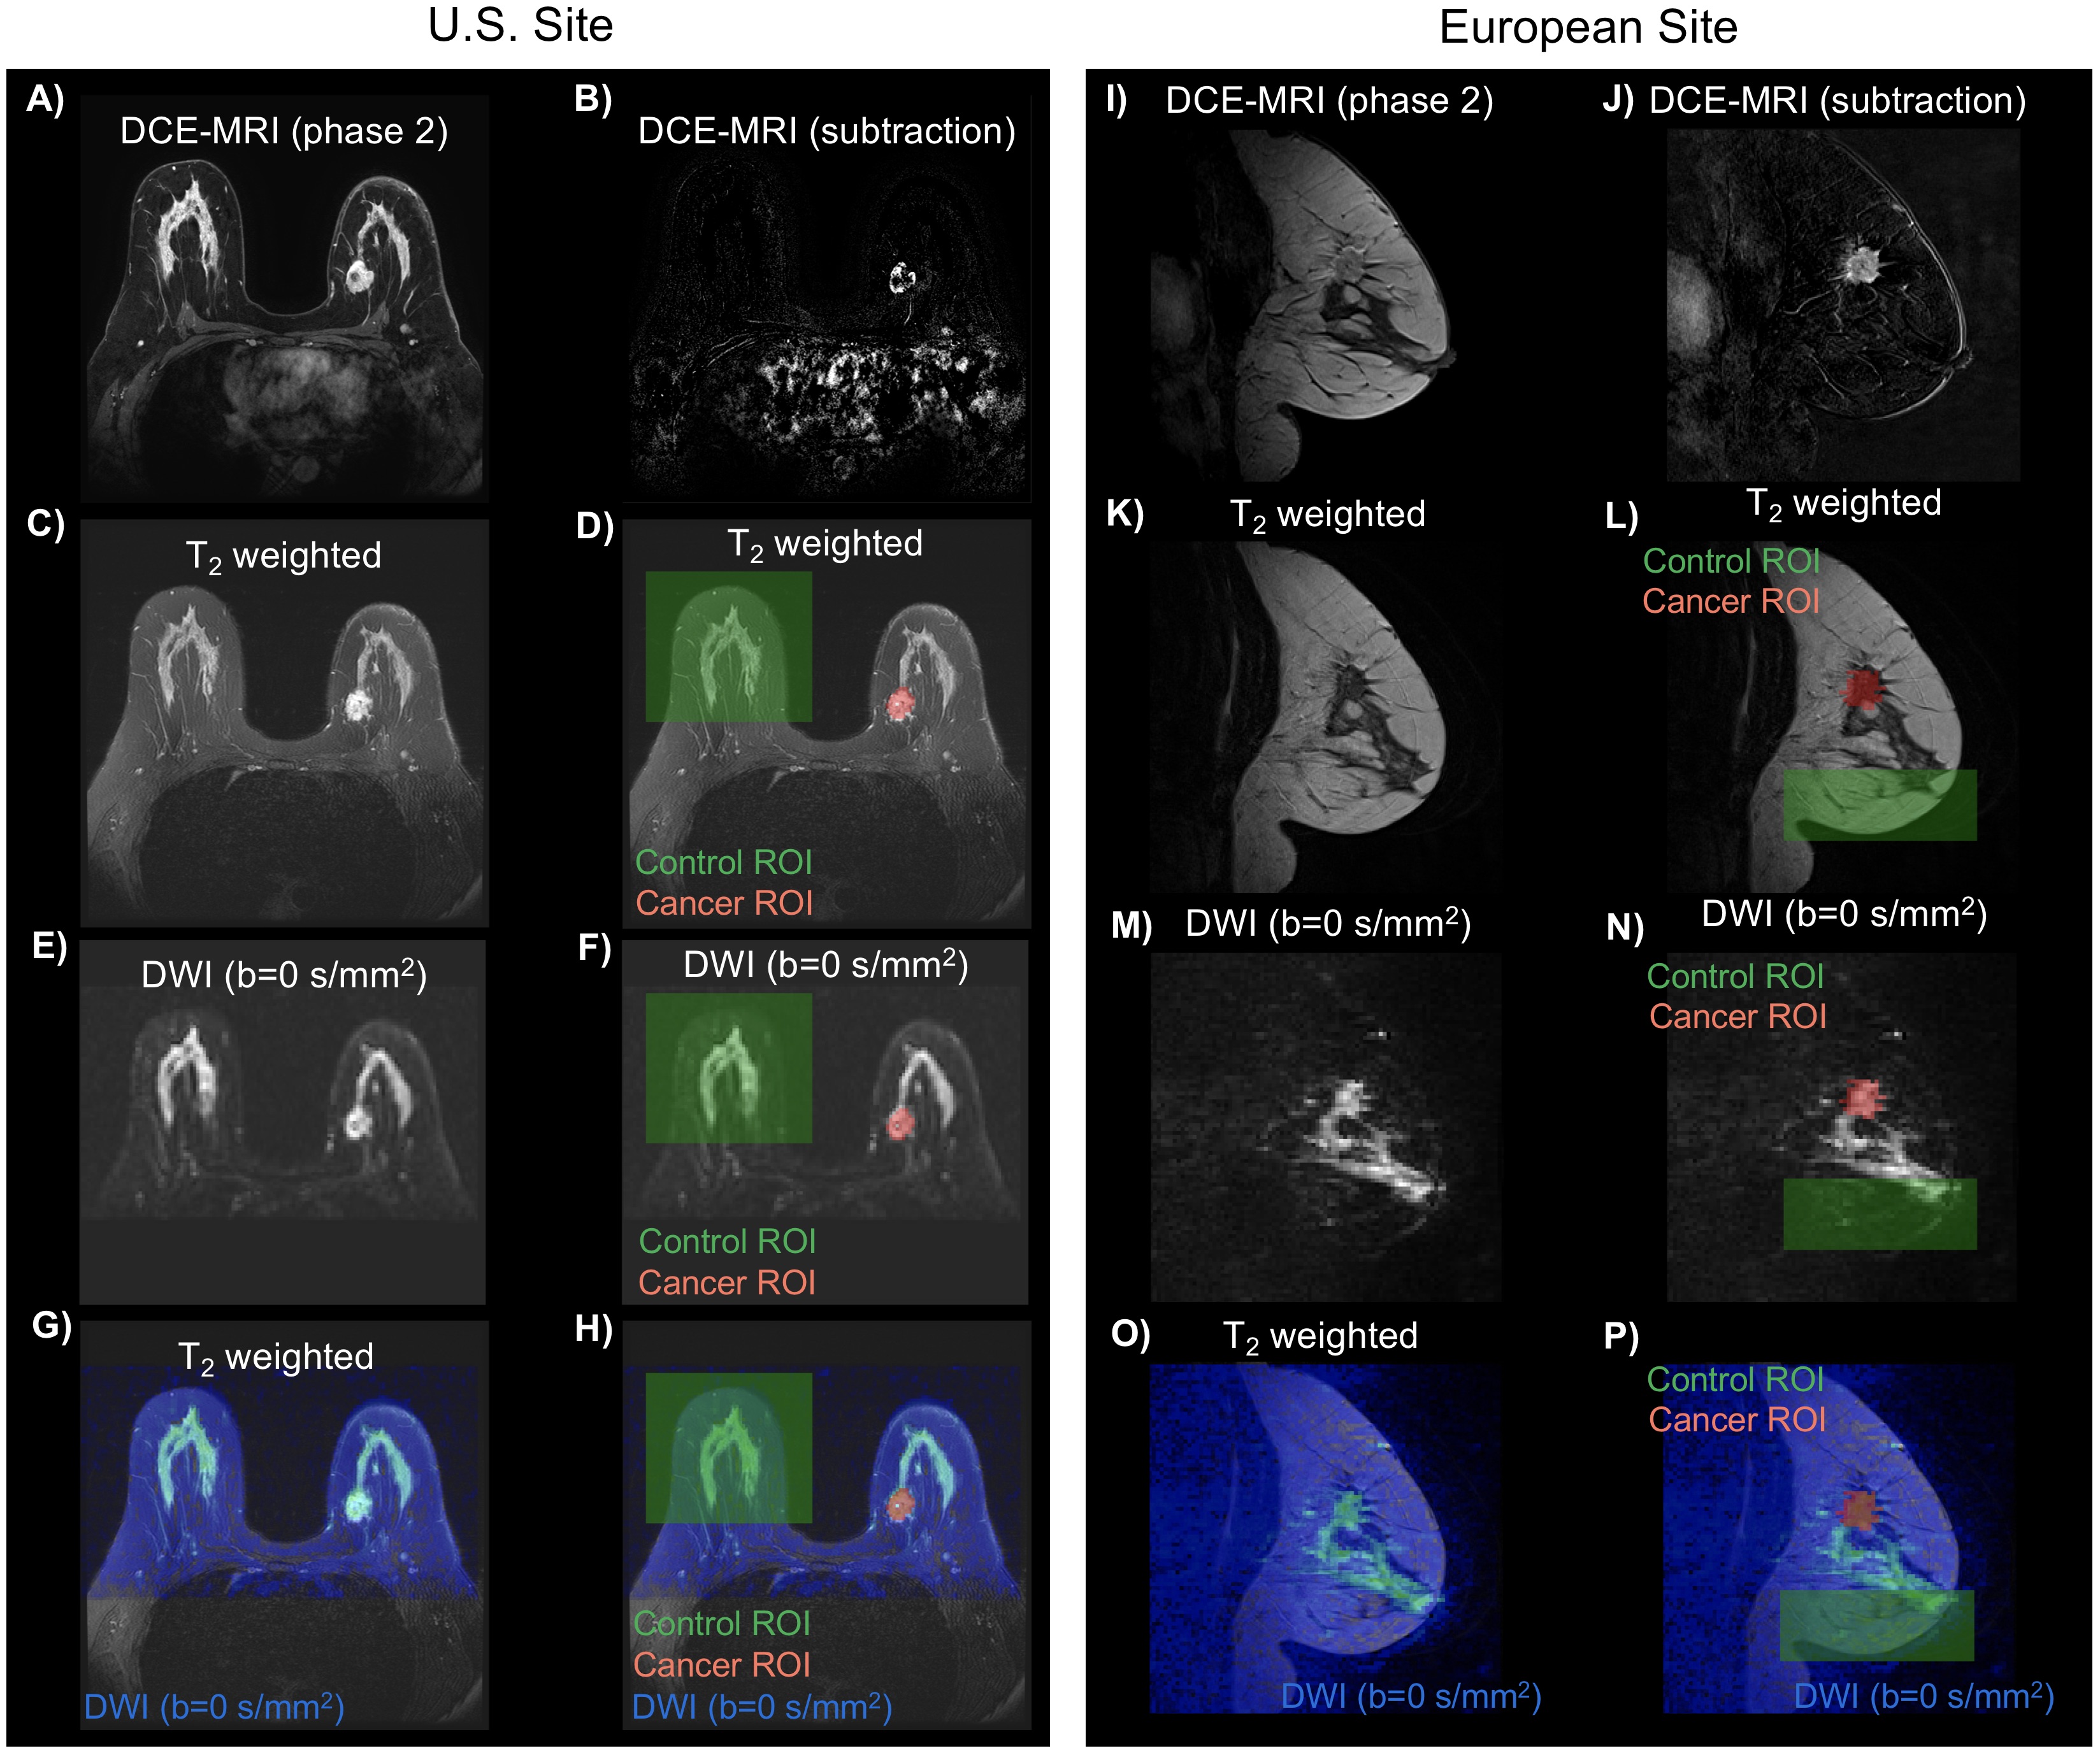
Diagnostic or surveillance MRI at 3T was performed in a group of 49 and 25 pathology proven breast cancer patients from two sites, respectively. None of the participants received treatment previous to MRI scan. The DWI and DCE-MRI pulse sequence parameters are shown in the Table. Differences in data across sites were used to determine an initial robust joint model that could be used in DWI data collected at different scanners and with pulse sequence parameters.All analyses were performed in MATLAB. Diffusion directions for a determined b-value were averaged before processing (assuming isotropic diffusion). The following ROIs were drawn on DWI images informed by DCE and anatomical images: (i) control regions including either cancer-free contralateral side or regions without cancer, (ii) cancer lesions (Figure 1), and (iii) background regions. Averaged DWI data were noise corrected [6] and normalized by the maximum signal intensity value in b=0 s/mm2 volume to preserve T2 information. The diffusion signal was modeled as the linear combination of multiple exponential decays:
$$ S_{diff}(b,N)=\sum_{i}^{N}f_{i,N} e^{-b\cdot D_{i,N}} $$
where N is the total number of exponential decays (here 1, 2, or 3), fi,N are the weights of each exponential component, b are the b-values in s/mm2, and Di,N are the ADCs of each exponential component (D1<D2<D3).
First, global ADCs were estimated across all voxels from control and cancer ROIs, patients and sites for mono-, bi- and tri-exponential models. To account for the different sites and imaging protocols, the fitting procedure minimized the global negative log likelihood of ADCs across all data. Once ADCs were determined, the fi,N for all voxels was estimated using these fixed ADC values. For comparison, conventional ADC and apparent diffusional kurtosis (Kapp) were computed [7]. Tumor conspicuity of DWI estimates (i.e. ADC, Kapp, and fi,N), DWI bmax, and DCE-MRI was measured as the contrast-to-noise ratio (CNR):
$$ CNR = \frac{\mu_{cancer} - \mu_{control}}{\sigma_{background}} $$
The CNR for all DWI estimates were compared using repeated-measures analyses of variance (RM-ANOVA) with Sidak post hoc tests.
Results
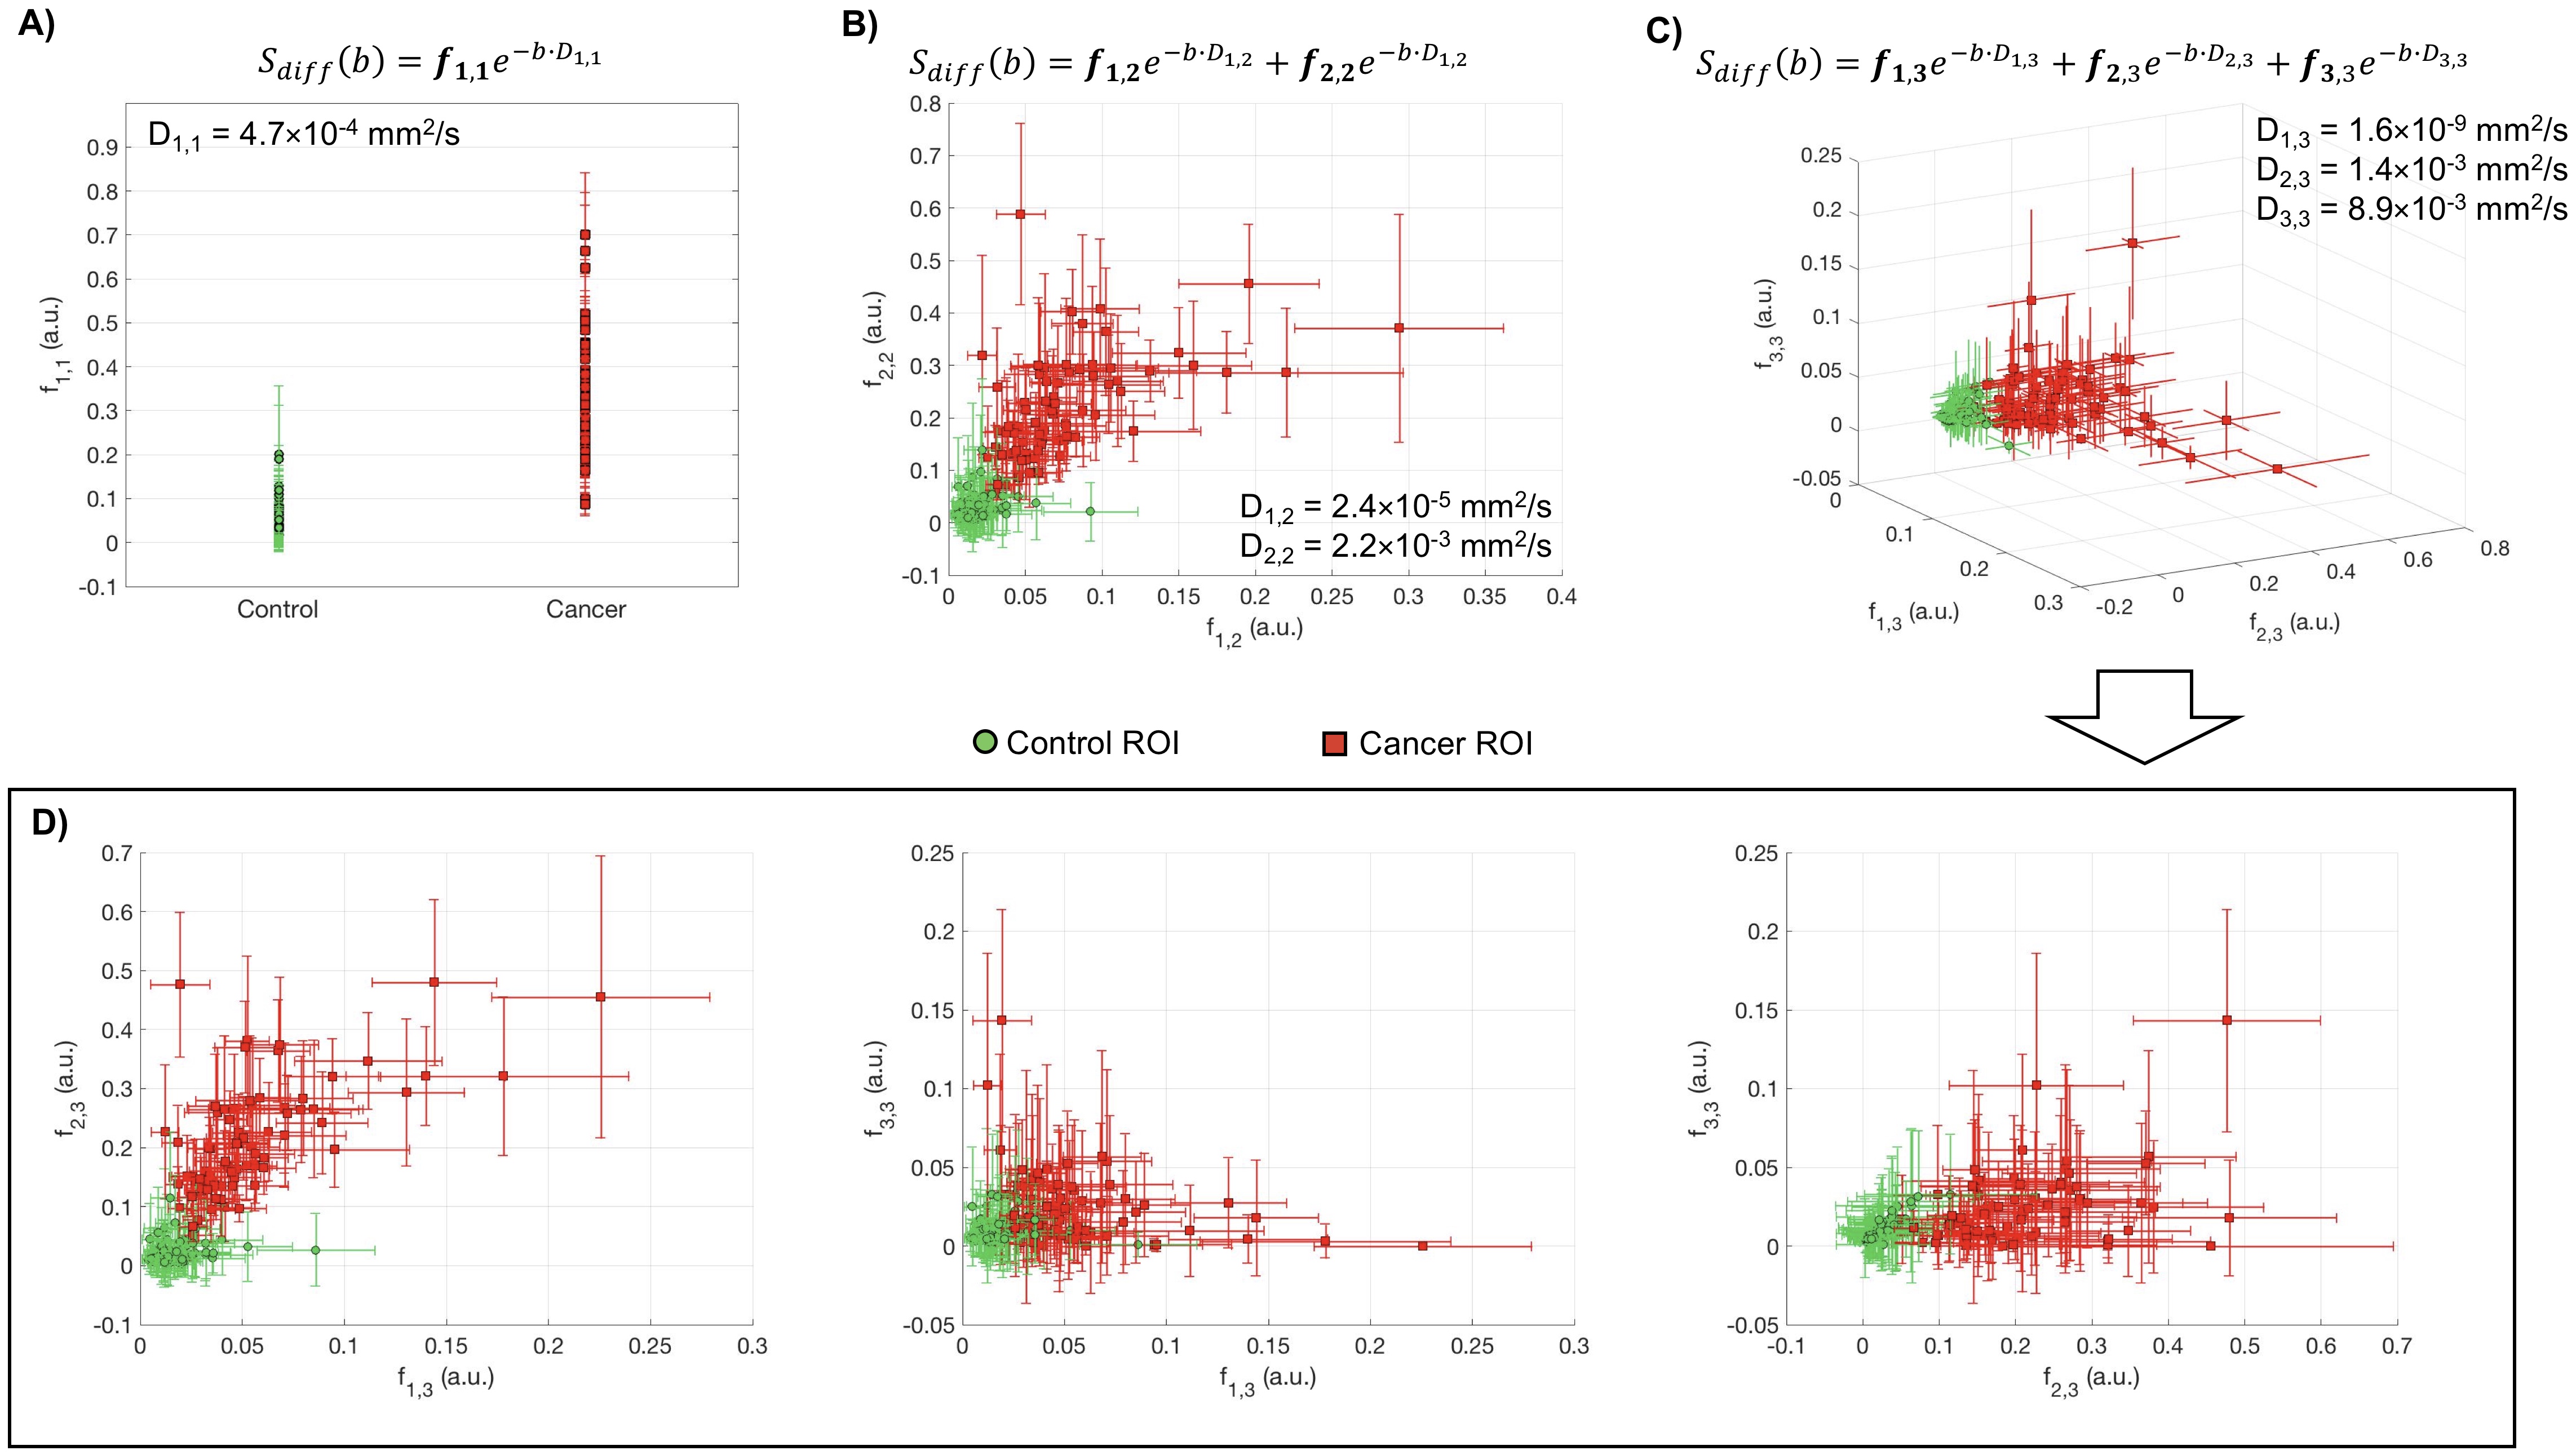
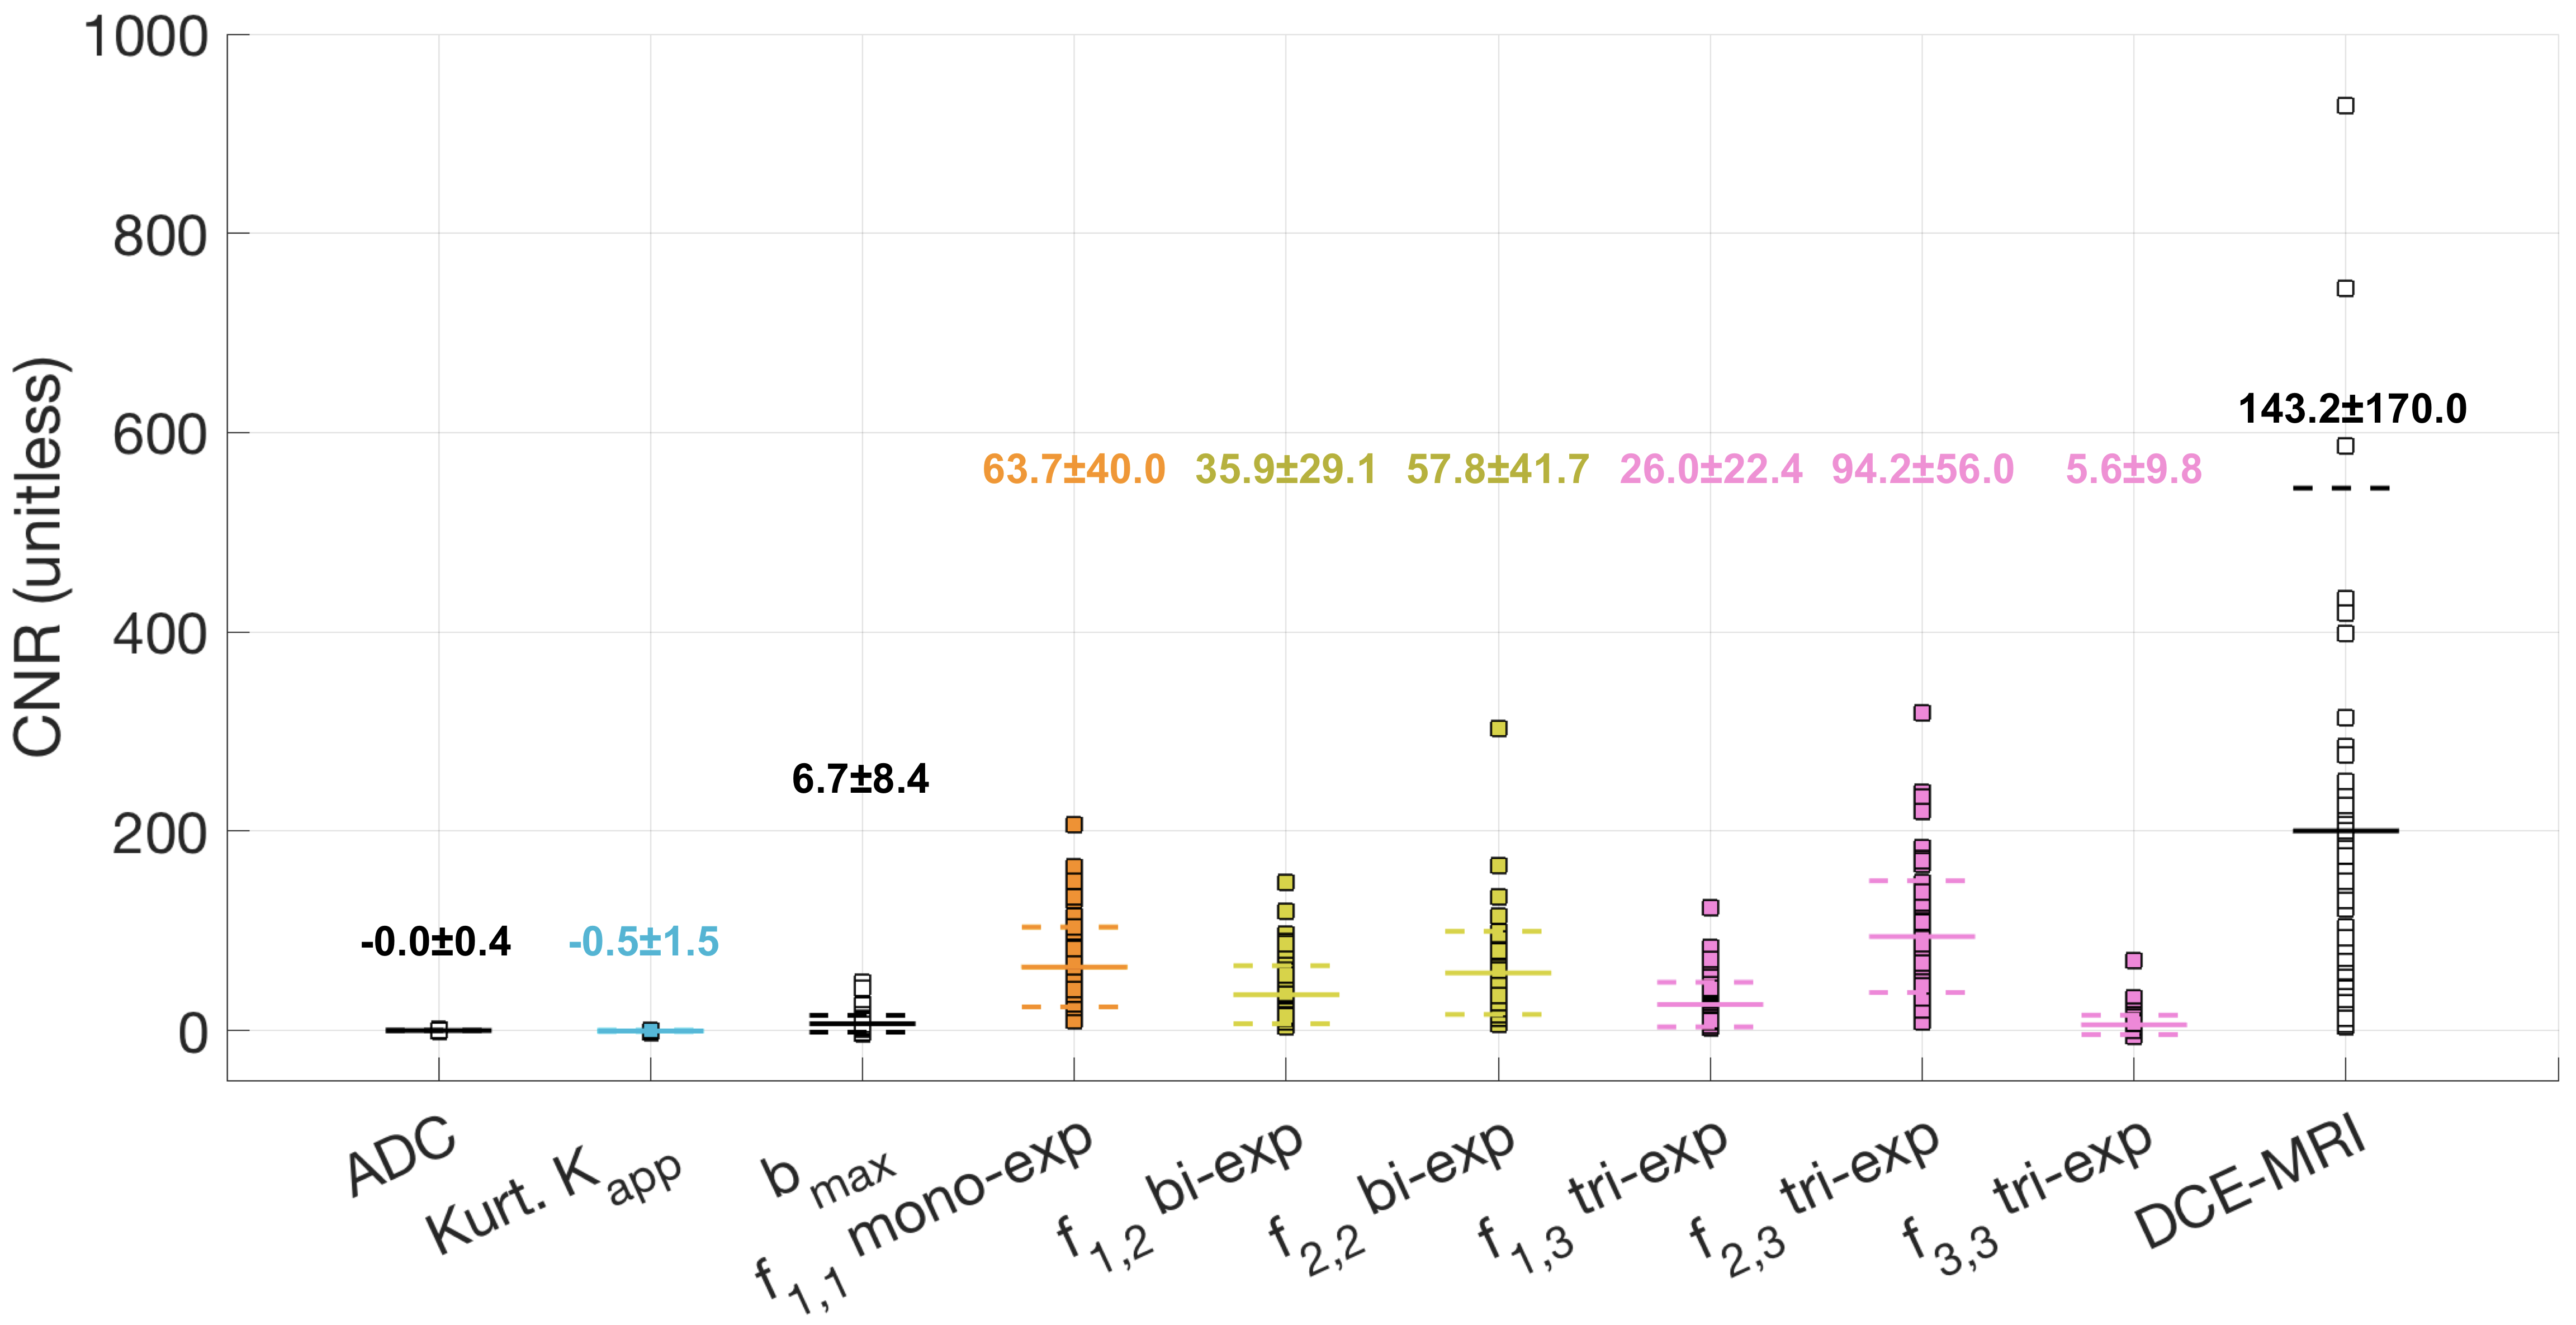
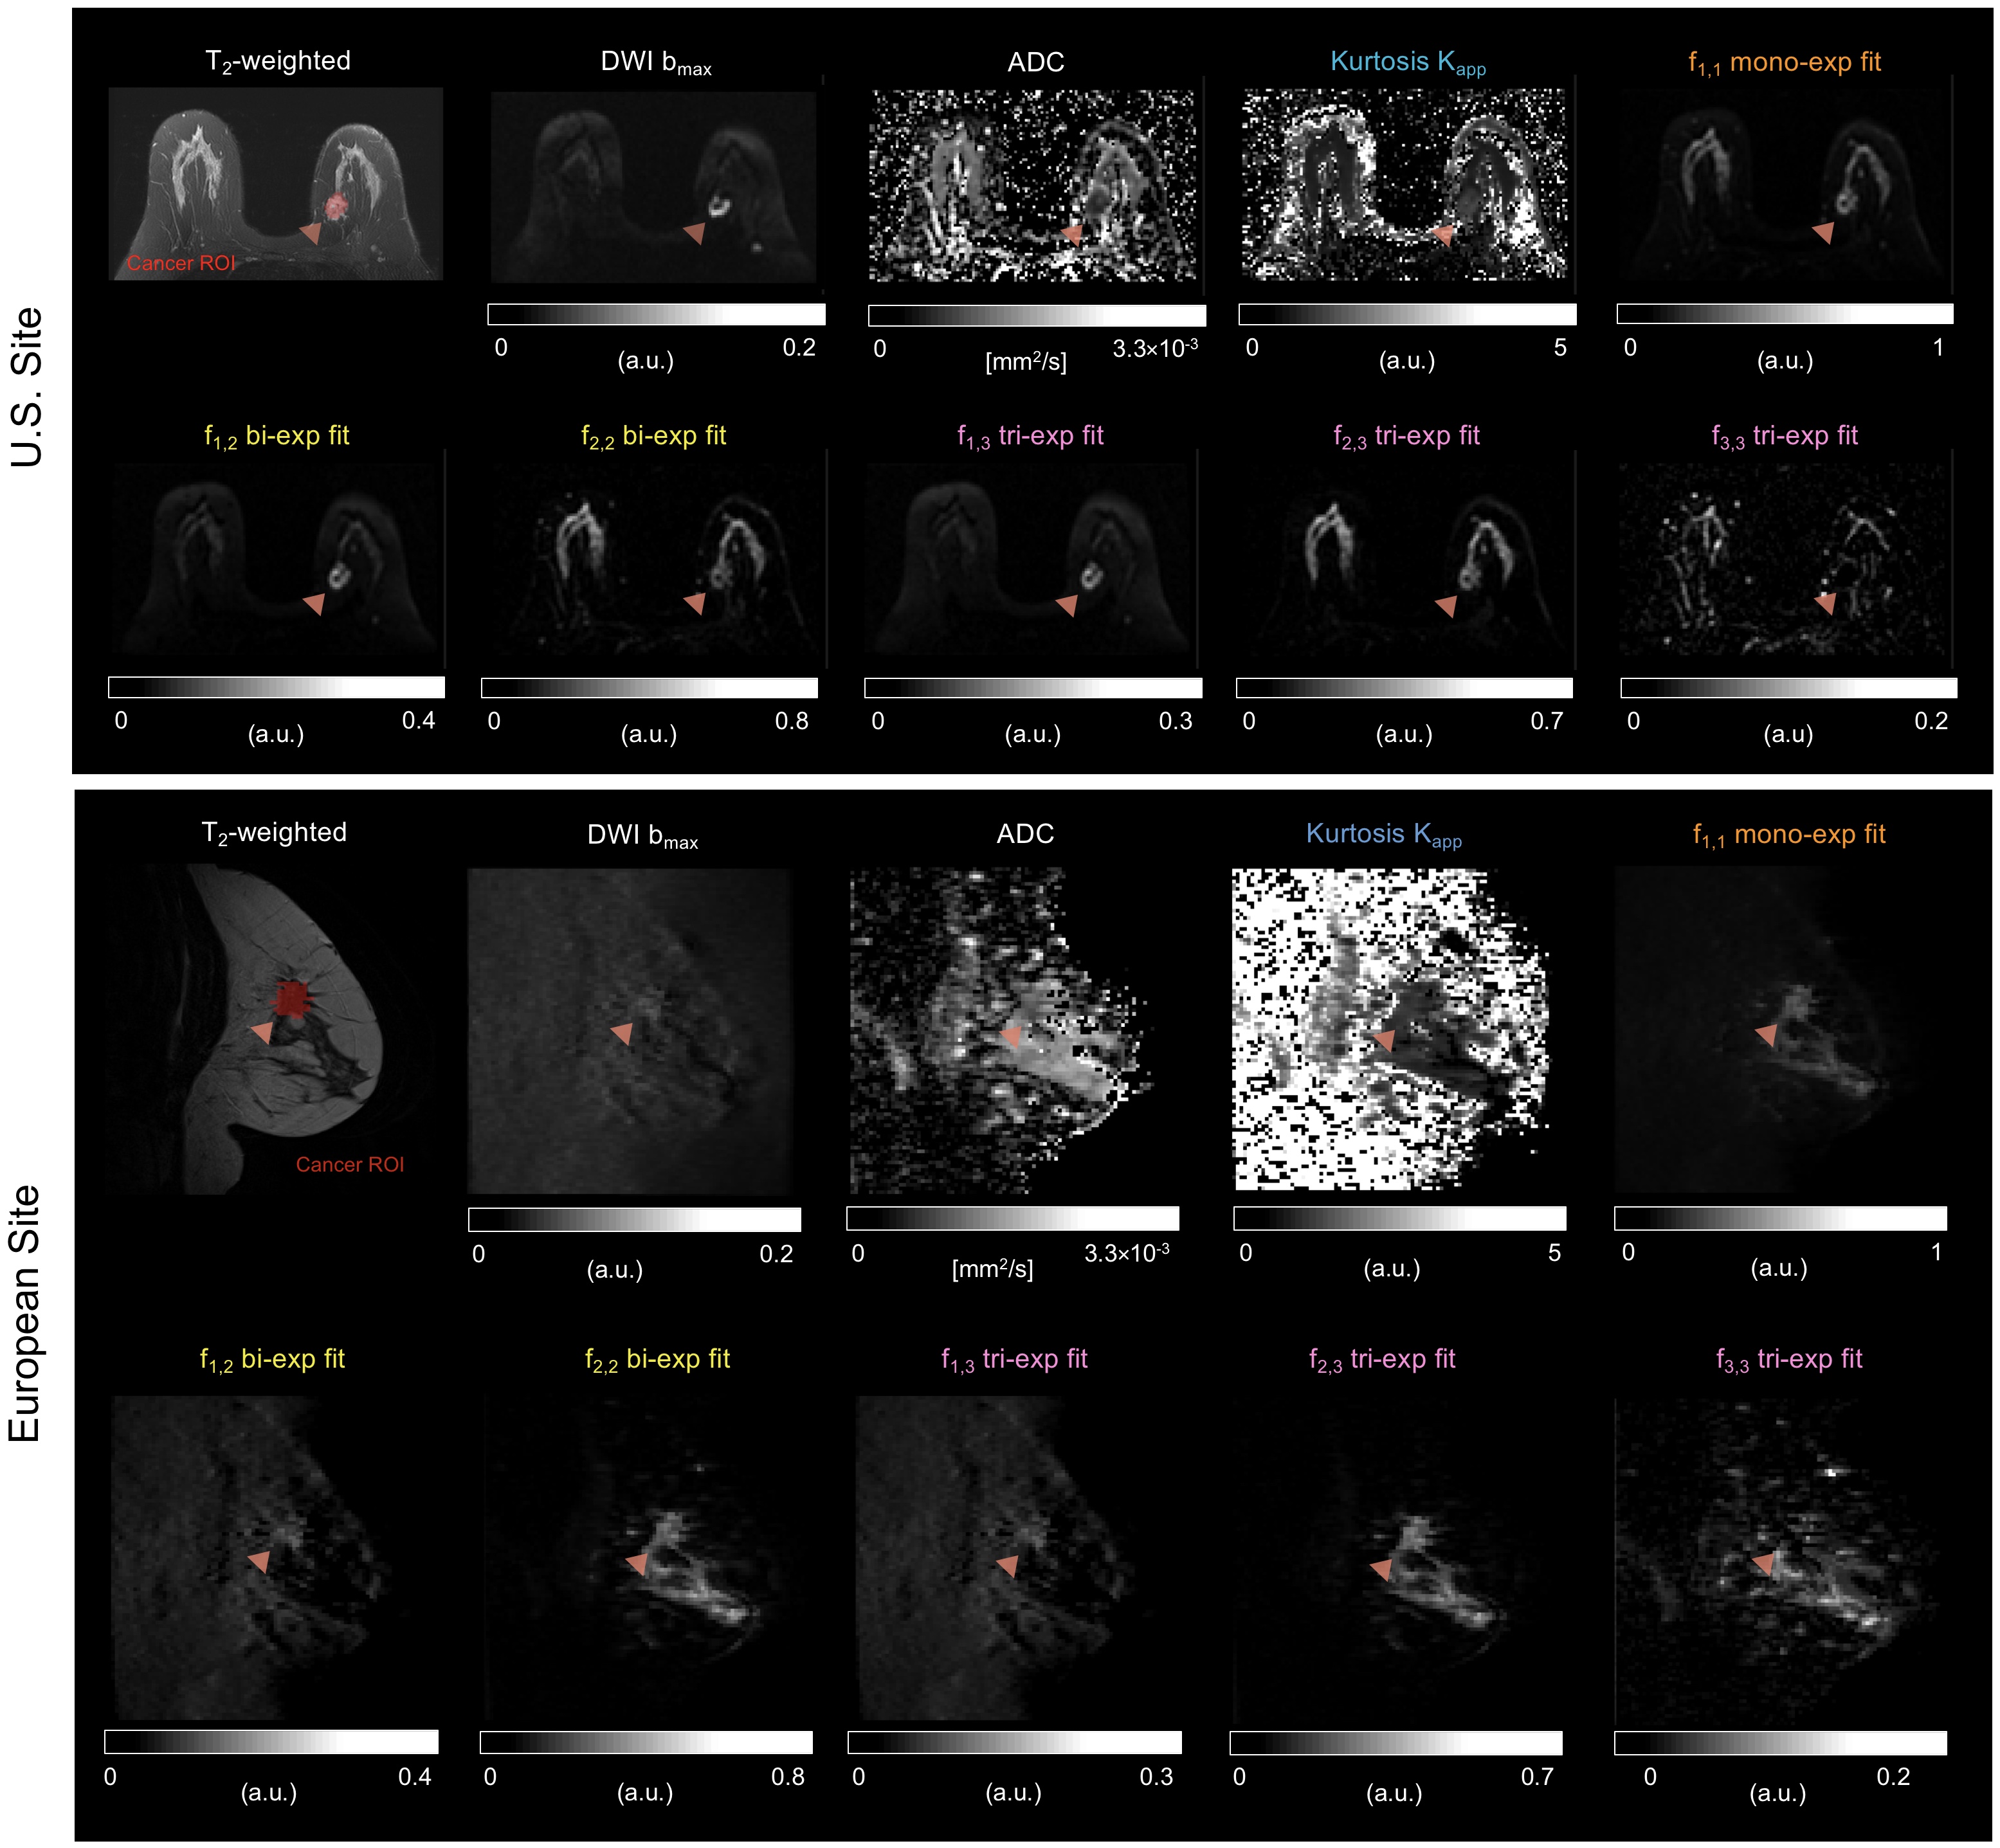
Estimated ADC for mono-exponential model was D1,1=4.7×10⁻⁴mm2/s, D1,2=2.4×10⁻⁵ and D2,2=2.2×10⁻³mm2/s for bi-exponential model, and D1,3=1.6×10⁻⁹, D2,3=1.4×10⁻³ and D3,3=8.9×10⁻³mm2/s for tri-exponential model; with normalized mean squared errors (MSE) of 12.5%, 1.3%, and 0.8%, respectively. The average decay weights (fi,N) for the three models are shown in Figure 2. As expected, tumor conspicuity was highest (p<0.01) in DCE-MRI compared to the weights of the components of multi-exponential models (fi,N), DWI bmax, Kapp and ADC, in descending order (Figure 3). The CNR of weights fi,N was on average 3 times lower (p<0.01) than that of DCE-MRI, and one and two orders of magnitude higher (p<0.01) than that of DWI bmax, and ADC and Kapp. Resulting maps for all estimates are shown in Figure 4 for both sites. Compared to DCE-MRI and weight maps, tumors were difficult to discern from surrounding tissues in conventional ADC or Kapp.Tumors were visible in the f1,1 map of the mono-exponential decay, but indiscernible from healthy fibroglandular tissue. When bi- or tri-exponential models were used, the magnitude of the slower component (f1,N) was larger in tumor lesions and to some extent in suppressed fat tissues. The magnitude of faster components (f2,N and f3,3) enhanced tumors, cysts, fibroglandular tissue and vessels. Altogether, these data may be used as differential features between healthy, benign, and malignant breast tissues. Although the use of a tri-exponential model may suggest data overfitting, we observed that the magnitude of fi,N of all tissues were dominated by two components perhaps due to the difference in orders of magnitude of the estimated ADCs. In other words, no tissue was bright in all three fi,3 maps of the tri-exponential model.
Discussion and Conclusions
Results suggest that DWI methods based on multi-exponential models and fixed ADCs may be useful in increasing tumor conspicuity without the use of contrast agents. We attributed this to: the use of high b-values, retainment of T2 weighting in DWI data, and isolation of slow diffusion component in tumor tissues. Future work includes combining information of the different multi-exponential components to further increase tumor conspicuity in breast DWI, and evaluating the diagnostic value of multi-exponential models in an independent cohort compared to DCE-MRI.Acknowledgements
California Breast Cancer Research Program Early Career Award and GE Healthcare.References
[1] Partridge SC, Murthy RS, Ziadloo A, White SW, Allison KH, Lehman CD. Diffusion tensor magnetic resonance imaging of the normal breast. Magn Reson Imaging 2010;28:320–8. doi:10.1016/j.mri.2009.10.003.
[2] Tamura T, Usui S, Murakami S, Arihiro K, Fujimoto T, Yamada T, et al. Comparisons of multi b-value DWI signal analysis with pathological specimen of breast cancer. Magn Reson Med 2012;68:890–7. doi:10.1002/mrm.23277.
[3] Guo Y, Cai YQ, Cai ZL, Gao YG, An NY, Ma L, et al. Differentiation of clinically benign and malignant breast lesions using diffusion-weighted imaging. J Magn Reson Imaging 2002;16:172–8. doi:10.1002/jmri.10140.
[4] Plaza MJ, Morris EA, Thakur SB. Diffusion tensor imaging in the normal breast: influences of fibroglandular tissue composition and background parenchymal enhancement. Clin Imaging 2016;40:506–11. doi:10.1016/j.clinimag.2015.12.001.
[5] Tagliafico A, Rescinito G, Monetti F, Villa A, Chiesa F, Fisci E, et al. Diffusion tensor magnetic resonance imaging of the normal breast: reproducibility of DTI-derived fractional anisotropy and apparent diffusion coefficient at 3.0 T. Radiol Med 2012;117:992–1003. doi:10.1007/s11547-012-0831-9.
[6] Gudbjartsson H, Patz S. The rician distribution of noisy MRI data. Magn Reson Med 1995;34:910–4. doi:10.1002/mrm.1910340618.
[7] Jensen JH, Helpern JA. MRI quantification of non‐Gaussian water diffusion by kurtosis analysis. NMR Biomed 2010;23:698–710. doi:10.1002/nbm.1518.
Figures