2323
Diagnosis of Non-Mass-Like Enhancement Lesions on DCE-MRI by Using Quantitative Radiomics and Radiologists’ BI-RADS Reading
Meihao Wang1, Yang Zhang2, Jiejie Zhou1, Haiwei Miu1, Nina Xu1, Xiaxia He1, Shuxin Ye1, Huiru Liu1, Ouchen Wang1, Jiance Li1, Yezhi Lin3, and Min-Ying Su2
1First Affiliate Hospital of Wenzhou Medical University, Wenzhou, China, 2University of California, Irvine, Irvine, CA, United States, 3Wenzhou Medical University, Wenzhou, China
1First Affiliate Hospital of Wenzhou Medical University, Wenzhou, China, 2University of California, Irvine, Irvine, CA, United States, 3Wenzhou Medical University, Wenzhou, China
Synopsis
A
total of 105 lesions, 70 malignant and 35 benign, presenting as non-mass-like
enhancements were analyzed. Two radiologists gave the BI-RADS reading for the
morphological distribution and the internal enhancement pattern. For each case,
the 3D tumor mask was generated using FCM clustering algorithm with connective
labeling and hole filling. Three DCE parameters maps were generated from the
images, and PyRadiomics was applied to extract a total of 321 features for each
case. The diagnostic model was built using SVM with 10-fold cross-validation.
The accuracy of the radiomics model was 82%, higher compared to 72% built with the
BI-RADS reading.
Introduction
Diagnosis of breast lesions on MRI is usually done by radiologists based on evaluation of morphological features and DCE kinetic pattern with the assistance of DCE-specific display software, which is subjective and varies with radiologists’ experience. This problem was well recognized, and many computer-aided-diagnosis (CAD) methods have been developed in the last two decades [1-5]. In addition to providing quantitative parameters related to shape, internal heterogeneity and DCE kinetics, the CAD features were further related to BI-RADS descriptors [2,3]. For mass lesions, spiculation (morphology), rim enhancement (texture) and the wash-out DCE kinetic pattern are typical features of malignancy; whereas smooth margin (morphology), low and homogeneous enhancement (texture) and a persistent DCE kinetic pattern suggest benign. The diagnosis of non-mass lesions is much more challenging. Ductal carcinoma in situ (DCIS), invasive lobular cancer (ILC) and benign fibrocystic changes are more likely to present as non-mass-like enhancements and show the plateau DCE kinetic pattern, thus difficult for differentiation. Furthermore, the information that can be provided for non-mass lesions by other imaging modalities, such as mammography and ultrasound, is limited. Due to distinctively different features, it is known that the diagnosis for mass and no-mass lesions has to be done with separate computer-aided models [4,5]. With the advances in computer technology, extracting large data using “radiomics” becomes feasible. The goal of this study is to develop radiomics diagnostic models to distinguish malignant from benign non-mass lesions on MRI, and the results are compared to the model built based on radiologists’ reading of morphological distribution and internal enhancement pattern.Methods
A total of 105 patients showing non-mass lesions without clear boundary on MRI were analyzed, including 70 malignant and 35 benign tumors, all confirmed by histopathology. The MRI was performed using a GE 3.0T system. The dynamic-contrast-enhanced (DCE) scan was acquired using the volume imaging for breast assessment (VIBRANT) sequence in the axial view to cover both breasts, with TR=5 ms; TE=2 ms; FA=10°; slice thickness=1.2 mm; FOV=34×34cm2; matrix size=416×416. The DCE series consisted of 6 frames: one pre-contrast (F1) and 5 post-contrast (F2-F6). The acquisition time for each frame was 1 min 32 s. Two radiologists gave the BI-RADS reading for the morphological distribution (Focal 1, Linear 2, Segmental 3, Regional 4, Multiple 5, Diffuse 6) and the internal enhancement pattern (Homogeneous 1, Heterogeneous 2, Clumped 3, Clustered ring 4). Tumors were segmented based on contrast-enhanced maps using fuzzy-C-means (FCM) clustering algorithm. After segmentation, the ROIs from all imaging slices containing this lesion were combined. Then 3D connected-component labeling was applied to remove scattered voxels not connecting to the main lesion, and then the hole-filling algorithm was applied to generate the final 3D ROI mask [2,4]. Three heuristic DCE parametric maps were generated according to: the early wash-in signal enhancement (SE) ratio [(F2-F1)/F1]; the maximum SE ratio = [(F3-F1)/F1]; the wash-out slope [(F6-F3)/F3] [6]. Four cases are illustrated in Figures 1 to 4. The radiomics analysis was performed using the PyRadiomics: the open-source radiomics library written in python. On each map, 32 first order features and 75 textural features were extracted, and a total of 321 descriptors were extracted from 3 maps for each case. The feature selection process was done by constructing multiple support vector machine (SVM) classifiers. The analysis flow chart is shown in Figure 5. The features with the highest importance were selected to build the final SVM classification model with Gaussian kernel. The performance was tested with 10-fold cross-validation.Results
A total of 8 radiomics features were selected in the final SVM model, including 1)GLCM autocorrelation from wash-out map, 2)GLSZM Small Area High Gray Level Emphasis from wash-in map, 3)GLCM difference entropy from wash-out map, 4)GLCM autocorrelation from maximum SE map, 5)GLRLM short run emphasis from maximum SE map, 6)GLDM high gray level emphasis from maximum SE amp, 7)GLDM dependence non-uniformity normalized from wash-in map, and 8)GLCM joint average from wash-in map. The accuracy obtained using 10-fold validation is 82%, with sensitivity=93% and specificity=66%. The Intra-class-coefficient between the reading of two radiologists is 0.83 for morphological distribution, and 0.52 for internal enhancements. The SVM diagnostic model built based on averaged BI-RADS distribution category showed accuracy=72%; sensitivity=81%; and the specificity=54%.Discussion
The diagnostic accuracy of DCE-MRI is, in general, lower for non-mass lesions compared with masses [7]. Approximately 30% of invasive lobular cancer and DCIS show low enhancements with the persistent kinetic pattern, not the typical malignant features [8]. The BI-RADS descriptors for morphological distribution and internal enhancements could be given; however, as illustrated in our case examples, it could be very subjective. Since the cancer is mixed with fibrosis, the enhancement is usually heterogeneous – some parts show high enhancement and others not; therefore, depending on the aspect considered or weighted more, the radiologist may give different categories, which is a major source of inconsistency. Our results show that radiomics could achieve a decent accuracy of 82%, better than the model built based on BI-RADS reading (72%). The 3D tumor ROI was segmented using computer algorithms, which could minimize the subjectivity, and easily implemented. Normal breast parenchymal enhancement may play a substantial role in diagnosis, and similar to the reading of mammography, if the enhancement in the contralateral breast is taken into consideration in the radiomics model, it may help to further improve the diagnostic accuracy.Acknowledgements
This work was supported in part by Foundation of Wenzhou Science & Technology Bureau (No. Y20180187 and Y20180144), Medical Health Science and Technology Project of Zhejiang Province Health Commission (No. 2019KY102), and NIH/NCI R01 CA127927 and R21 CA208938.References
[1]. Gilhuijs KG, Giger ML, Bick U. Computerized analysis of breast lesions in three dimensions using dynamic magnetic-resonance imaging. Med Phys. 1998;25(9):1647-1654. [2]. Nie K, Chen JH, Yu HJ, Chu Y, Nalcioglu O, Su MY. Quantitative Analysis of Lesion Morphology and Texture Features for Diagnostic Prediction in Breast MRI. Acad Radiol 2008;15:1513–1525. [3]. Gweon HM, Cho N, Seo M, Chu AJ, Moon WK. Computer-aided evaluation as an adjunct to revised BI-RADS Atlas: improvement in positive predictive value at screening breast MRI. Eur Radiol. 2014;24(8):1800-1807. [4]. Newell D, Nie K, Chen JH, Hsu CC, Yu HJ, Nalcioglu O, Su MY. Selection of diagnostic features on breast MRI to differentiate between malignant and benign lesions using computer-aided diagnosis: differences in lesions presenting as mass and non-mass-like enhancement. Eur Radiol. 2010;20(4):771-781. [5]. Gallego-Ortiz C, Martel AL. Improving the Accuracy of Computer-aided Diagnosis for Breast MR Imaging by Differentiating between Mass and Nonmass Lesions. Radiology 2016;278(3):679-688. [6] Zhou J, Zhang Y, Chang KT, et al. Diagnosis of Benign and Malignant Breast Lesions on DCE-MRI by Using Radiomics and Deep Learning With Consideration of Peritumor Tissue. J Magn Reson Imaging. 2019 Nov 1. doi: 10.1002/jmri.26981. [Epub ahead of print] [7]. Goto M, Ito H, Akazawa K, et al. Diagnosis of breast tumors by contrast-enhanced MR imaging: comparison between the diagnostic performance of dynamic enhancement patterns and morphologic features. J Magn Reson Imaging 2007; 25:104–112. [8] Raza S, Vallejo M, Chikarmane SA, Birdwell RL. Pure ductal carcinoma in situ: a range of MRI features. AJR Am J Roentgenol 2008; 191:689–699.Figures
Figure
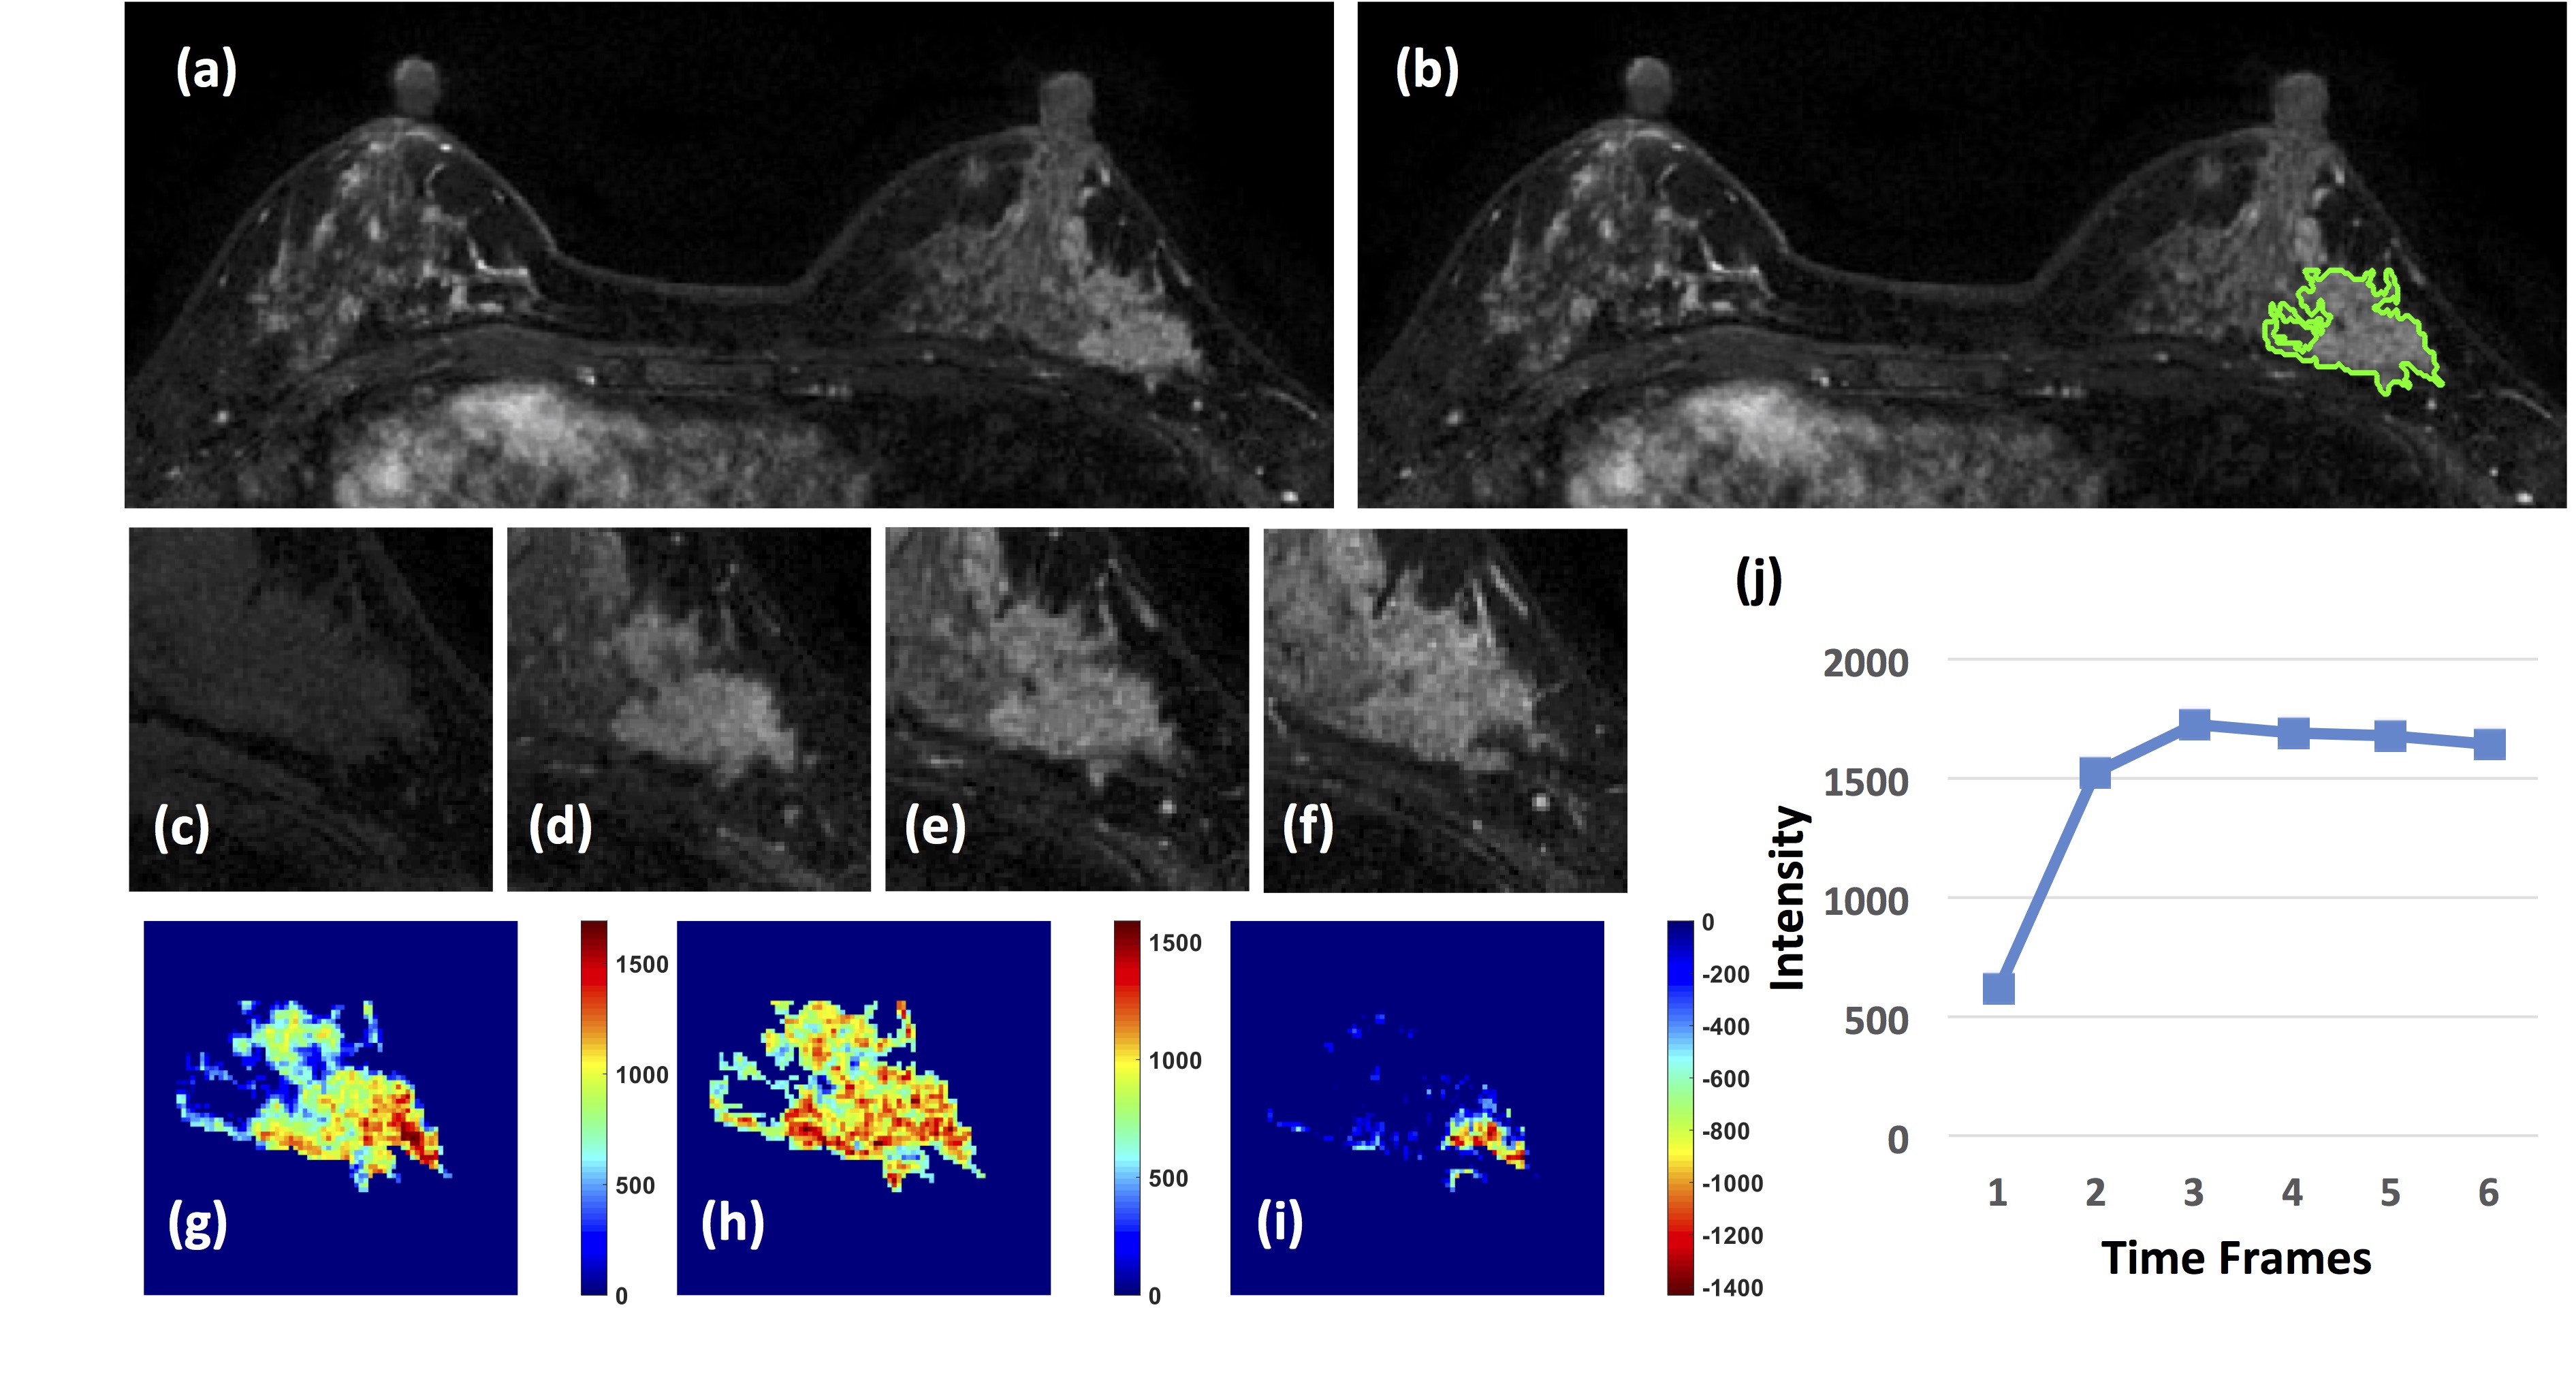
1: A 41-year-old patient with a DCIS. (a) F1 Pre-contrast
image. (b) F2 post-contrast image. (c-i): The zoom-in smallest bounding box
containing the tumor. (c) F1 pre-contrast, (d) F2 post-contrast, (e) F3
post-contrast, (f) The last F6 post-contrast image, showing a comparable
enhancement as in F3. (g) The wash-in signal enhancement map F2-F1, (h) The
maximum F3-F1 signal enhancement map, (i) The wash-out F6-F3 map. A small
portion of the tumor shows the wash-out pattern. (J) The DCE time course shows
a plateau pattern, after reaching the maximum in F3.
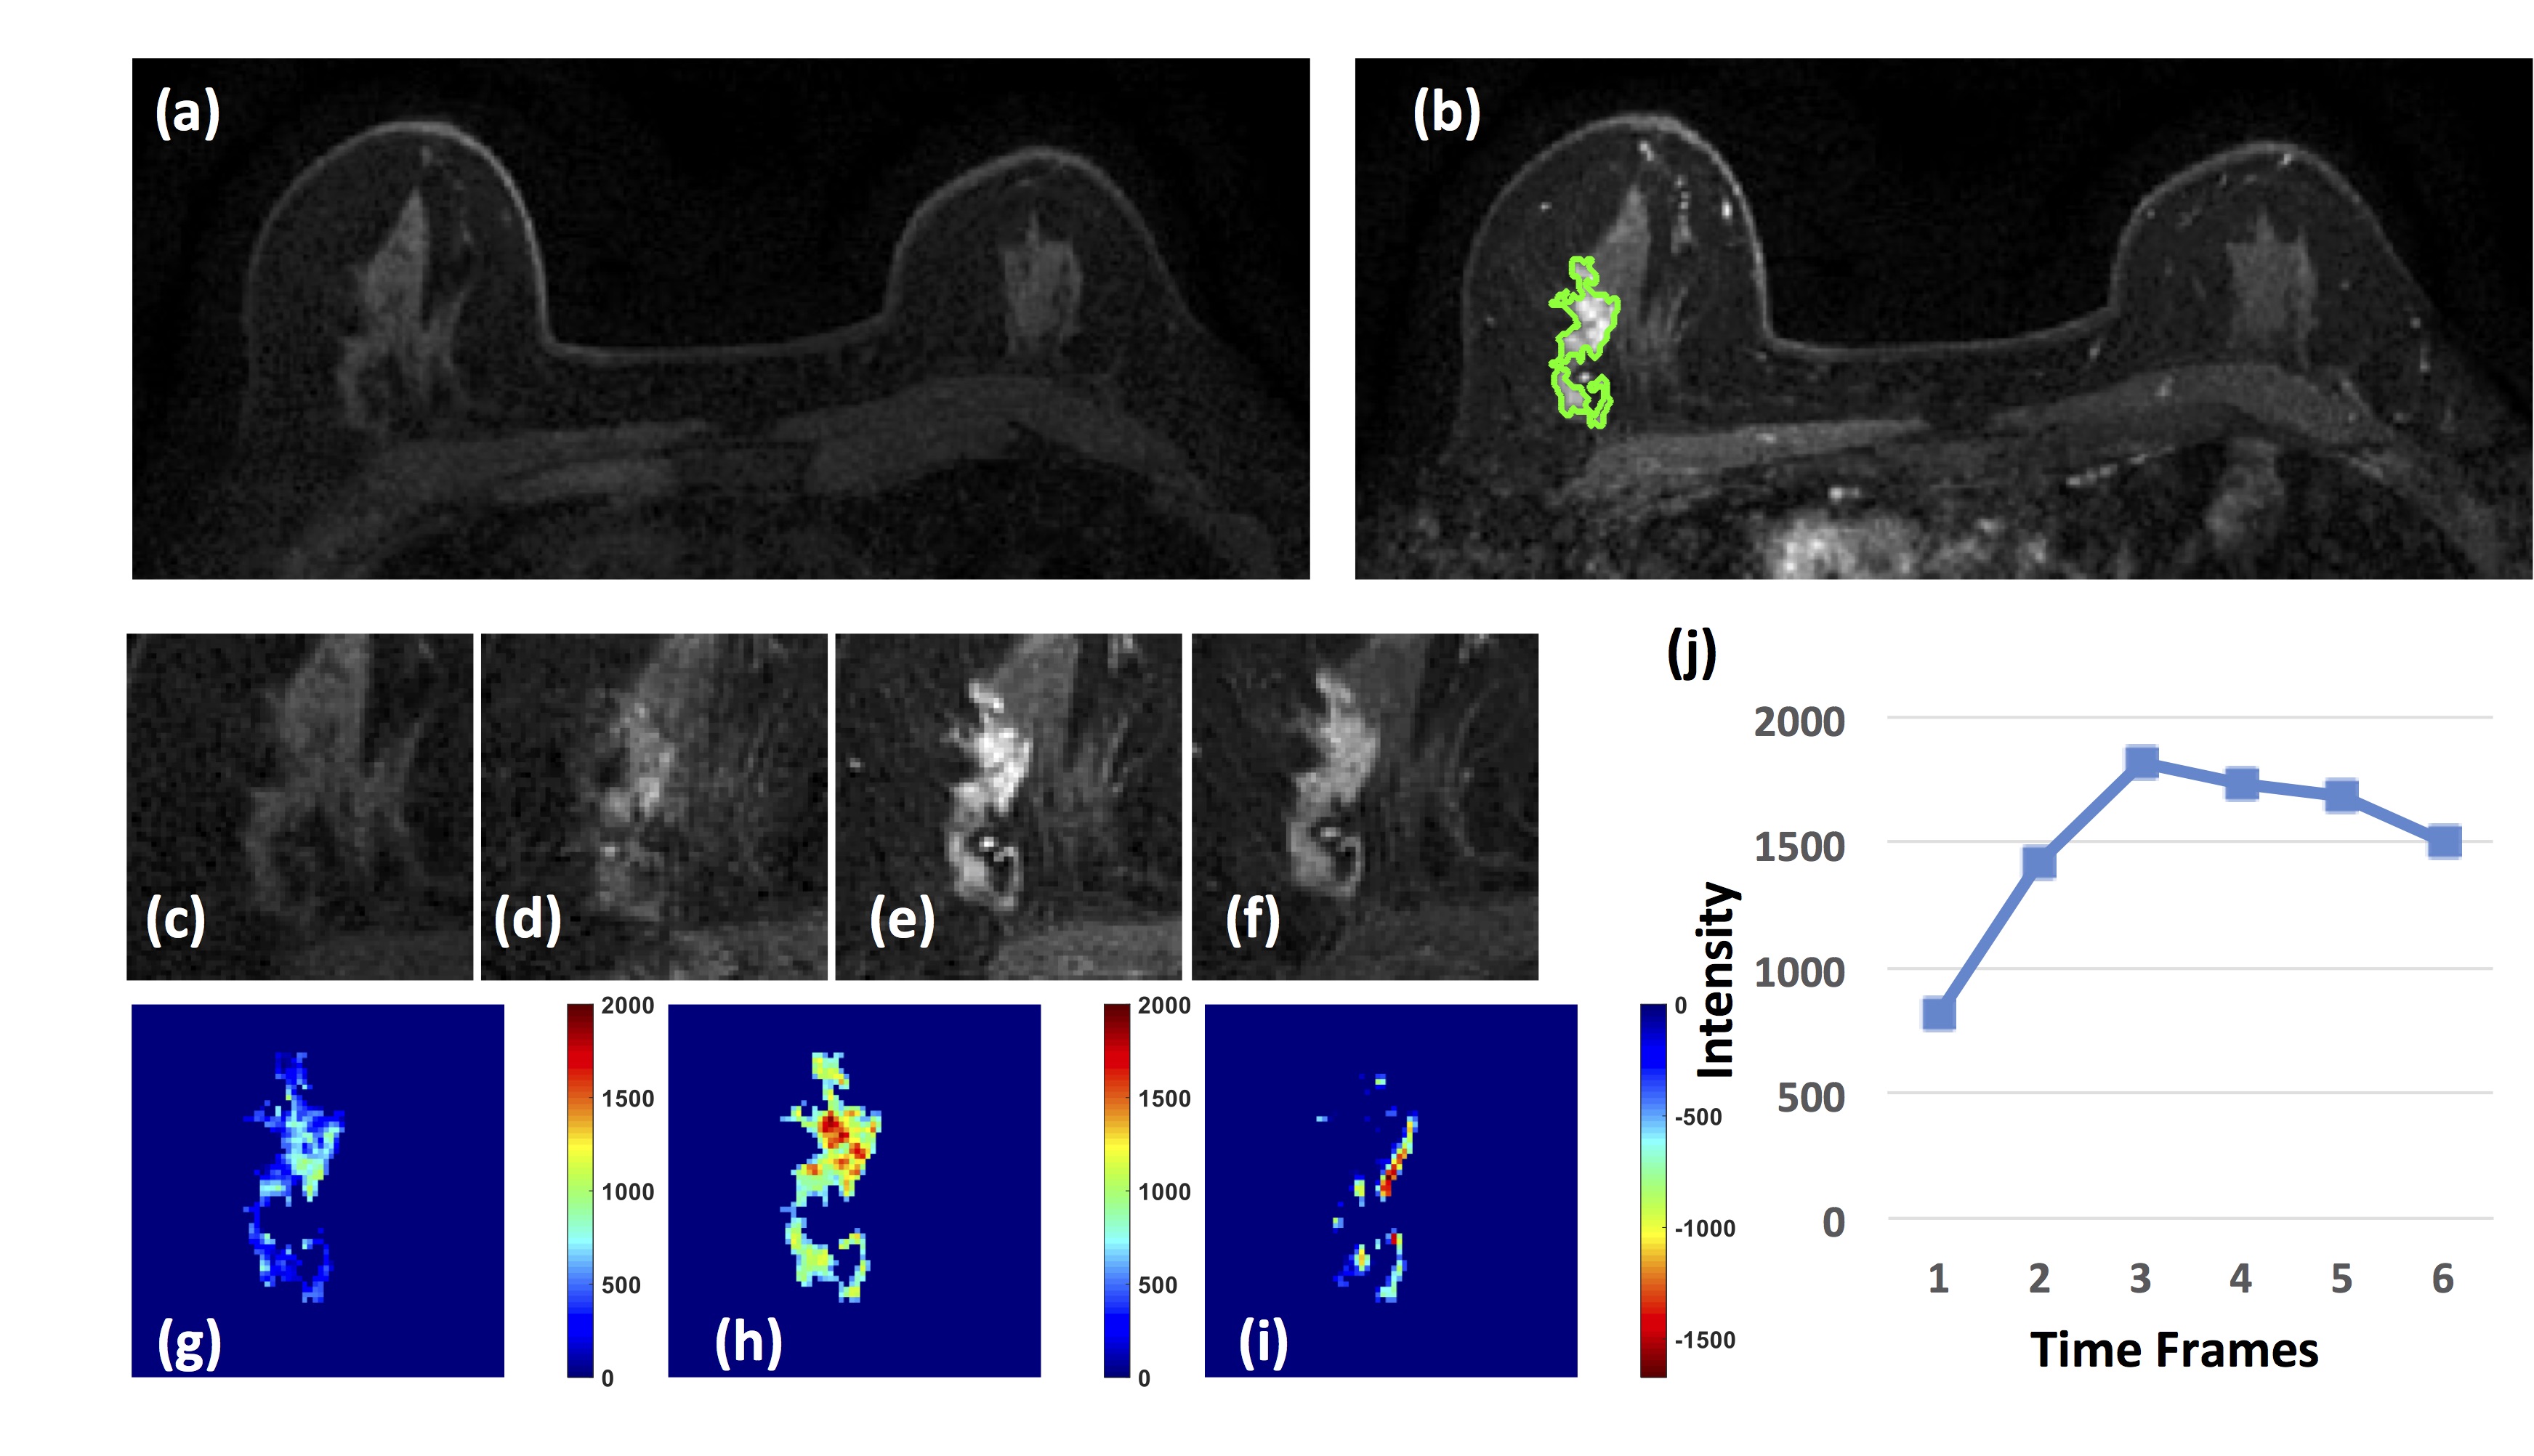
Figure
2: A 63-year-old patient with an invasive ductal
cancer. (a) F1 Pre-contrast image. (b) F2 post-contrast image. (c) F1
pre-contrast, (d) F2 post-contrast, (e) F3 post-contrast, (f) The last F6
post-contrast image, showing wash-out DCE pattern with decreased intensity after
reaching maximum in F3. (g) The wash-in signal enhancement map F2-F1, (h) The
maximum F3-F1 signal enhancement map, (i) The wash-out F6-F3 map. (j) The DCE
time course shows a typical wash-out pattern, reaching maximum in F3, followed
by decreased intensity from F4 to F6.
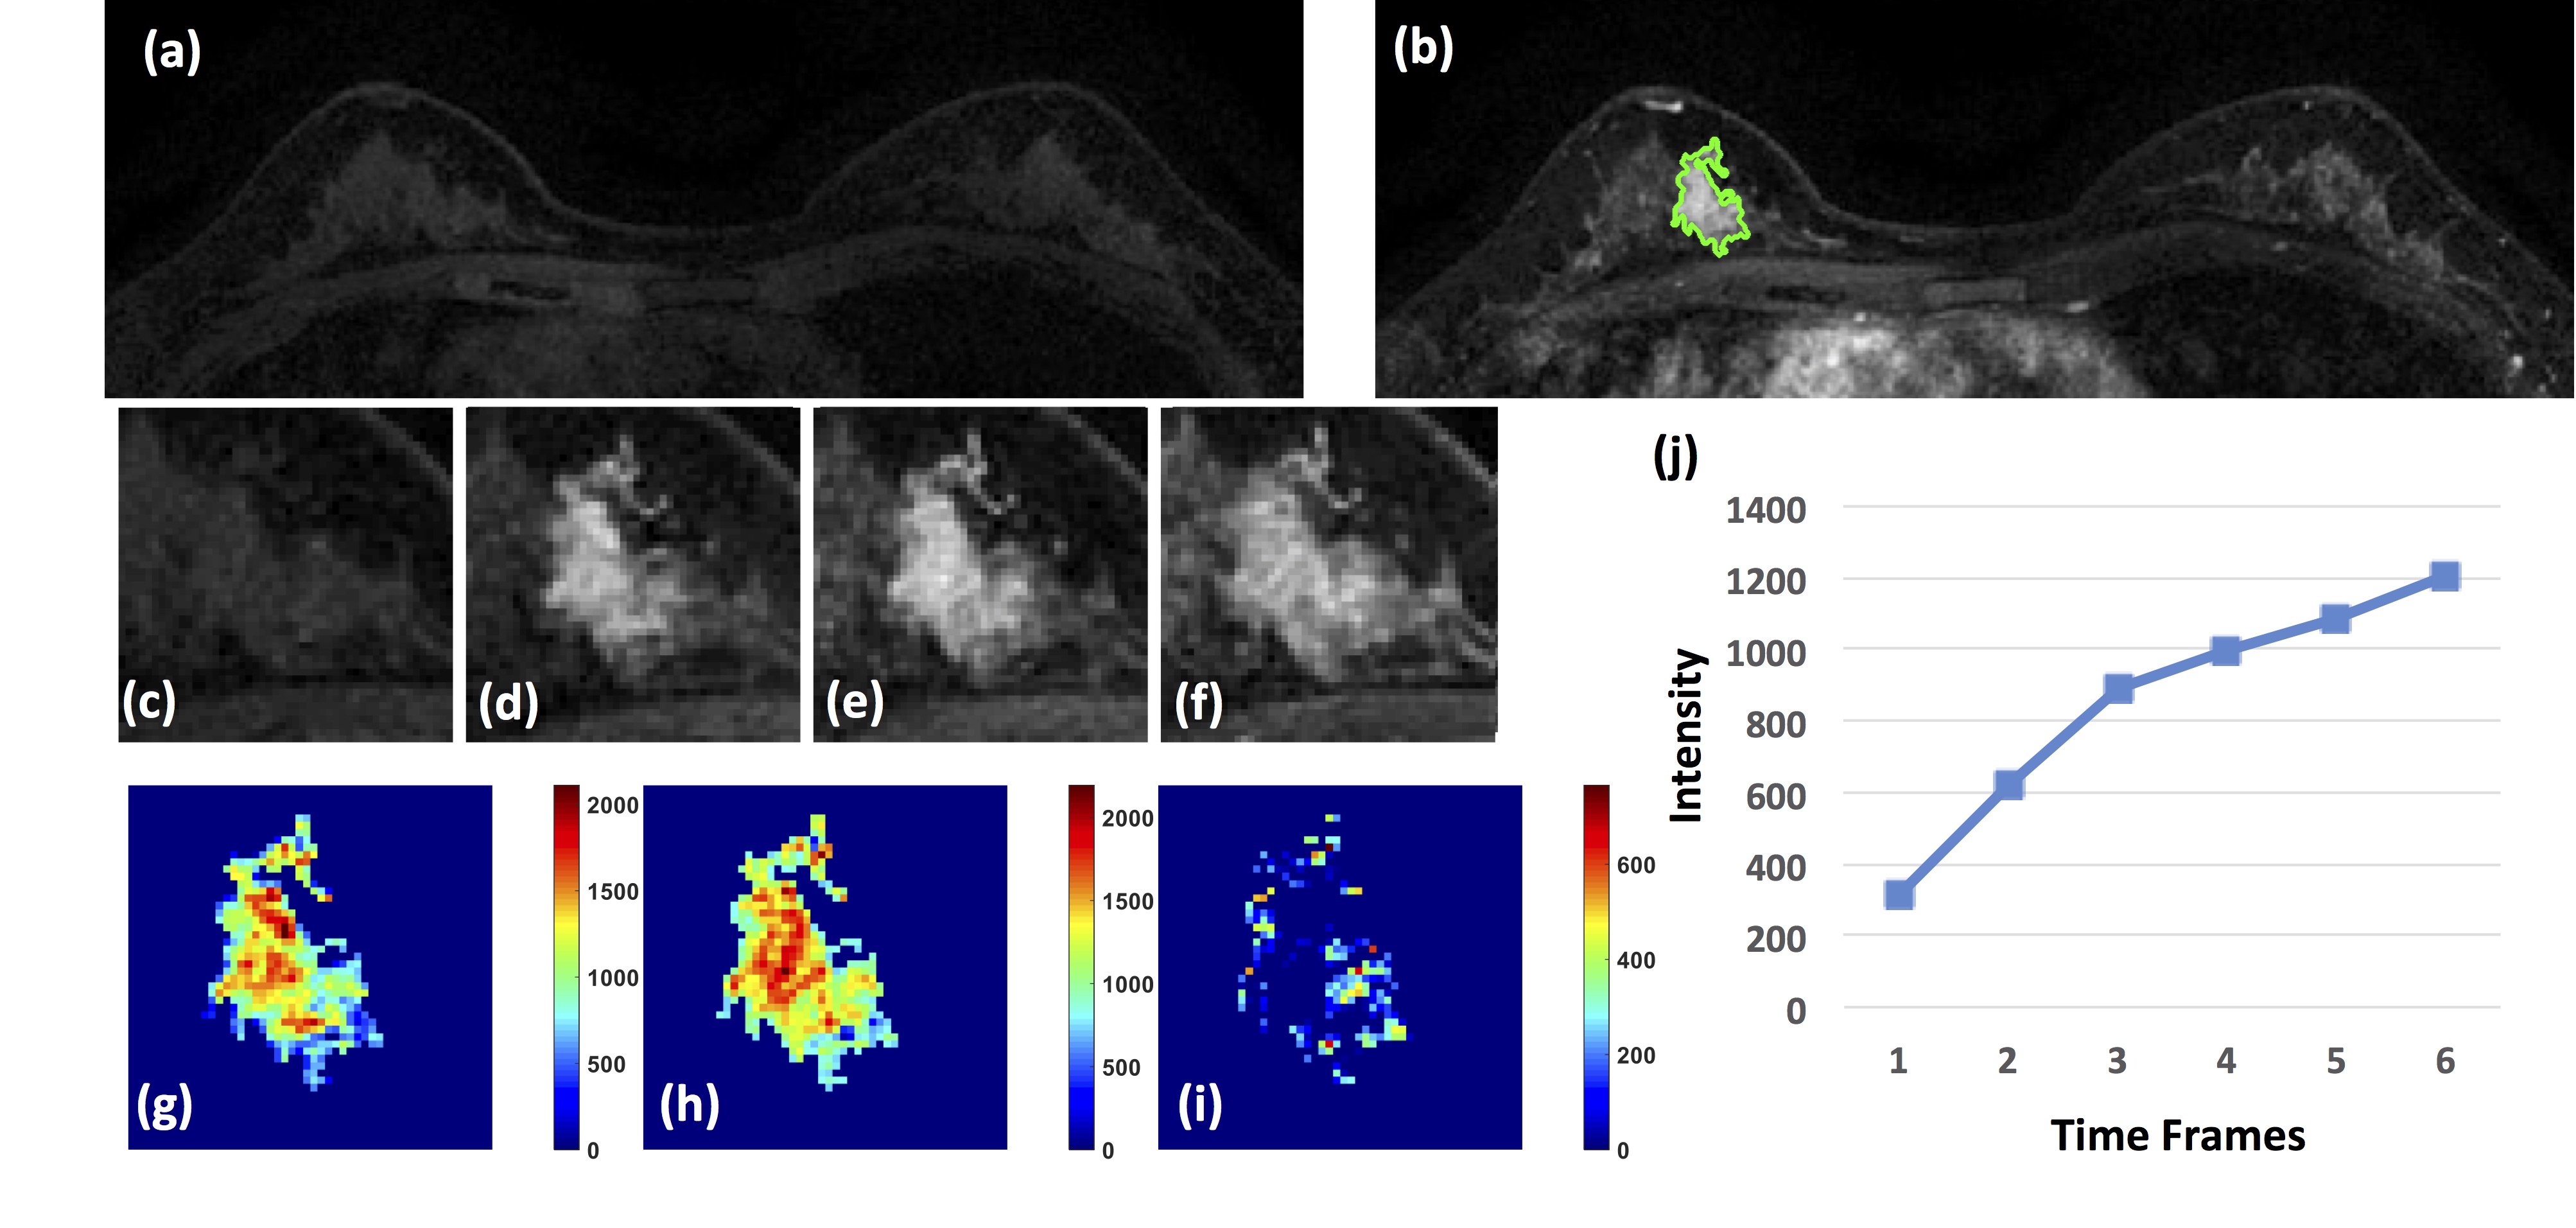
Figure 3: A 40-year-old patient with adenosis. (a) F1
Pre-contrast image. (b) The F2 post-contrast image. (c) F1 pre-contrast, (d) F2
post-contrast, (e) F3 post-contrast, (f) The last F6 post-contrast image,
showing persistent enhancement with increased intensity over time. (g) The
wash-in signal enhancement map F2-F1, (h) The F3-F1 signal enhancement map, (i)
The wash-out F6-F3 map. (J) The DCE time course shows a persistent enhancement
pattern from F1 to F6.
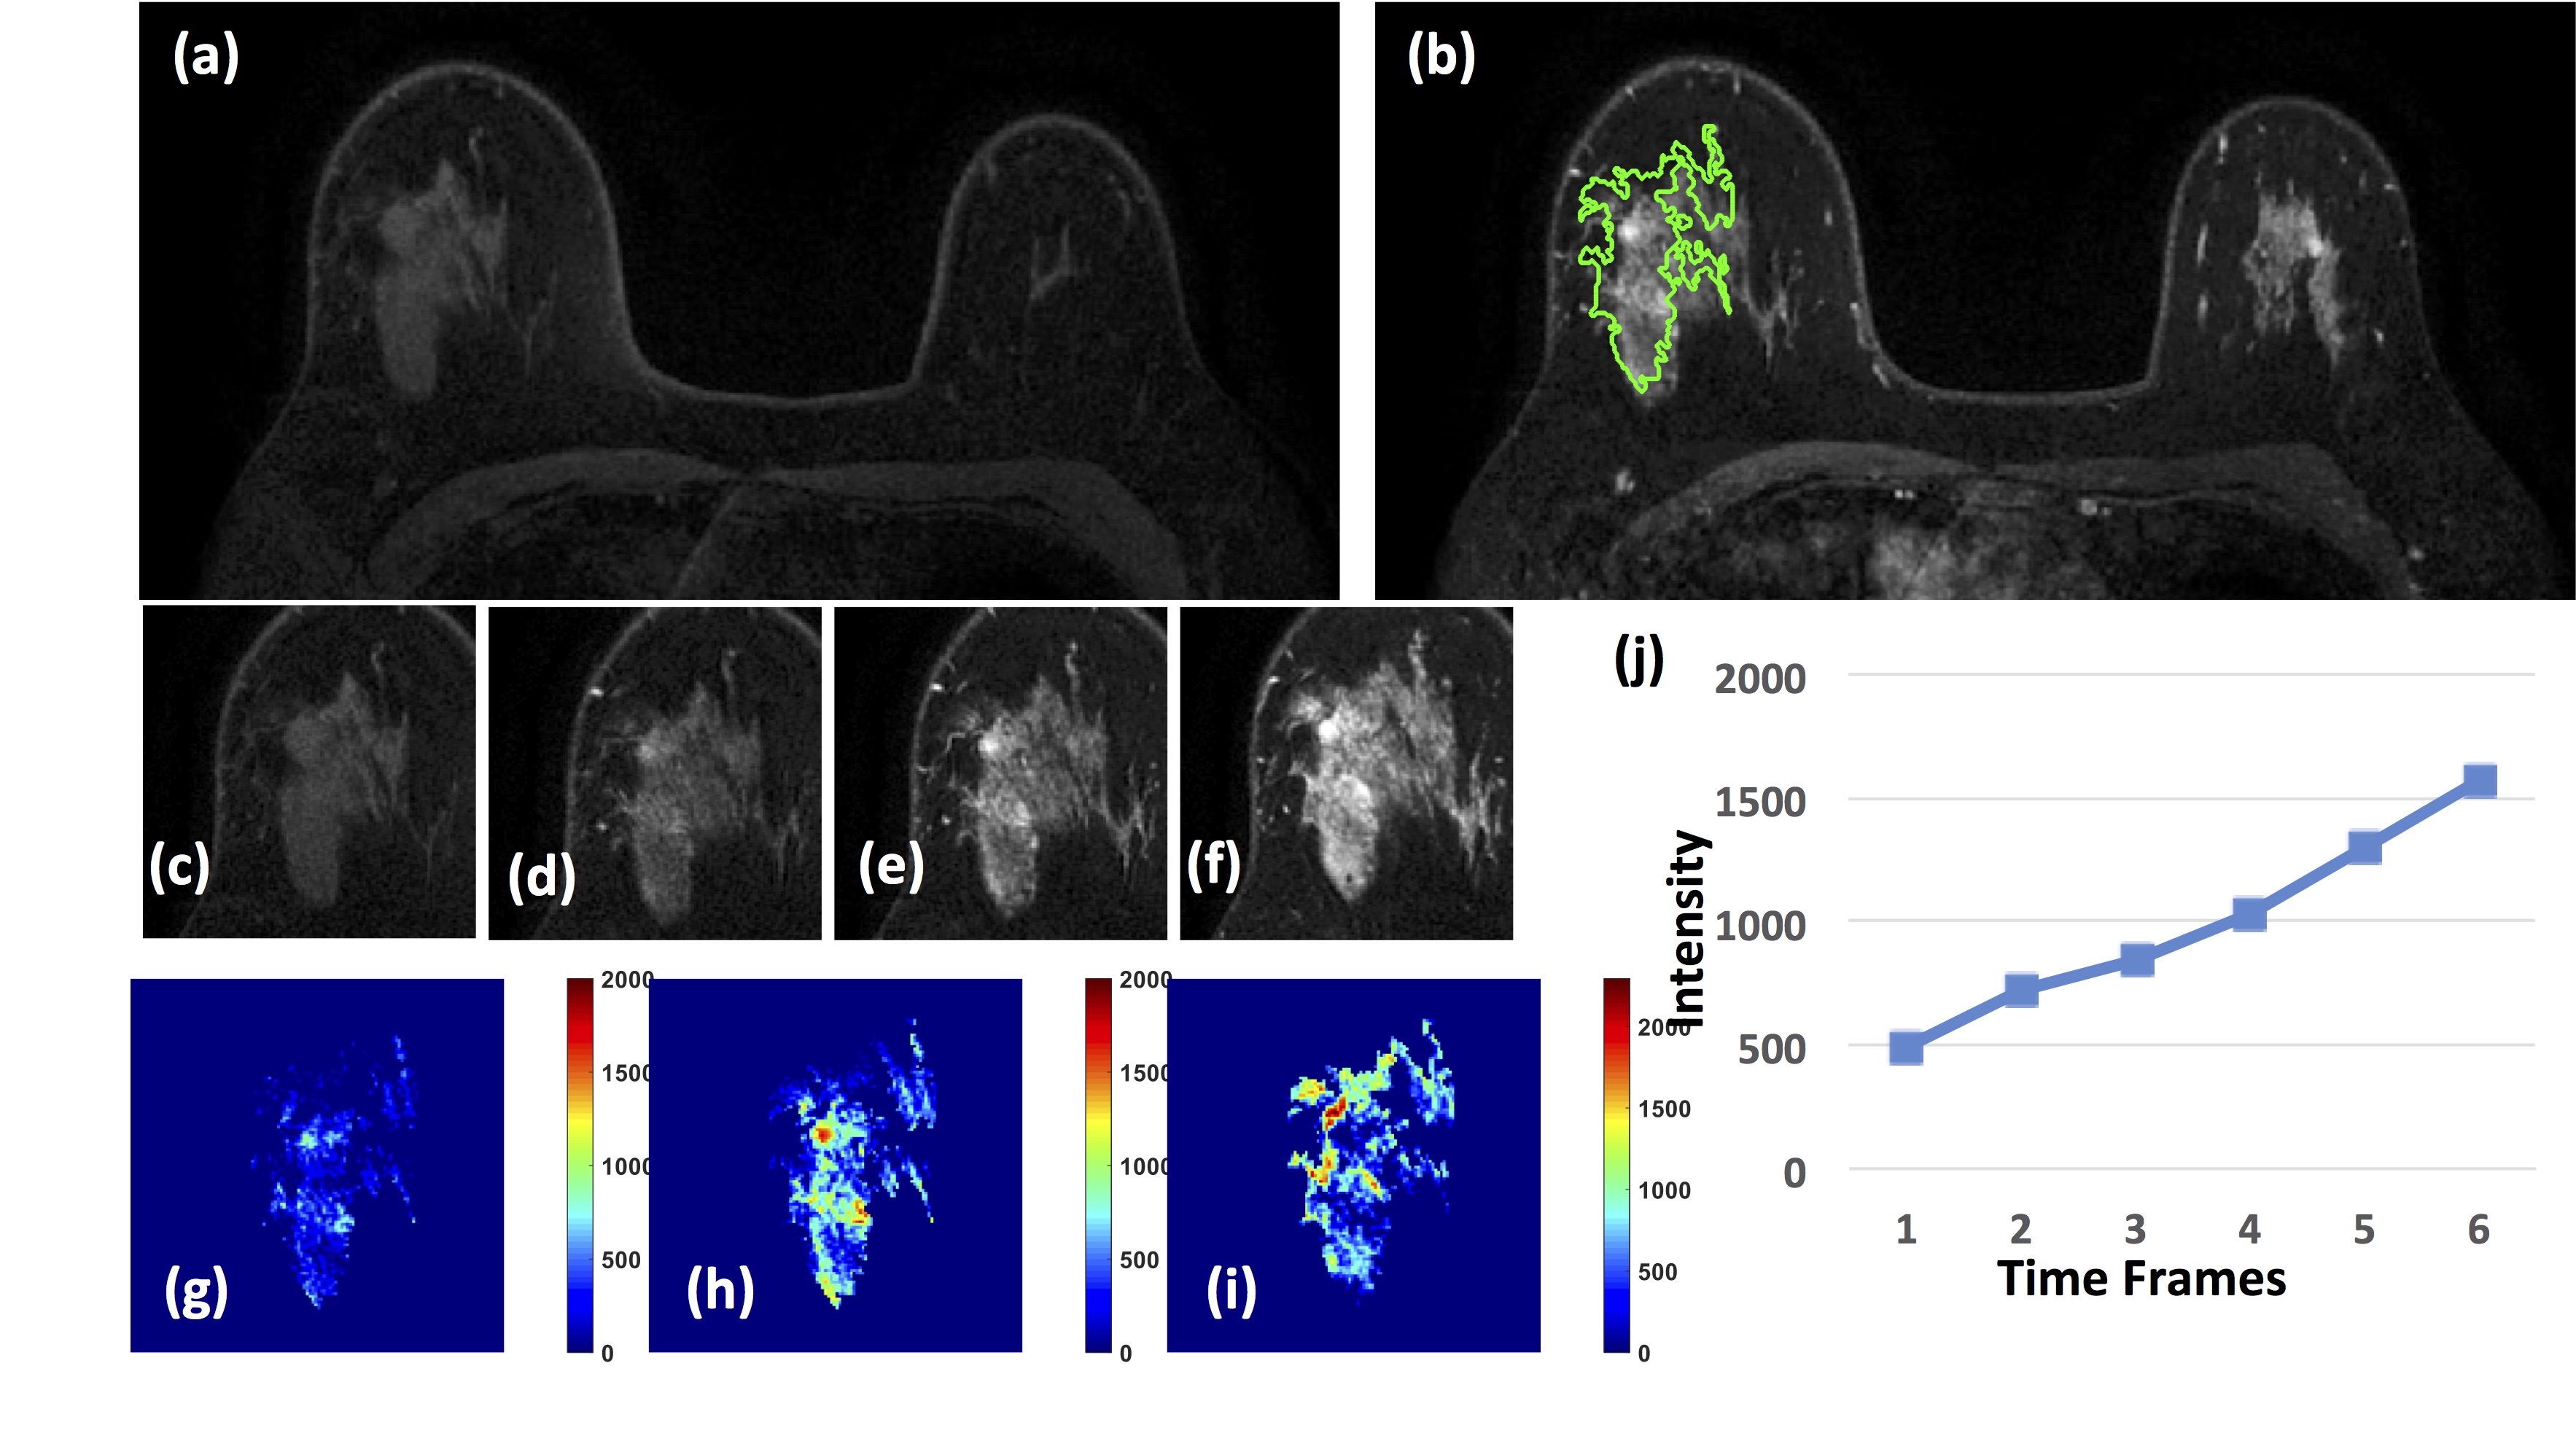
Figure
4: A 46-year-old patient with adenosis. (a) F1
Pre-contrast image. (b) F2 post-contrast image. (c) F1 pre-contrast, (d) F2
post-contrast, (e) F3 post-contrast, (f) The last F6 post-contrast image,
showing persistent enhancement with increased intensity over time. (g) The
wash-in signal enhancement map F2-F1, (h) The F3-F1 signal enhancement map, (i)
The wash-out F6-F3 map. (J) The DCE time course shows a persistent enhancement
pattern from F1 to F6.
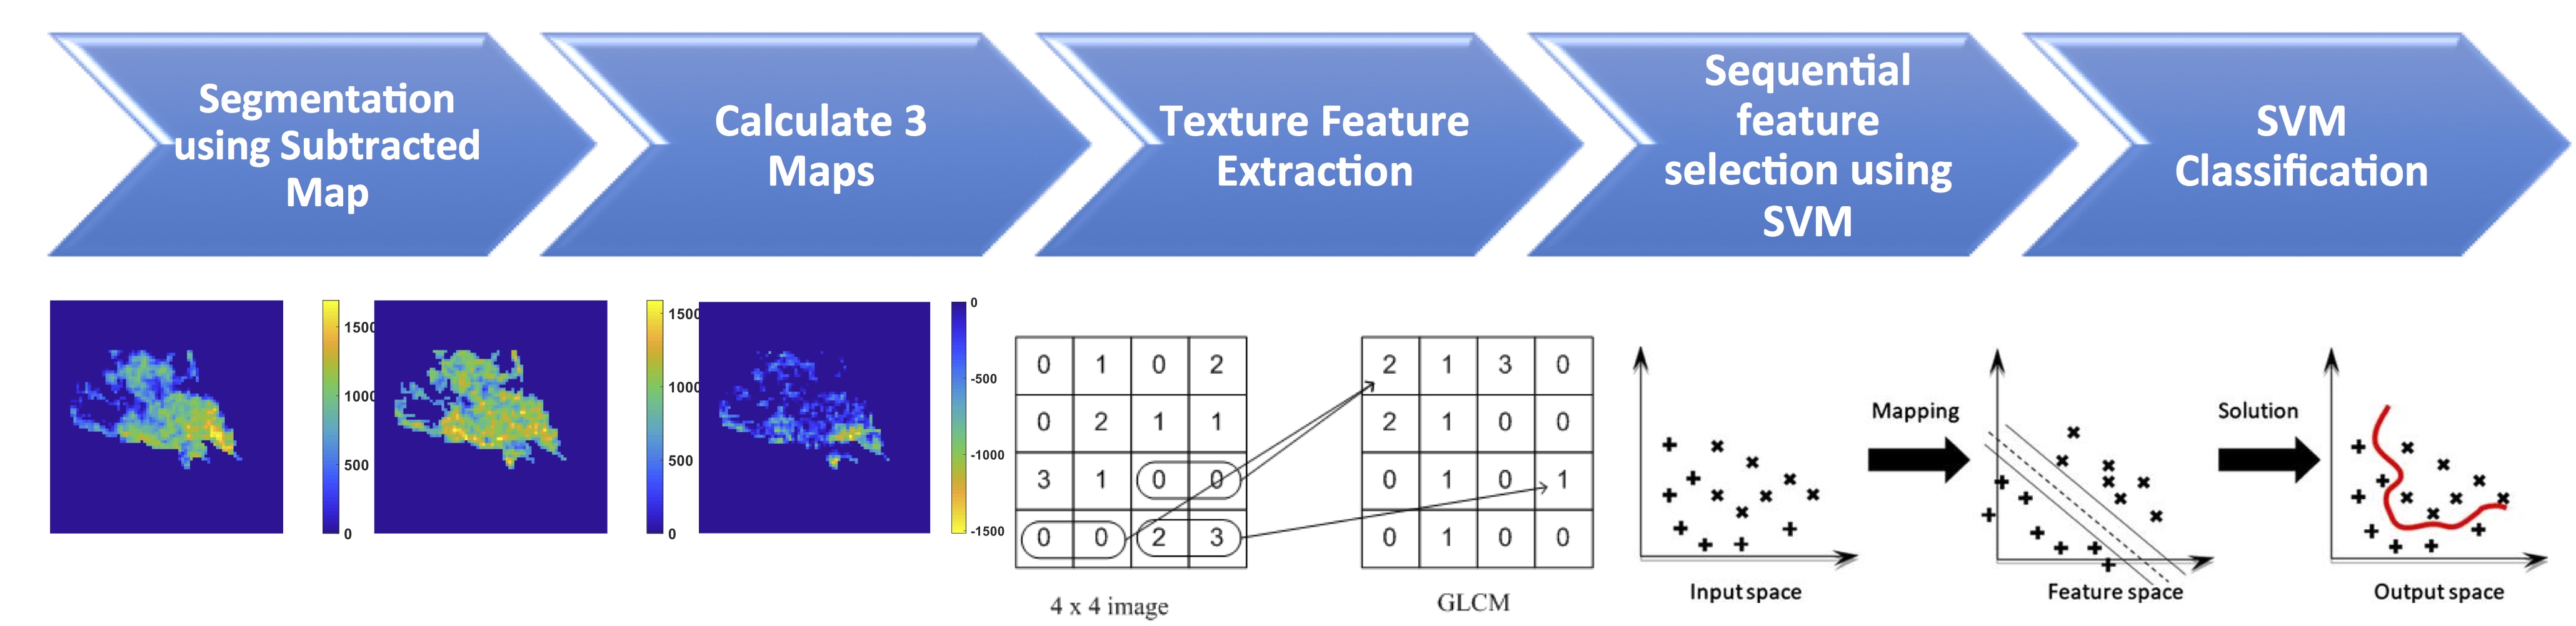
Figure 5: The flowchart of the analysis procedures. The
tumor is first segmented on F2 post-contrast image, and then the tumor ROI is mapped
to 3 generated DCE parametric maps. On each map, 32 first-order and 75 texture parameters
are extracted using the PyRadiomics. For each case, a total of 321 features are
obtained from 3 maps. They are used to develop the SVM classification model to
differentiate benign from malignant lesions.