2321
Comparison of Breast Cancer Diagnostic Performance Using Radiomics Models Built Based on Features Extracted from DCE-MRI and Mammography
Jiejie Zhou1, Yang Zhang2, Kyoung Eun Lee3, Jeon-Hor Chen2, Xiaxia He1, Nina Xu1, Shuxin Ye1, Ouchen Wang1, Jiance Li1, Yezhi Lin4, Meihao Wang1, and Min-Ying Su2
1First Affiliate Hospital of Wenzhou Medical University, Wenzhou, China, 2University of California, Irvine, CA, United States, 3Inje University Seoul Paik Hospital, Seoul, Korea, Republic of, 4Wenzhou Medical University, Wenzhou, China
1First Affiliate Hospital of Wenzhou Medical University, Wenzhou, China, 2University of California, Irvine, CA, United States, 3Inje University Seoul Paik Hospital, Seoul, Korea, Republic of, 4Wenzhou Medical University, Wenzhou, China
Synopsis
A
total of 89 patients receiving both DCE-MRI and mammography were analyzed,
including 56 malignant and 33 benign lesions. The 3D tumor mask on MRI was
generated using computer algorithms. A total of 99 texture and histogram
features were extracted from three DCE parameters maps. The suspicious area on
mammography was outlined using MRI findings as guidance, and a similar
radiomics method was applied to extract features from the mass and the margin.
Random forest was applied to select features for building diagnostic models.
The overall accuracy was 0.80 for MRI, 0.75 for mammography, and improved to
0.85 when combined.
Introduction
Mammography and MRI are commonly used clinical imaging modalities for diagnosis of breast lesions, which are known to reveal different aspects of the lesion and provide complementary information for improved accuracy [1,2]. Subjective reading of mass lesions on mammogram for shape and margin using the BI-RADS lexicon only achieved fair to moderate levels of agreement [3]. With quantitative analysis, circumscribed mammographic masses can be diagnosed with moderate accuracy using different approaches [4,5]. Fully automatic computer-aided diagnostic system for mammography has been developed 2 decades ago, and used routinely in clinical practice. DCE-MRI can measure the vascular properties of the lesion by following the delivery and distribution of gadolinium contrast agents. For MRI, there is no FDA approved system that can give a final diagnostic impression yet. However, since many images are acquired, the DCE-specific analysis software such as CADstream and DynaCAD are commonly used to extract and display the essential information to aid in radiologist’s diagnosis. MRI combined with mammography shows improved sensitivity, specificity, accuracy, PPV and NPV compared to the use of MRI alone [1]. For category 4B mammographic microcalcifications, MRI has the potential to improve PPV by reducing false-positive findings [6]. With the progress in radiomics analysis, many features can be extracted efficiently from medical images, and sophisticated statistical methods can be applied to develop robust diagnostic models. The purpose of this study is to develop radiomics models for diagnosis of lesions shown on MRI and mammography. The performances using MRI alone, mammography alone and both combined, are compared.Methods
A total of 89 patients receiving both mammography and DCE-MRI for diagnosis were analyzed, including 56 malignant and 33 benign tumors, all confirmed by histopathology. Mammography was performed using Fujifilm system. MRI was performed using a GE 3.0T system. The volume imaging for breast assessment (VIBRANT) sequence was used for DCE acquisition, consisting of 6 frames: one pre-contrast (F1) and 5 post-contrast (F2-F6). Tumors were segmented using fuzzy-C-means (FCM) clustering algorithm on each slice. Then, the ROIs from all imaging slices containing this lesion were combined, and 3D connected-component labeling and the hole-filling algorithms were applied to generate the final 3D tumor mask [7,8]. Three heuristic DCE parametric maps were generated according to: the early wash-in signal enhancement (SE) ratio [(F2-F1)/F1]; the maximum SE ratio = [(F3-F1)/F1]; the wash-out slope [(F6-F3)/F3] [9]. Four cases are illustrated in Figures 1 to 4. On each map, 20 Gray Level Co-occurrence Matrix (GLCM) texture features [10], and 13 histogram-based parameters (10%, 20%... 80% to 90% values, mean, standard deviation, kurtosis and skewness) were calculated, with a total of 99 MRI features from three maps. For corresponding mammography, a radiologist outlined the lesion manually with the guidance of MRI. Similarly, a total of 33 features were extracted from the outlined tumor mask on mammography. As shown in figures, the analysis based on the manually outlined boundary could not reveal the margin information. A band shell of 2 cm was created, by expanding and shrinking the tumor boundary by 1 cm, and 33 features were extracted from this shell as margin features. The feature selection process was done by using the random forest algorithm, detailed methods described in [9], and then the selected features were used to build the diagnostic model by using logistic regression. The performance was tested with 10-fold cross-validation.Results
The developed model gave a malignancy probability for each case. They were used to generate ROC curves, and also to make diagnosis based on the threshold of 0.5. The diagnostic sensitivity, specificity, accuracy and the area under the ROC curve (AUC) are summarized in Table 1. The overall accuracy was 80% for DCE-MRI. For mammography, when only using the radiomics features extracted from the mass, the accuracy was 71%; when only using the margin information extracted from the band shell, the accuracy was 68%; when combining both of them, the accuracy was improved to 75%. When combining all MRI and mammography features, the accuracy was further improved to 85%.Discussion
Although computer-aided diagnostic methods have been developed for a long time, it was not widely used due to the limitation of many factors that could not be considered. With the advances in computer technology, extracting large data from medical images using automatic algorithms becomes more feasible; and “radiomics”, which allows high-throughput extraction of tremendous amount of quantitative information from radiographic images, emerged. Furthermore, artificial intelligence (AI) algorithms, particularly deep learning, have demonstrated remarkable progress in medical image analysis, advancing the field forward at a rapid pace. With these new technology, images acquired using different modalities could be better integrated, and even co-registered to make sure that the information was indeed coming from the same suspicious tissues. In this study, we used MRI information as guidance to outline the suspicious tissues on mammography, and performed diagnosis using radiomics analysis. On mammography, when both texture information within the mass and the margin information within the boundary shell were considered, the accuracy was higher compared to using either alone. Furthermore, when all features were considered together, the accuracy was the highest. This pilot study using a small case number was meant to demonstrate the feasibility of the integrated radiomics diagnosis based on MRI and mammography. The method can be further expanded to include information from other imaging modalities as well.Acknowledgements
This work was supported in part by Foundation of Wenzhou Science & Technology Bureau (No. Y20180187 and Y20180144), Medical Health Science and Technology Project of Zhejiang Province Health Commission (No. 2019KY102), and NIH/NCI R01 CA127927 and R21 CA208938.References
[1]. Yang SN, Li FJ, Liao YH, et al. Identification of Breast Cancer Using Integrated Information from MRI and Mammography. PLoS One. 2015 Jun 9;10(6):e0128404. [2]. Tang W, Hu FX, Zhu H, et al. Digital breast tomosynthesis plus mammography, magnetic resonance imaging plus mammography and mammography alone: A comparison of diagnostic performance in symptomatic women. Clin Hemorheol Microcirc. 2017;66(2):105-116. [3]. Rawashdeh M, Lewis S, Zaitoun M, Brennan P. Breast lesion shape and margin evaluation: BI-RADS based metrics understate radiologists' actual levels of agreement. Comput Biol Med. 2018 May 1;96:294-298. [4]. Ohta T, Nakata N, Nishioka M, et al. Quantitative differentiation of benign and malignant mammographic circumscribed masses using intensity histograms. Jpn J Radiol. 2015 Sep;33(9):559-65. [5]. Li H, Mendel KR, Lan L, et al. Digital Mammography in Breast Cancer: Additive Value of Radiomics of Breast Parenchyma. Radiology. 2019 Apr;291(1):15-20. [6]. Eun NL, Son EJ, Gweon HM, Youk JH, Kim JA. The value of breast MRI for BI-RADS category 4B mammographic microcalcification: based on the 5th edition of BI-RADS. Clin Radiol. 2018 Aug;73(8):750-755. [7]. Nie K, Chen JH, Yu HJ, Chu Y, Nalcioglu O, Su MY. Quantitative Analysis of Lesion Morphology and Texture Features for Diagnostic Prediction in Breast MRI. Acad Radiol 2008;15:1513–1525. [8]. Newell D, Nie K, Chen JH, Hsu CC, Yu HJ, Nalcioglu O, Su MY. Selection of diagnostic features on breast MRI to differentiate between malignant and benign lesions using computer-aided diagnosis: differences in lesions presenting as mass and non-mass-like enhancement. Eur Radiol. 2010;20(4):771-781. [9]. Zhou J, Zhang Y, Chang KT, et al. Diagnosis of Benign and Malignant Breast Lesions on DCE-MRI by Using Radiomics and Deep Learning With Consideration of Peritumor Tissue. J Magn Reson Imaging. 2019 Nov 1. doi: 10.1002/jmri.26981. [Epub ahead of print] [10]. Haralick RM and Shanmugam K. Textural features for image classification. IEEE Transactions on systems, man, and cybernetics, 1973; no. 6, pp. 610-621Figures
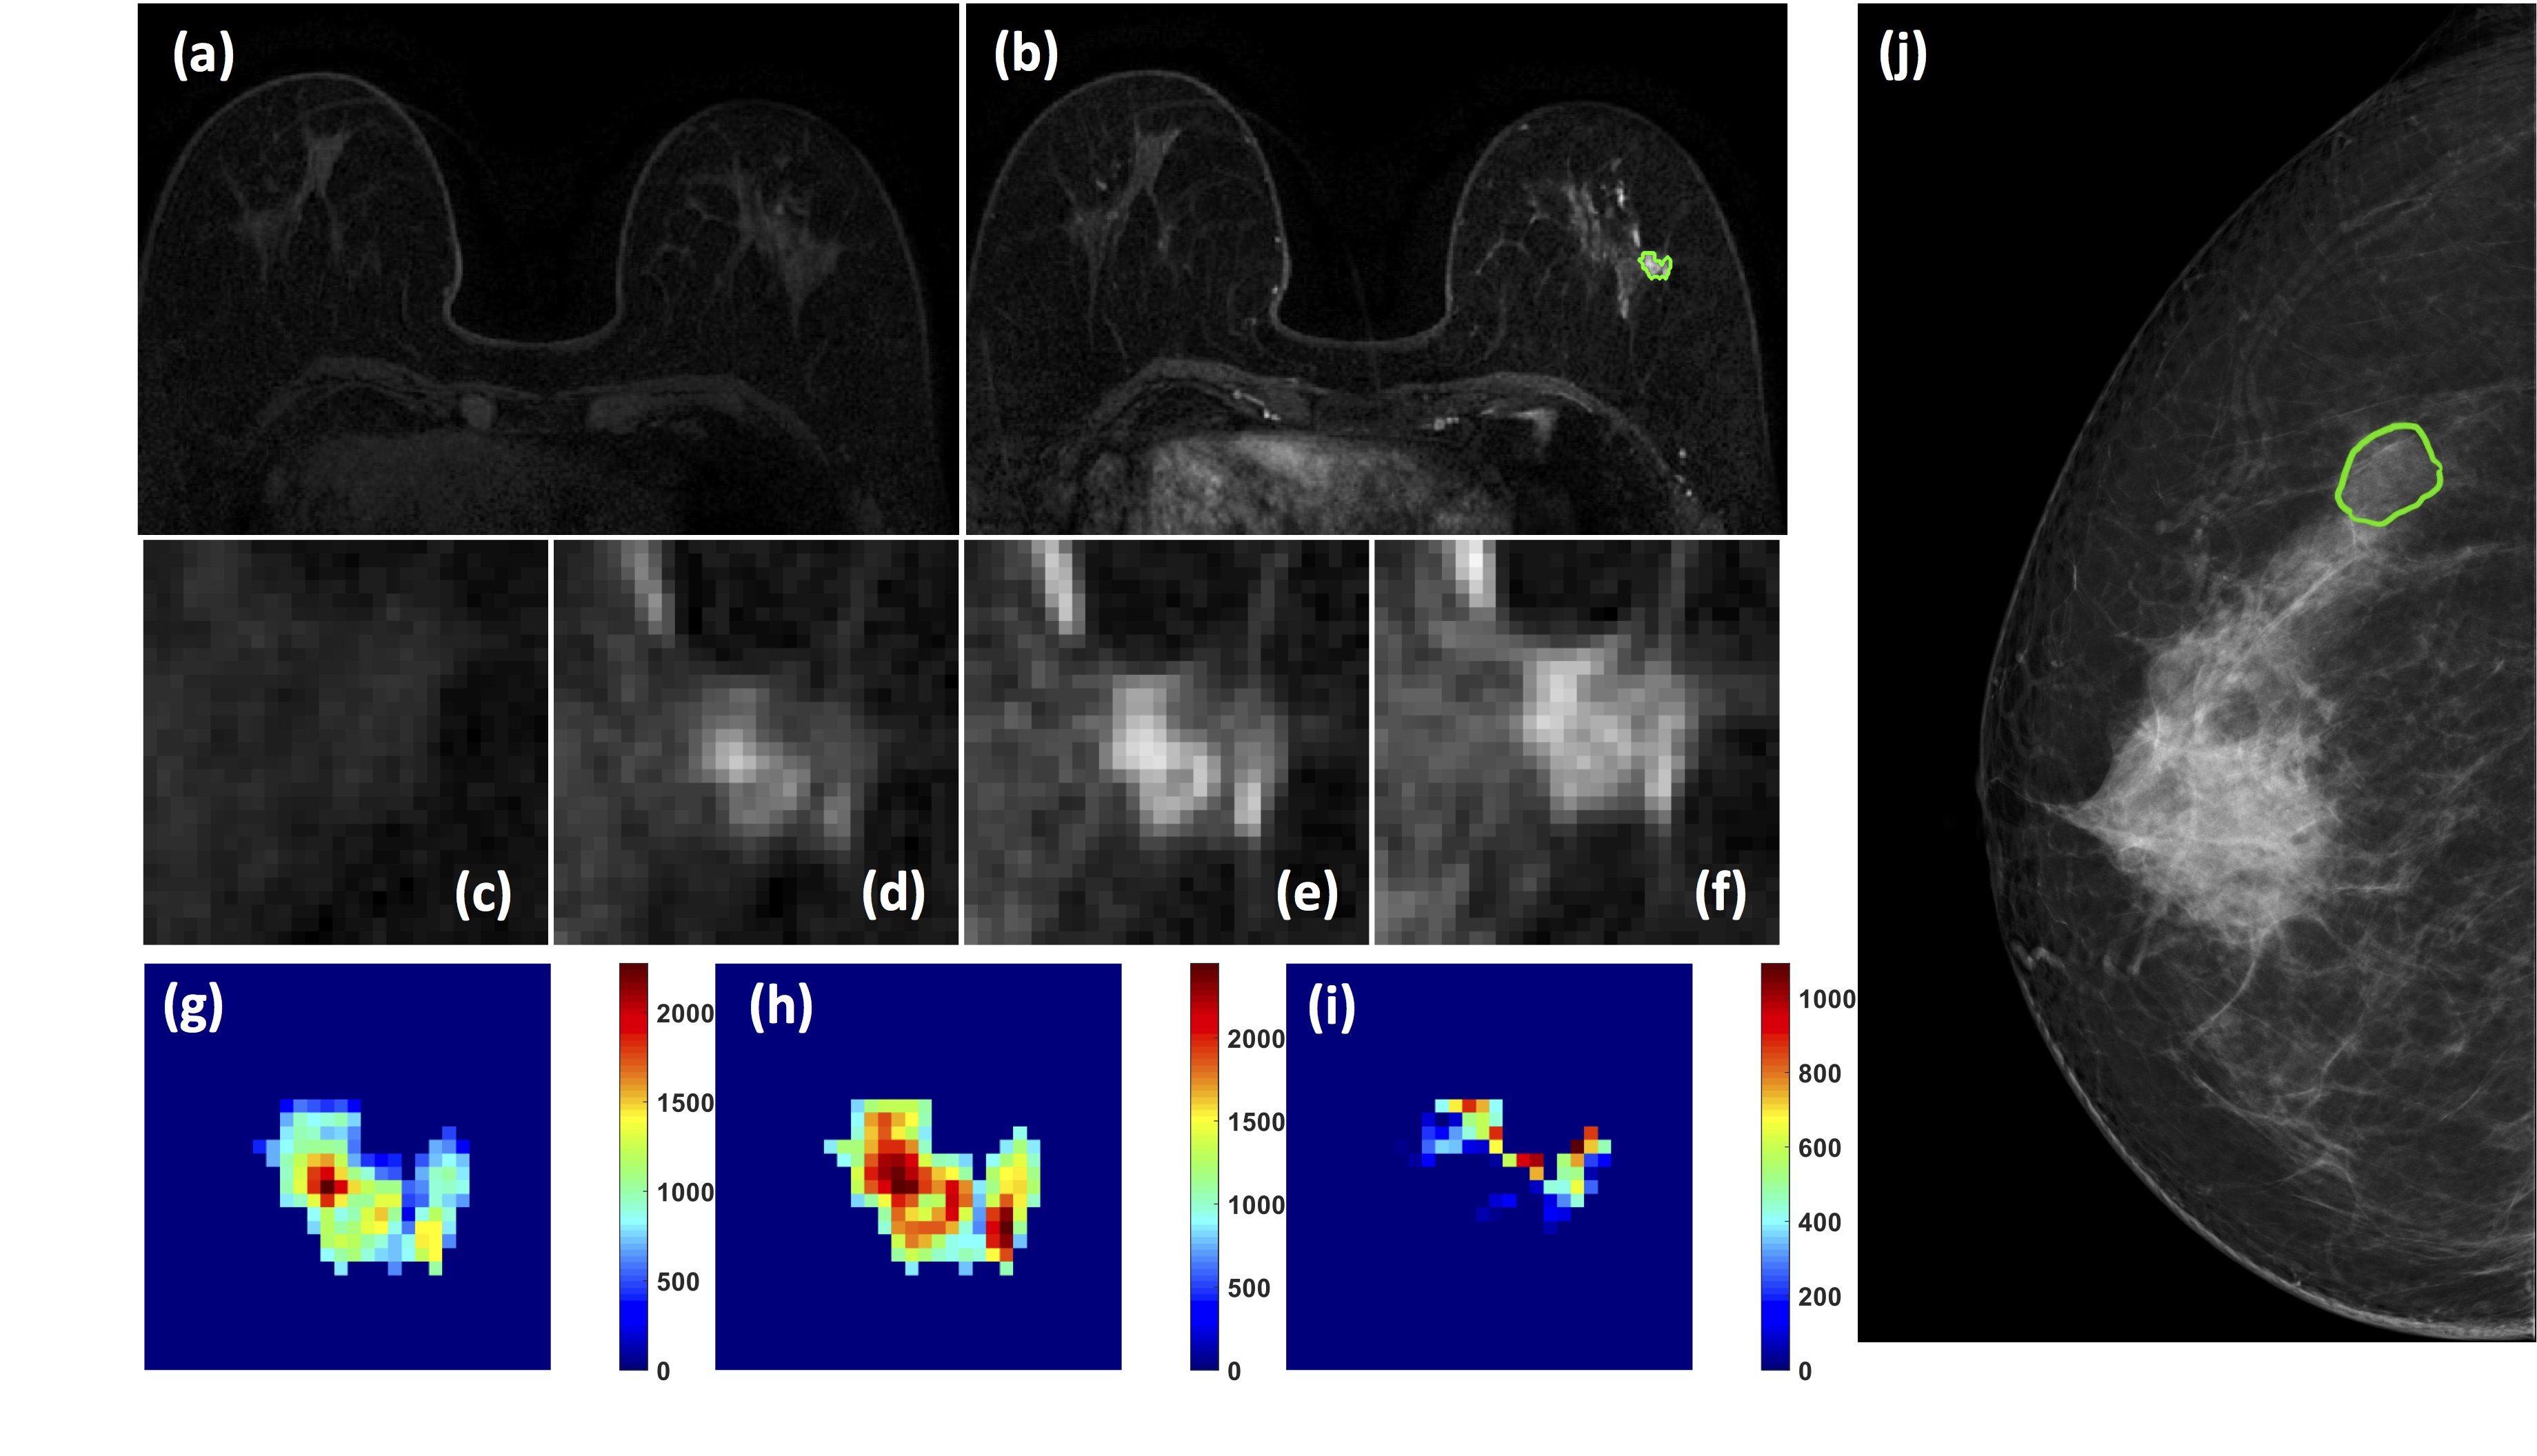
Figure
1: A 63-year-old patient with adenosis. (a) F1
Pre-contrast image. (b) F2 post-contrast image. (c-i) Magnified images to
demonstrate the margin and internal enhancements within the lesion. (c) F1
pre-contrast, (d) F2 post-contrast, (e) F3 post-contrast, (f) The last F6
post-contrast image. (g) The wash-in signal enhancement map F2-F1, (h) The
F3-F1 signal enhancement map, (i) The wash-out F6-F3 map. (J) The lesion is not
clearly seen on mammography, and an area is outlined with the guidance of MRI.
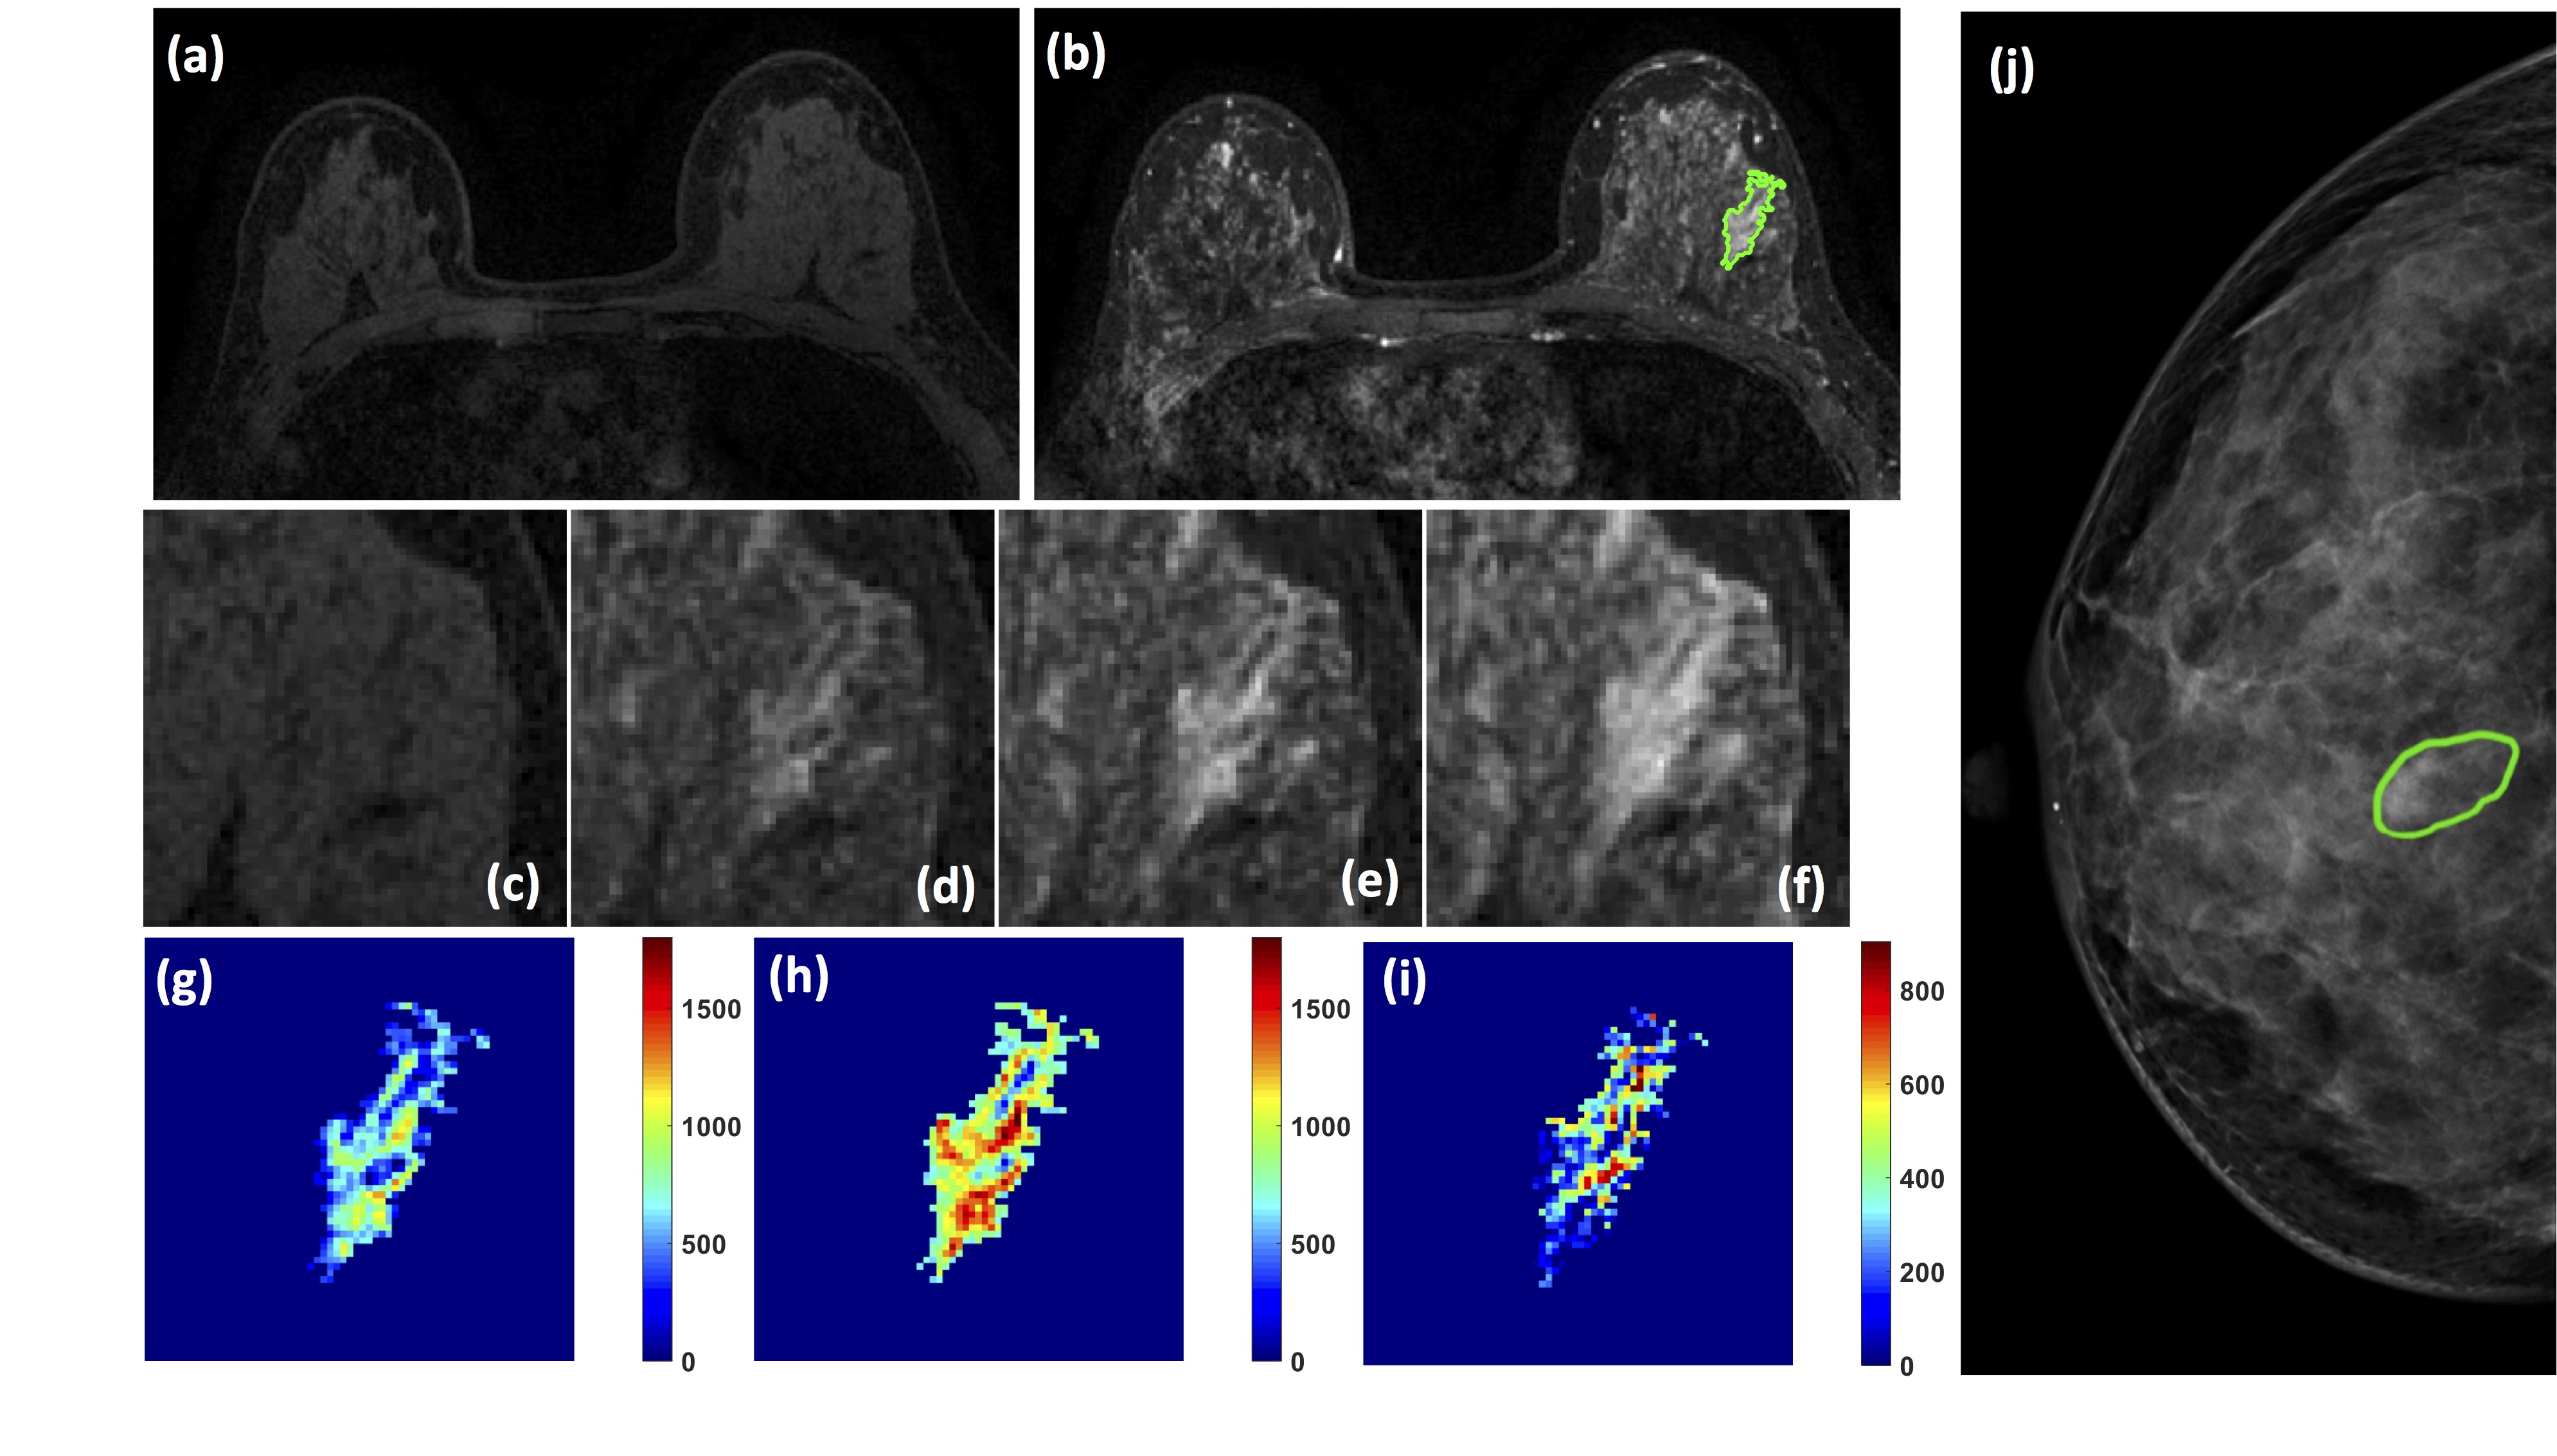
Figure 2: A 46-year-old patient with adenosis. (a) F1 Pre-contrast image. (b) F2
post-contrast image. (c-i) Magnified images to demonstrate the margin and
internal enhancements within the lesion. (c) F1 pre-contrast, (d) F2
post-contrast, (e) F3 post-contrast, (f) The last F6 post-contrast image. (g)
The wash-in signal enhancement map F2-F1, (h) The F3-F1 signal enhancement map,
(i) The wash-out F6-F3 map. (J) The lesion is not clearly seen on mammography,
and an area is outlined with the guidance of MRI.
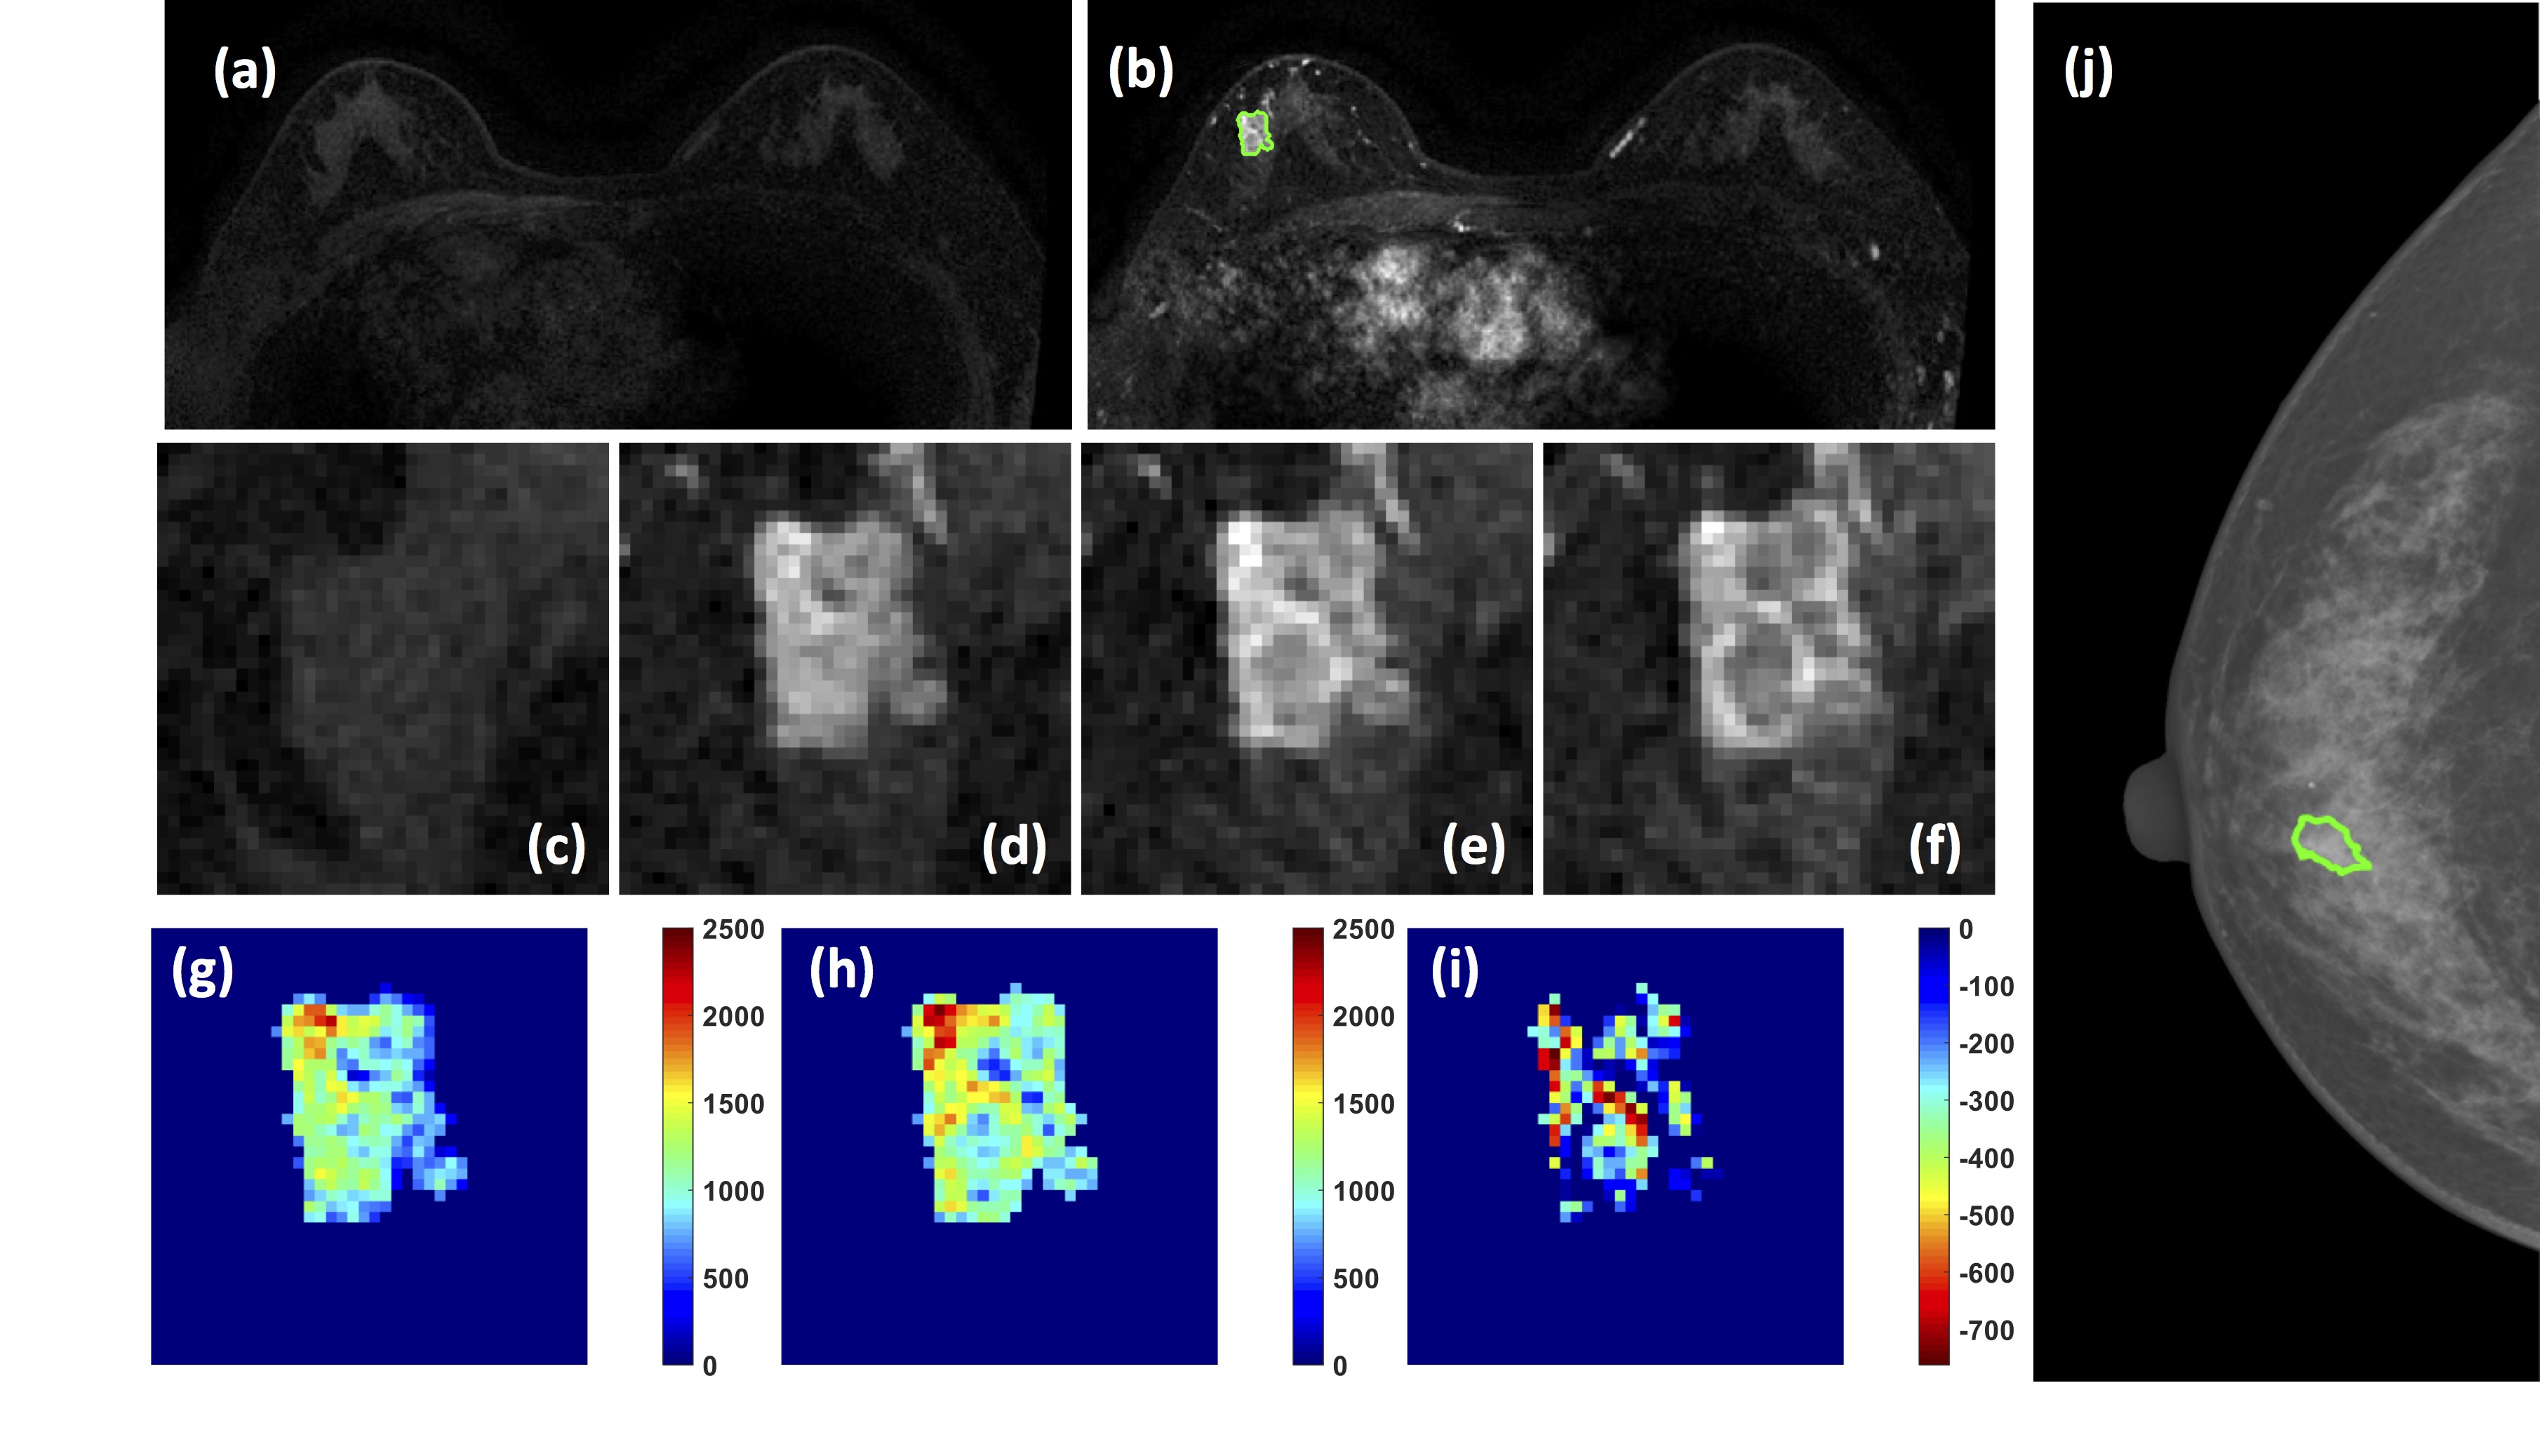
Figure 3: A 58-year-old patient with a
ductal carcinoma in situ. (a) F1 Pre-contrast image. (b) F2
post-contrast image. (c-i) Magnified images to demonstrate the margin and
internal enhancements within the lesion. (c) F1 pre-contrast, (d) F2
post-contrast, (e) F3 post-contrast, (f) The last F6 post-contrast image. (g)
The wash-in signal enhancement map F2-F1, (h) The F3-F1 signal enhancement map,
(i) The wash-out F6-F3 map. (J) The lesion is not clearly seen on mammography,
and an area is outlined with the guidance of MRI.
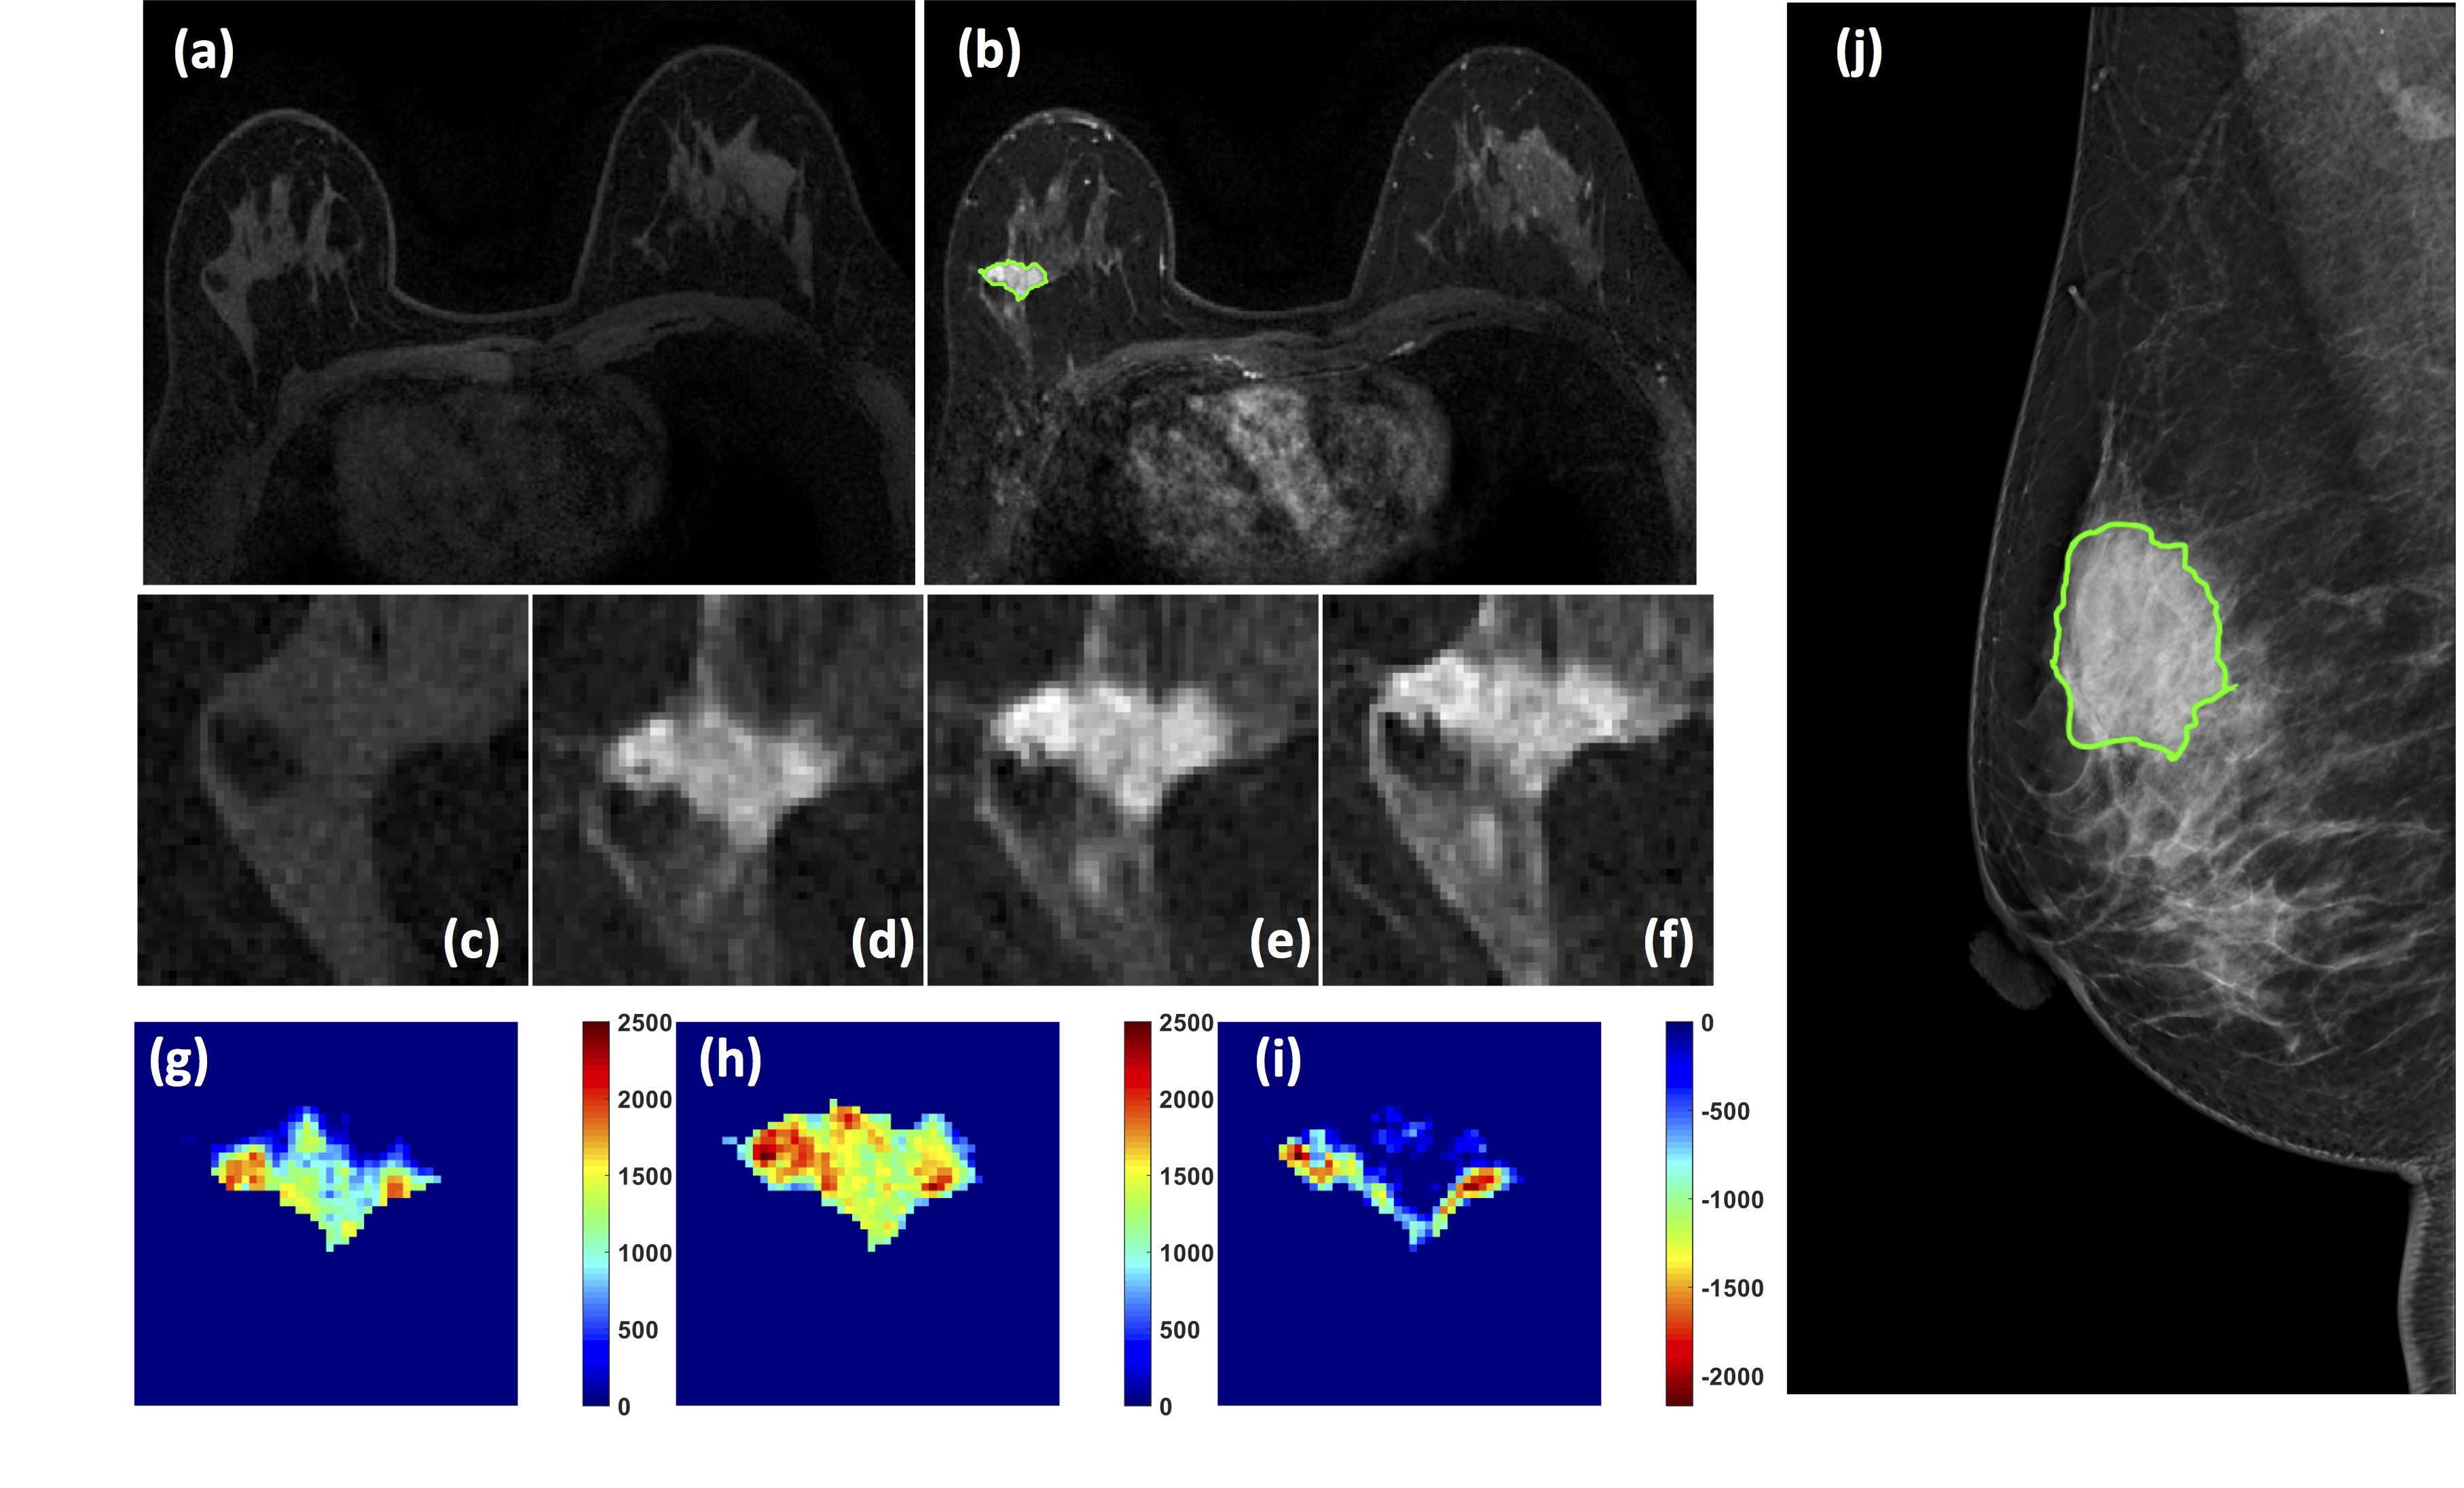
Figure
4: A 50-year-old patient with an invasive ductal
cancer. (a) F1 Pre-contrast image. (b) F2 post-contrast
image. (c-i) Magnified images to demonstrate the margin and internal enhancements
within the lesion. (c) F1 pre-contrast, (d) F2 post-contrast, (e) F3
post-contrast, (f) The last F6 post-contrast image. (g) The wash-in signal
enhancement map F2-F1, (h) The F3-F1 signal enhancement map, (i) The wash-out
F6-F3 map. (J) A mass lesion with spiculation is clearly noted on mammography, and
manually outlined by a radiologist.
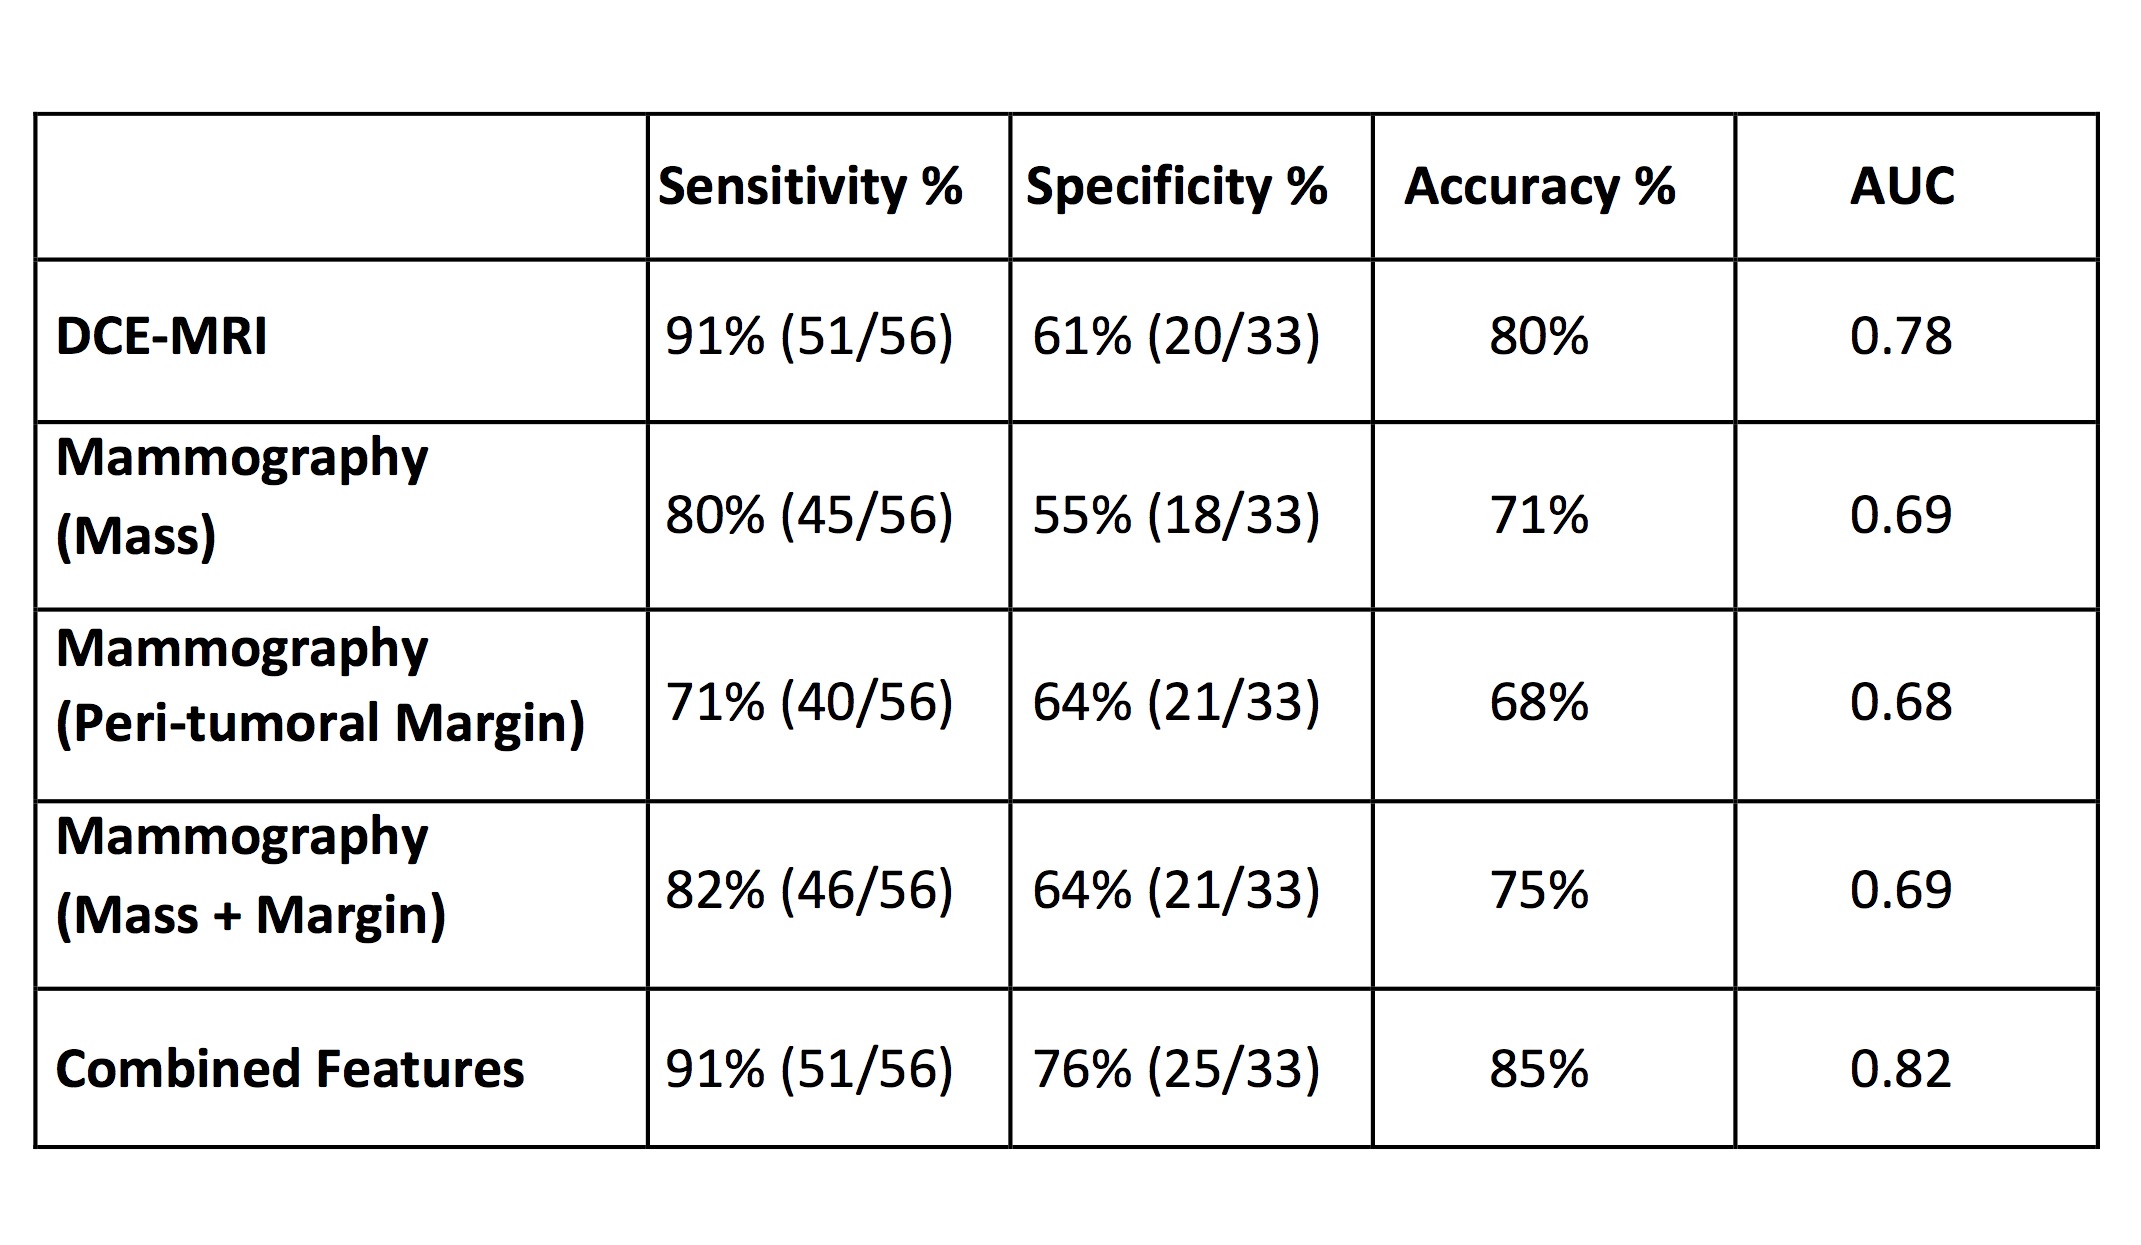
Table
1: The diagnostic
results of different radiomics models built based on the features extracted
from DCE-MRI, the outlined mass on mammography, the margin shell on
mammography, mass+margin on mammography, and all combined features.