2319
Background Parenchymal Enhancement (BPE) classification on Breast MRI using Deep Learning1Memorial Sloan Kettering Cancer Center, New York, NY, United States
Synopsis
Breast cancer risk in high risk women is significantly increased for those with high background parenchymal enhancement (BPE) compared to low BPE, yet there is only fair to moderate inter-rater agreement for BPE assessment among radiologists, limiting the use of BPE as a marker of cancer risk. We developed a deep learning algorithm that classifies BPE with high accuracy. The algorithm works best when sub-MIPs, not MIPs, are used as network inputs. The algorithm has potential to autopopulate breast MRI reports in our breast imaging clinic, and ultimately to standardize BPE as a marker of breast cancer risk.
Introduction
Background parenchymal enhancement (BPE) is a qualitative measure of normal breast tissue enhancement after intravenous contrast administration.1 Radiologists assign qualitative level of BPE to every breast MRI using a four-point scale: Marked, Moderate, Mild or Minimal.2 Previous work in high-risk women demonstrates that breast cancer risk is significantly increased with high BPE (i.e. Marked/Moderate) compared to low BPE (i.e. Mild/Minimal).1,3 However, there is only fair to moderate inter-rater agreement for BPE assessment among radiologists which limits the use of BPE as a marker of cancer risk.4 Herein, we develop a deep learning (DL) algorithm to classify breast MRIs as high or low BPE, and compare DL assessments to subjective radiologists’ review. The secondary purpose of this study was to evaluate performance of sub-MIPs compared to MIPs as a DL algorithm input.Methods
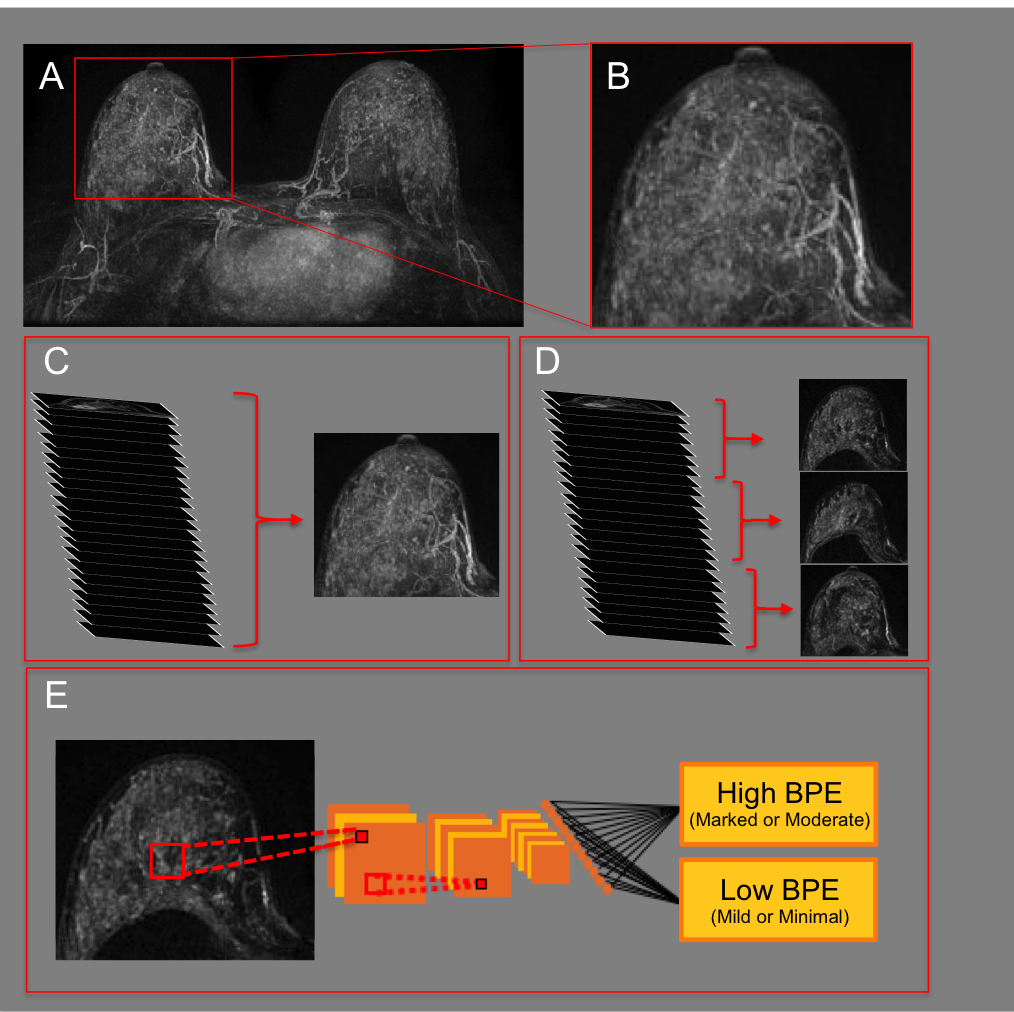
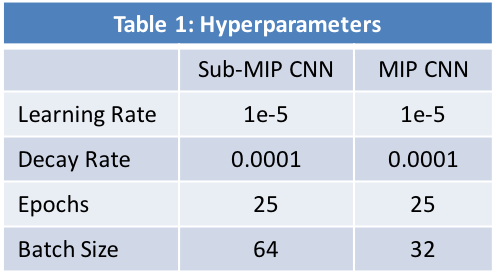
This retrospective HIPPA-compliant study received IRB-approval. Informed consent was waived. A convolutional neural network (CNN) was developed to predict BPE level based on the original radiology report using a dataset of 1,500 consecutive breast MRIs classified as BI-RADS-1 (negative) that were performed between August 2016 and January 2019. All patients underwent contrast-enhanced MRI on a 1.5 or 3.0 Tesla system (Discovery 750, GE Medical Systems, Waukesha, WI) with a dedicated breast coil. Axial subtraction images, created from T1-weighted fat-suppressed images acquired pre-contrast and at 90 seconds after contrast injection, were used for all subsequent analysis. A fully-automated in-house algorithm was used for breast segmentation (see Figure 1A, 1B). 3D subtraction images were used to generate standard axial MIPs (see Figure 1C). Single “sub-MIP” images were also created from slabs of 15 consecutive 3D subtraction slices allowing for the generation of multiple distinct MIP-like images per case (see Figure 1D). Data augmentation (i.e. translation, rotation, magnification) and data normalization was performed prior to training. Sub-MIPs were used as 2D inputs to develop a CNN to predict BPE designations from the original radiology report (see Figure 1D). A second CNN was developed using standard MIPs instead of sub-MIPs. Sub-MIP and MIP CNNs were designed using Python with Keras Toolbox and TensorFlow backend and were run on a server using a NVIDIA GTX 1080ti GPU. A VGG19 architecture,5 pre-trained on ImageNet6 was used with stochastic gradient descent optimizer and categorical cross entropy loss. Hyperparameters were selected by grid search to optimize validation dataset performance (see Table 1). Data was randomly divided 70%/15%/15% into training/validation/testing. Of the 215 test set breast MRIs, 100 were randomly designated as the reader study dataset. Three independent radiologists (4-15 years of experience) performed qualitative BPE assessments by subjective radiologist review on the reader study dataset. Reader results were averaged to obtain a consensus reading of either high or low BPE. Sub-MIP and MIP CNN accuracy were calculated over the test set, using the radiology report as gold standard. Sub-MIP CNN accuracy was calculated over the reader study dataset using: (1) the radiology report as gold standard and (2) consensus readings from the reader study dataset as gold standard.Results
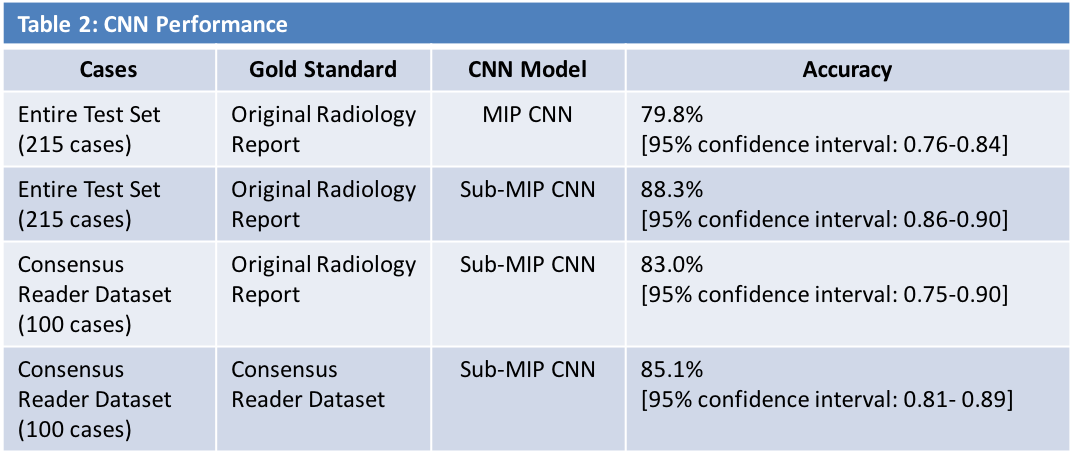
Over the test set, sub-MIP CNN accuracy [88.3%, 95% confidence interval: 0.86-0.90] was statistically significantly greater than MIP CNN accuracy [79.8%, 95% confidence interval: 0.76-0.84], using the radiology report as a gold standard. Over the reader study dataset, sub-MIP CNN accuracy using the radiology report as a gold standard was 83.0% [95% confidence interval 0.75-0.90]. Over the reader study dataset, sub-MIP CNN accuracy using the consensus readings as a gold standard was 85.1% [95% confidence interval 0.81-0.89]. See Table 2 for details.Discussion
This study demonstrates the feasibility of using a CNN to classify breast MRIs as high or low BPE with high accuracy. CNN robustness was demonstrated not only against the initial qualitative BPE assessment from radiology reports (the labels used during CNN training), but also against consensus qualitative BPE readings.To increase the number of training examples, 3D images were divided into several slabs, with each slab creating a distinct “sub-MIP”. This new data augmentation technique resulted in a statistically significant increase in CNN accuracy, and should be considered for use in future DL algorithm development.
Other groups have trained DL algorithms to quantify BPE using automated algorithms as a gold standard,7 but to our knowledge, our work represents the first use of a CNN to categorize breast MRIs according to BPE categories using radiologists as a gold standard.
Conclusion
The developed deep learning algorithm can classify breast MRIs into high and low BPE categories with high accuracy. The DL algorithm works best when sub-MIPs, not MIPs, are used as network inputs. This algorithm has potential to autopopulate breast MRI reports in our breast imaging clinic, and ultimately to standardize BPE as a marker of breast cancer risk.Acknowledgements
No acknowledgement found.References
1. King V., Brooks J., Bernstein J., et al. Background Parenchymal Enhancement at Breast MR Imaging and Breast Cancer Risk. Radiology. 2011;260(1): 50-60.
2. Morris EA, Comstock CE, Lee CH, et al. ACR BI-RADS® Magnetic Resonance Imaging. In: ACR BI-RADS® Atlas, Breast Imaging Reporting and Data System. Reston, VA, American College of Radiology; 2013.
3. Dontchos B., Rahbar H., Partridge SC., et al. Are Qualitative Assessments of Background Parenchymal Enhancement, Amount of Fibroglandular Tissue on MR Images, and Mammographic Density Associated with Breast Cancer Risk? Radiology. 2015; 276: 371-380.
4. Melsaether A., McDermott M., Gupta D., et al. Inter- and intrareader agreement for categorization of background parenchymal enhancement at baseline and after training. Am J Roetgenol. 2014. 203(1): 209-215
5. Simonyan, Karen, and Andrew Zisserman. "Very deep convolutional networks for large-scale image recognition." arXiv preprint arXiv:1409.1556 (2014).
6. ImageNet. http://www.image-net.org
7. Ha R., Chang P., Mema E., et al. Fully Automated Convolutional Neural Network Method for Quantification of Breast MRI Fibroglandular Tissue and Background Parenchymal Enhancement. Journal of Digital Imaging. 2019. 32(1): 141-147.
Figures