2318
Automatic Detection and Segmentation of Breast Cancer on MRI Using Mask R-CNN Trained on Non-Fat-Sat Images and Tested on Fat-Sat Images1Department of Radiological Science, University of California, Irvine, CA, United States, 2Department of Radiology, First Affiliate Hospital of Wenzhou Medical University, Wenzhou, China, 3Department of Radiology and Research Institute of Radiological Science, Severance Hospital, Yonsei University College of Medicine, Seoul, Korea, Republic of, 4Department of Medical Imaging, Taichung Tzu-Chi Hospital, Taichung, Taiwan, 5Department of Radiology, E-Da Hospital and I-Shou University, Kaohsiung, Taiwan
Synopsis
The mask R-CNN algorithm was implemented to search entire images to identify suspicious lesions for further evaluation of malignancy probability. One training (N=98, Siemens 1.5T, non-fat-sat) and two independent testing (N=241, Siemens 3T, non-fat-sat; and N=91, GE 3T, fat-sat) datasets were used. The pre-contrast and subtraction image, and the subtraction image of the contralateral breast, were used as three inputs. The training set had a total of 1353 positive slices (containing lesion), 8055 negative slices without lesion. The 10-fold cross-validation showed accuracy=0.80 and mean DSC= 0.82. The accuracy was 0.73 and 0.62 for two testing datasets, lower for fat-sat images.
Introduction
Breast MRI is a well-established imaging modality for diagnosis of breast cancer. The analysis is usually done by radiologists’ visual interpretation based on images or maps generated by subtraction, maximum intensity projection (MIP), DCE time course, and color-coded DCE wash-out patterns, etc. Since thin slice was acquired, many slices were needed to cover the entire breast, and it would take some time and effort for a radiologist to carefully evaluate all slices. For patients with multiple lesions or satellite lesions, smaller lesions may be over-looked. More advanced algorithms can be applied to automatically detect lesions, and further characterize them to give benign vs. malignant diagnostic impression. The detection of lesions is mainly based on contrast enhancement maps; however, the strong enhancement in the chest and the strong parenchymal enhancement may influence the performance of the searching algorithms, and lead to false positive diagnosis. Recently, deep learning, especially convolution neural network (CNN), has shown great potential in pattern recognition and object detection, and it may be applied for automatic detection of breast lesions. The purpose of this study was to implement Mask R-CNN to search and detect suspicious lesions in the entire image dataset of one case. After the location of the suspicious lesion was detected, the malignant probability was given to evaluate the accuracy. Also, the tumor was segmented and the result compared to the ground truth.Methods
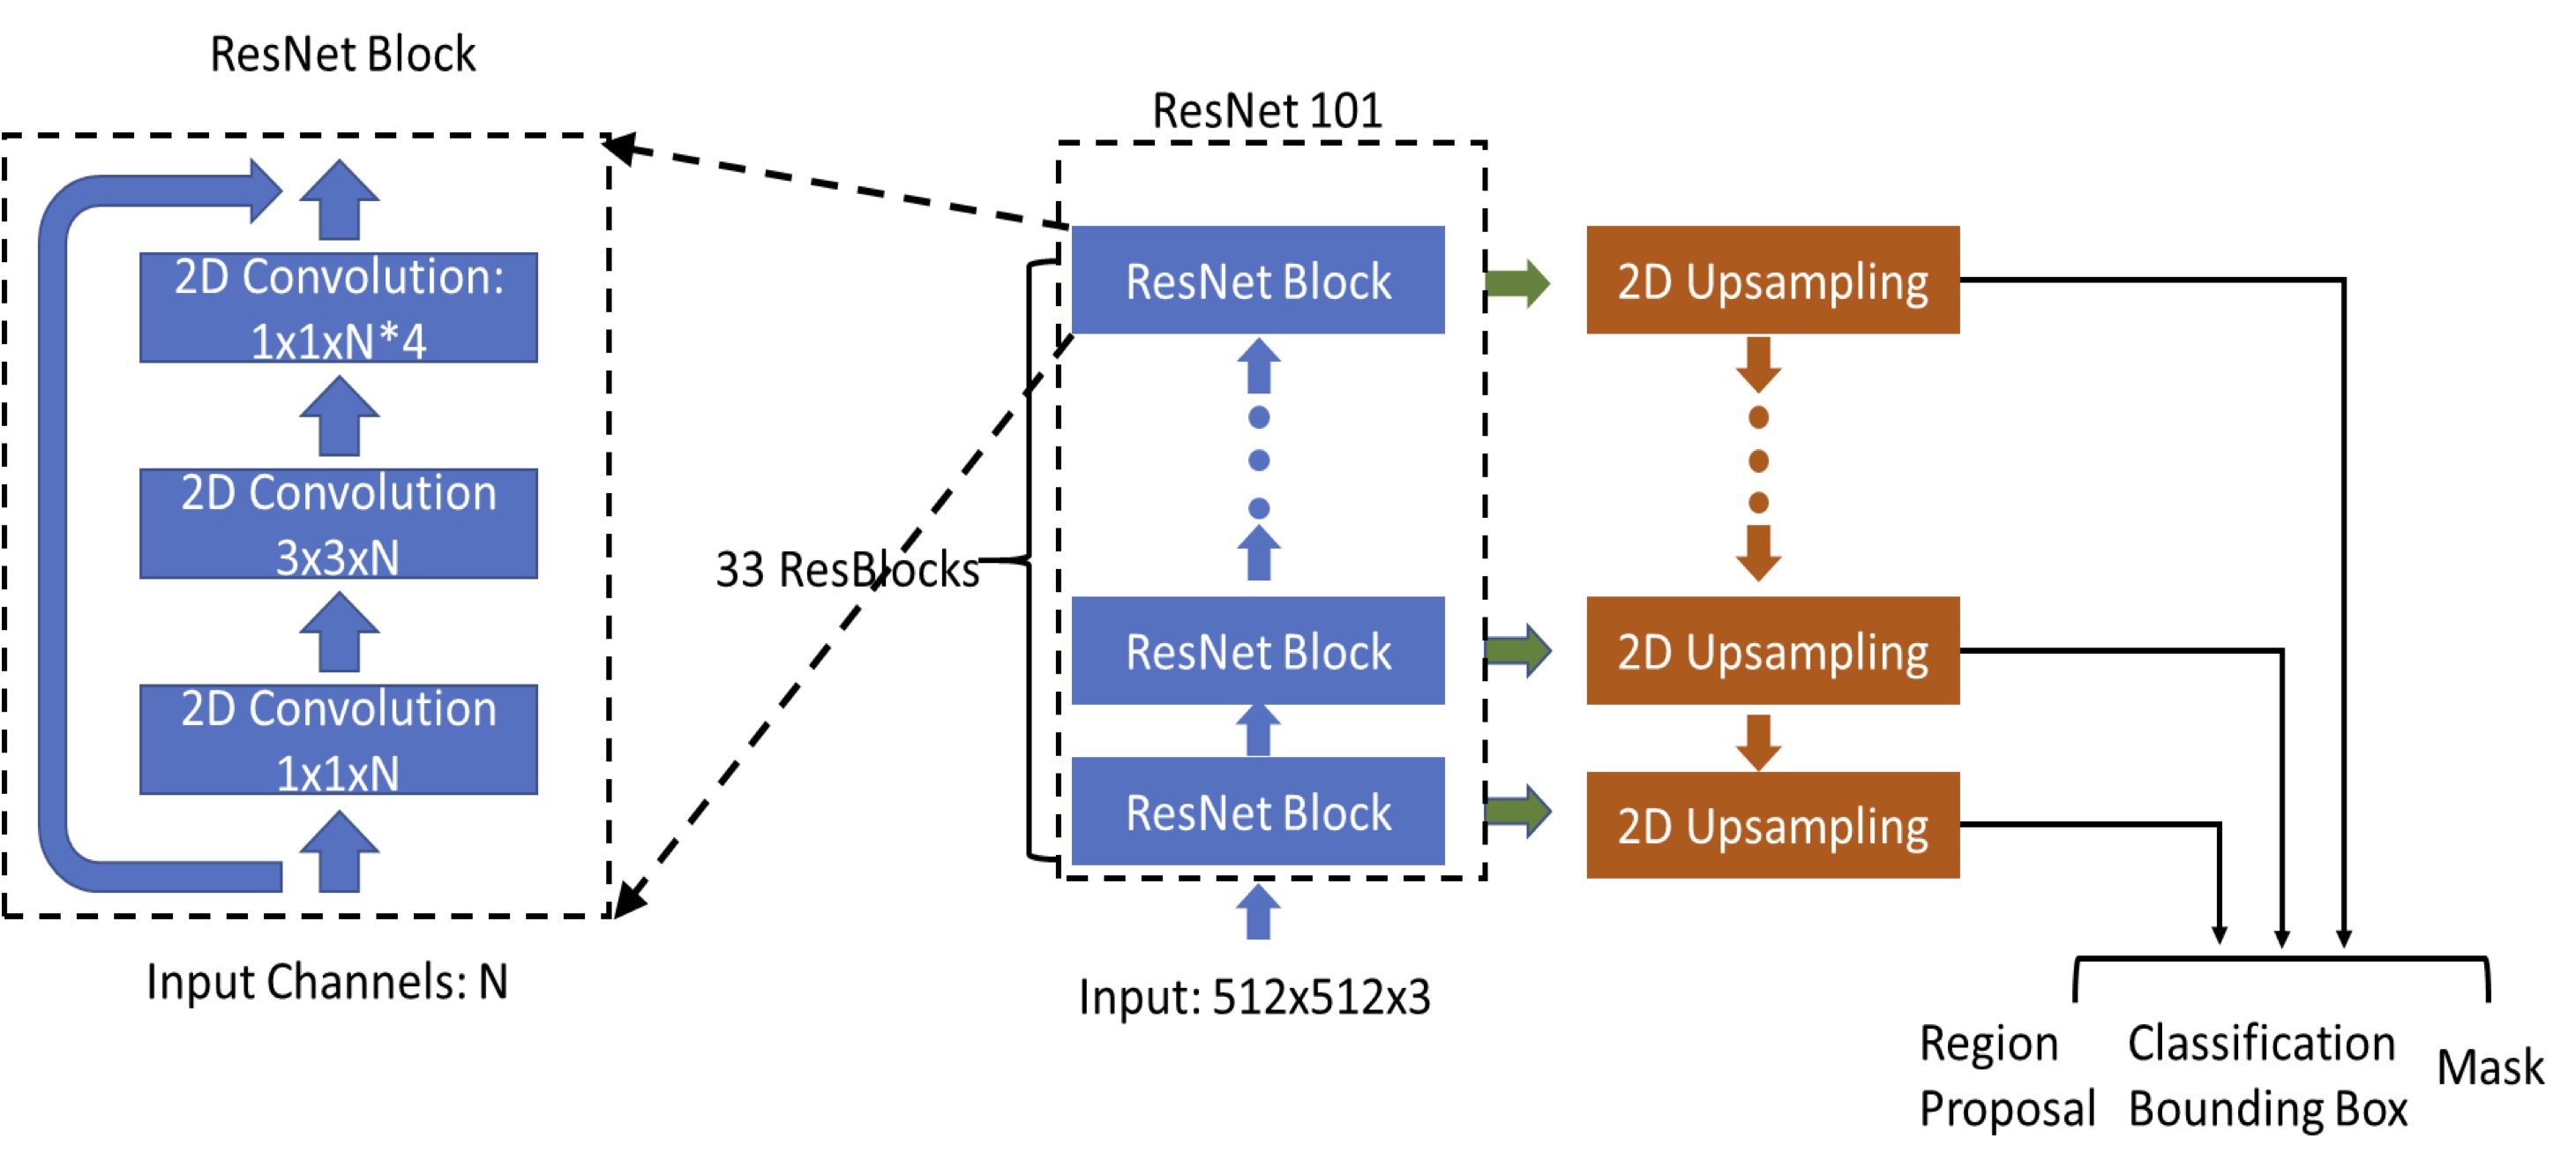
Three datasets were used in this study, one for training and two for independent validation. The first dataset used for training had 98 patients. The MRI was performed using a Siemens 1.5T system, with a non-fat-set DCE sequence. The analysis was done using per-slice basis, with a total of 1353 positive (slices containing lesion), and 8055 negative slices without lesion. The second dataset used for independent testing had 241 patients (1469 positive 9135 negative slices). The MRI was performed using a Siemens 3.0T system, also with a non-fat-set DCE sequence. The other testing dataset had 91 patients (1358 positive 9198 negative slices). The MRI was performed on a GE 3.0T system, using a fat-sat DCE sequence, which had lower signal-to-noise ratio and also lower image contrast. The lesion was segmented using fuzzy-C-means clustering according to radiologist’s annotation of lesion location and slice range [1], and then the smallest bounding box was generated as the ground truth. Each image was divided into left and right breast. The deep learning detection algorithm was implemented using Mask R-CNN framework [2]. We used RetinaNet network architecture to do the bounding box regression and to build a mask estimation [3]. The ResNet101 was selected as the backbone network to build Feature Pyramid Network (FPN) and ImageNet was used as initial parameter values [4]. The architecture is shown in Figure 1. The output of FPN was sent to three sub-networks: bounding box regression network, object classification network, and mask network. The number of input channel was 3, which included the pre-contrast and subtraction image of the lesion side, and the subtraction image of the normal contralateral side. After the output box was generated, the Intersection over Union (IoU) was utilized to evaluate the accuracy of the predicted bounding boxes based on the ground truth. The prediction was considered as true positive if IoU was over 0.5. If no bounding box was detected on images which did not contain lesion, the prediction was considered as true negative. All positive results were sent to mask network to generate the lesion masks. The segmentation performance was evaluated using the Dice Similarity Coefficient (DSC). The final detection model was developed using 10-fold cross-validation in the training dataset, and then applied to two independent testing datasets to evaluate the performance.Results
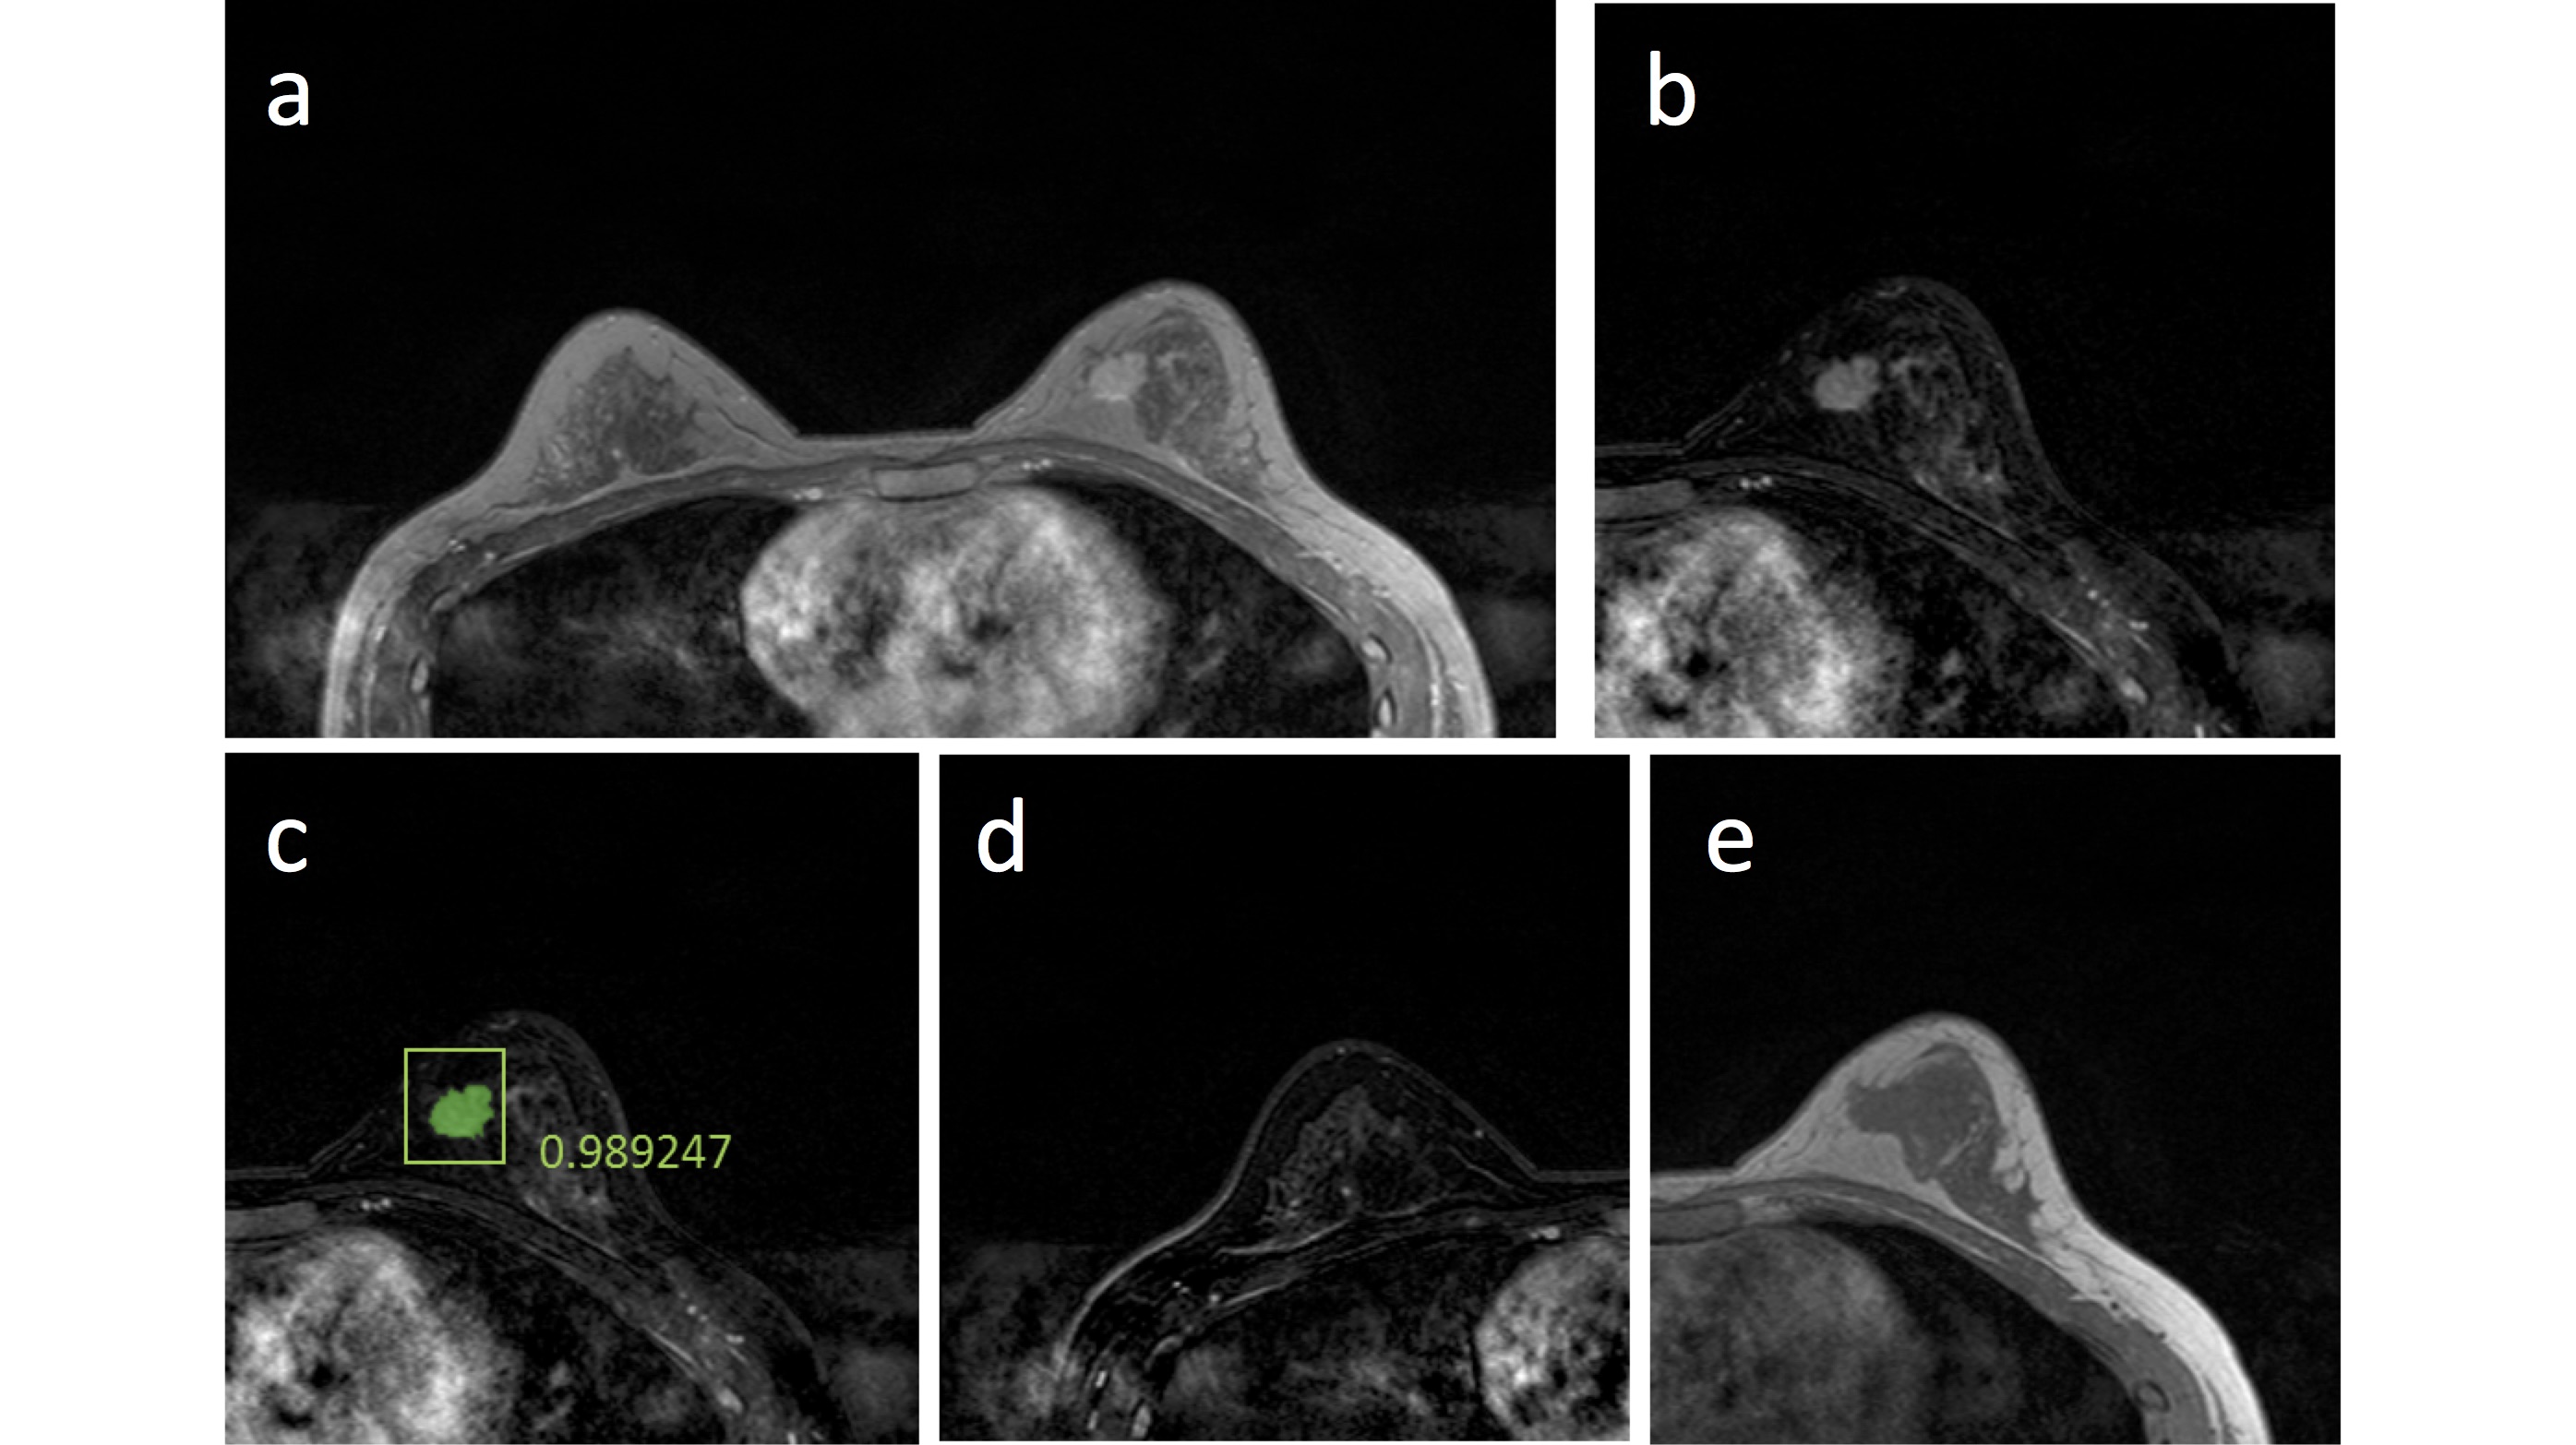
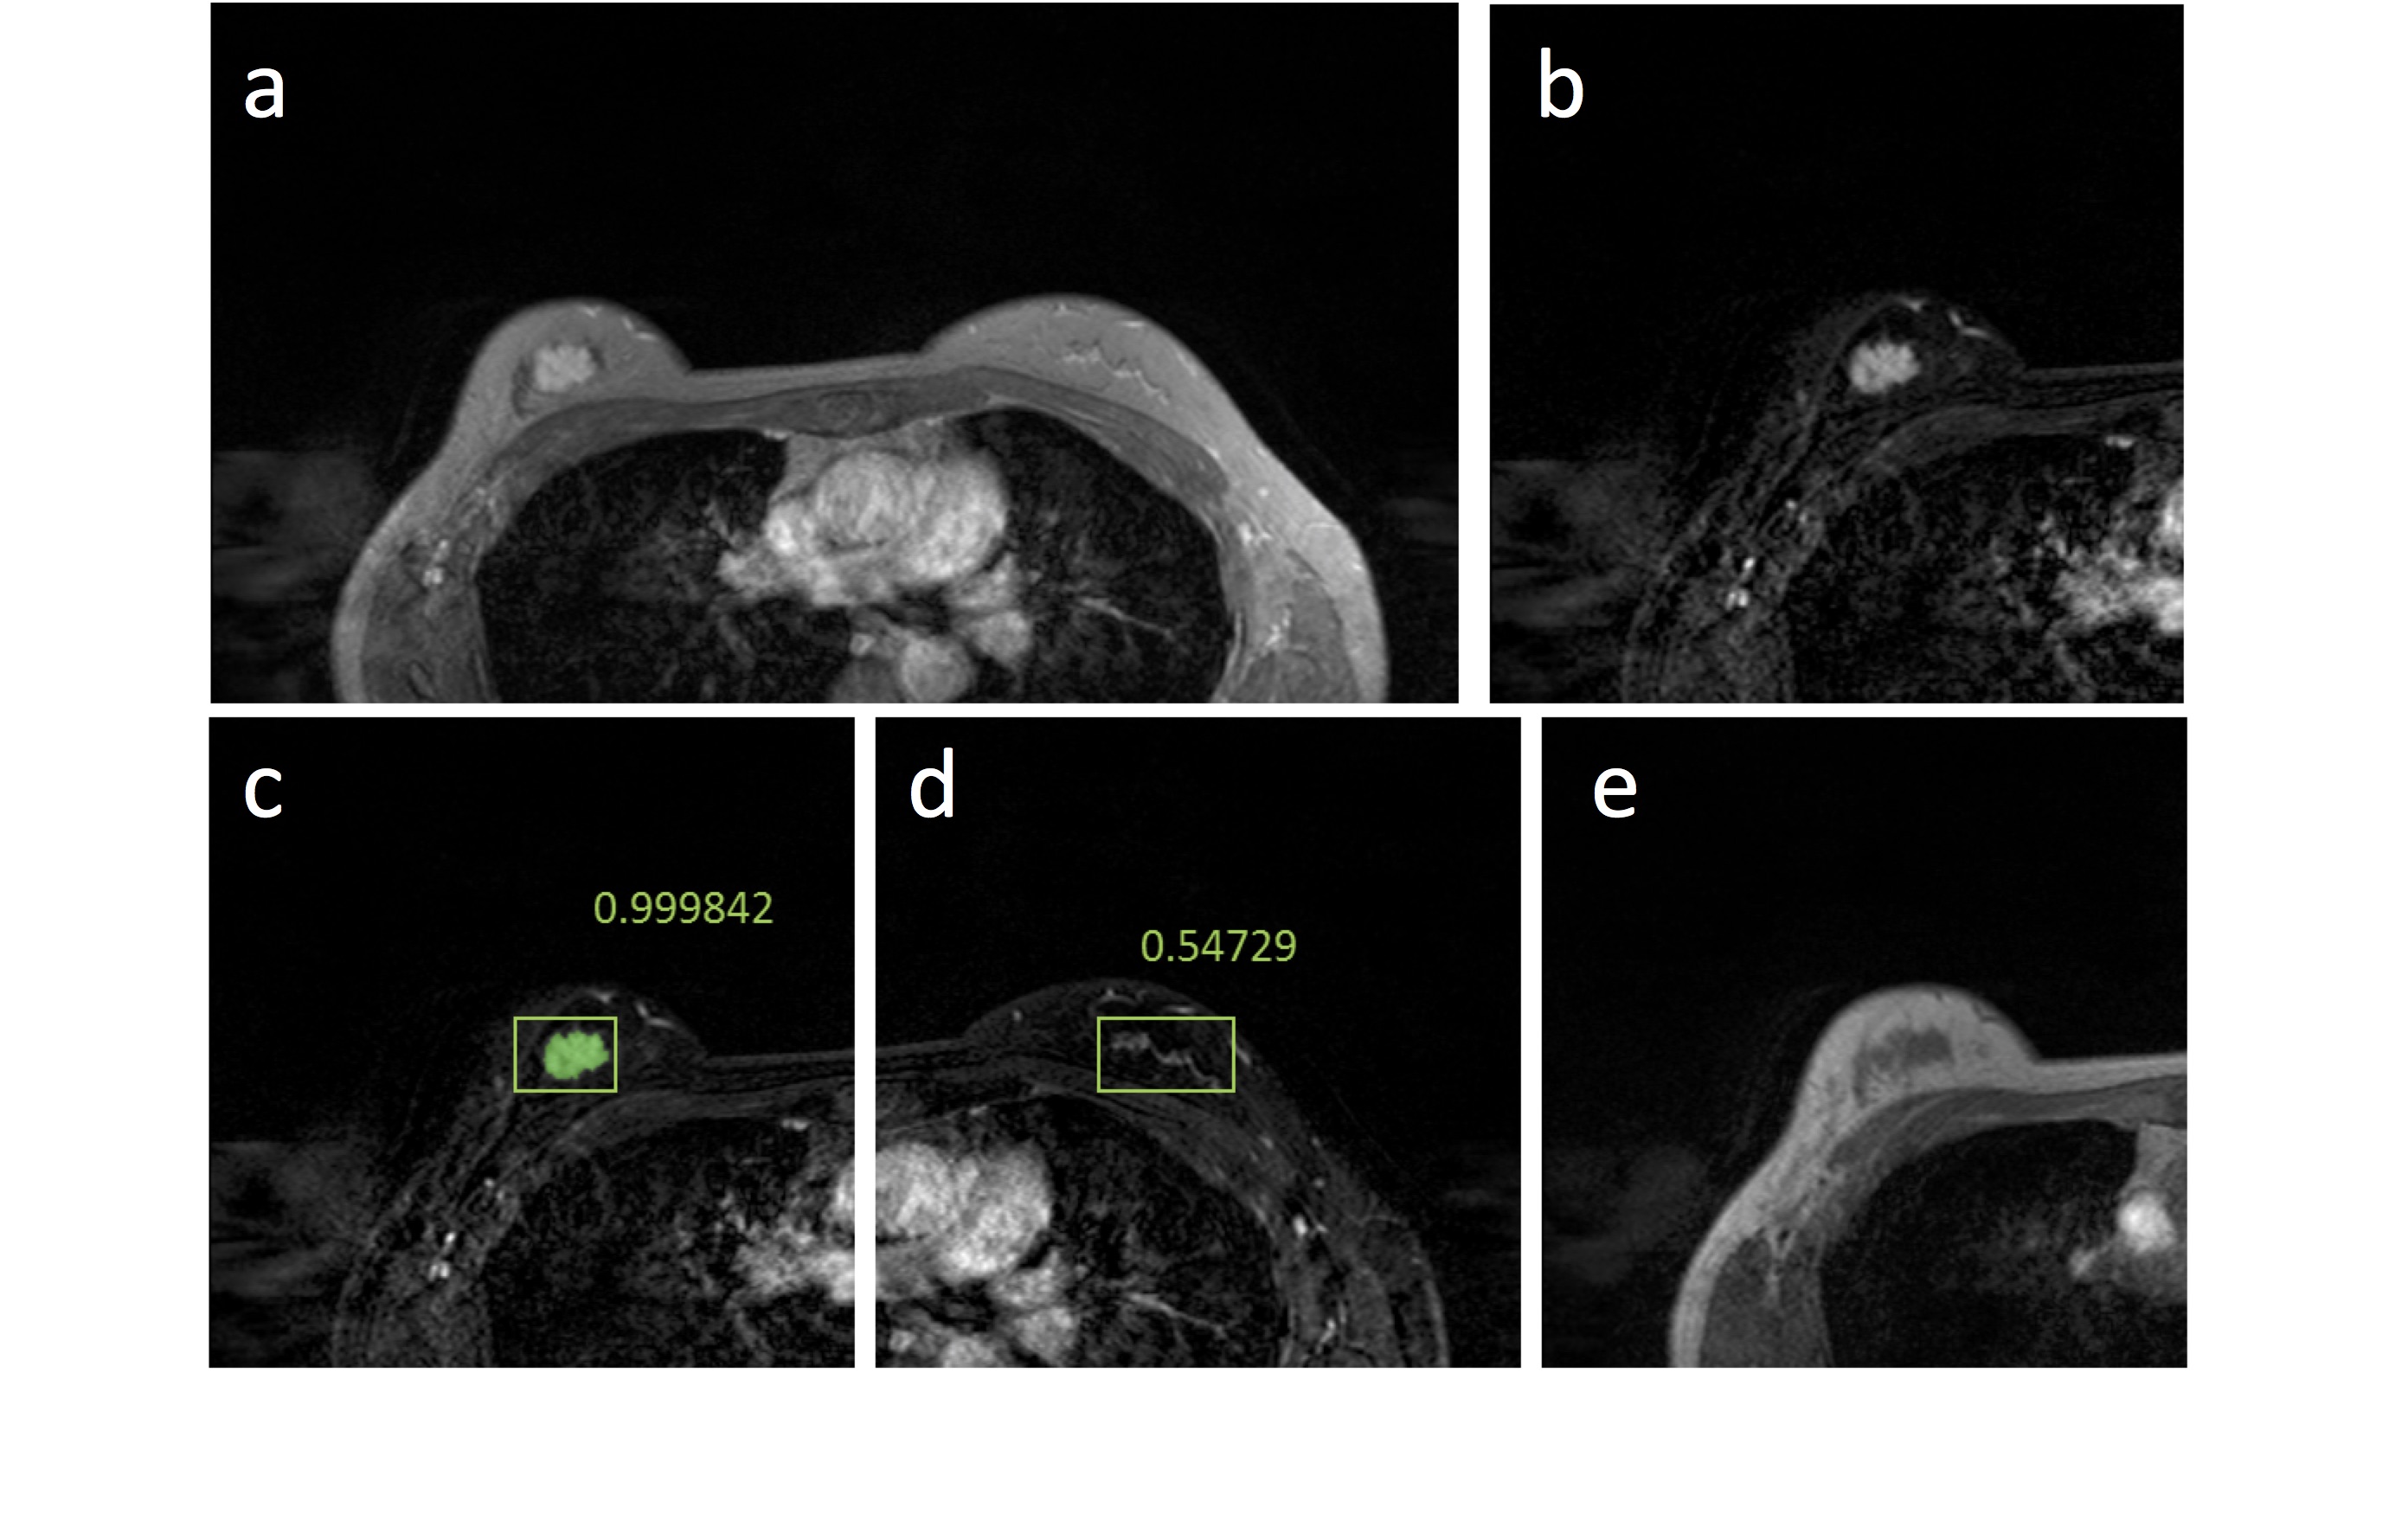
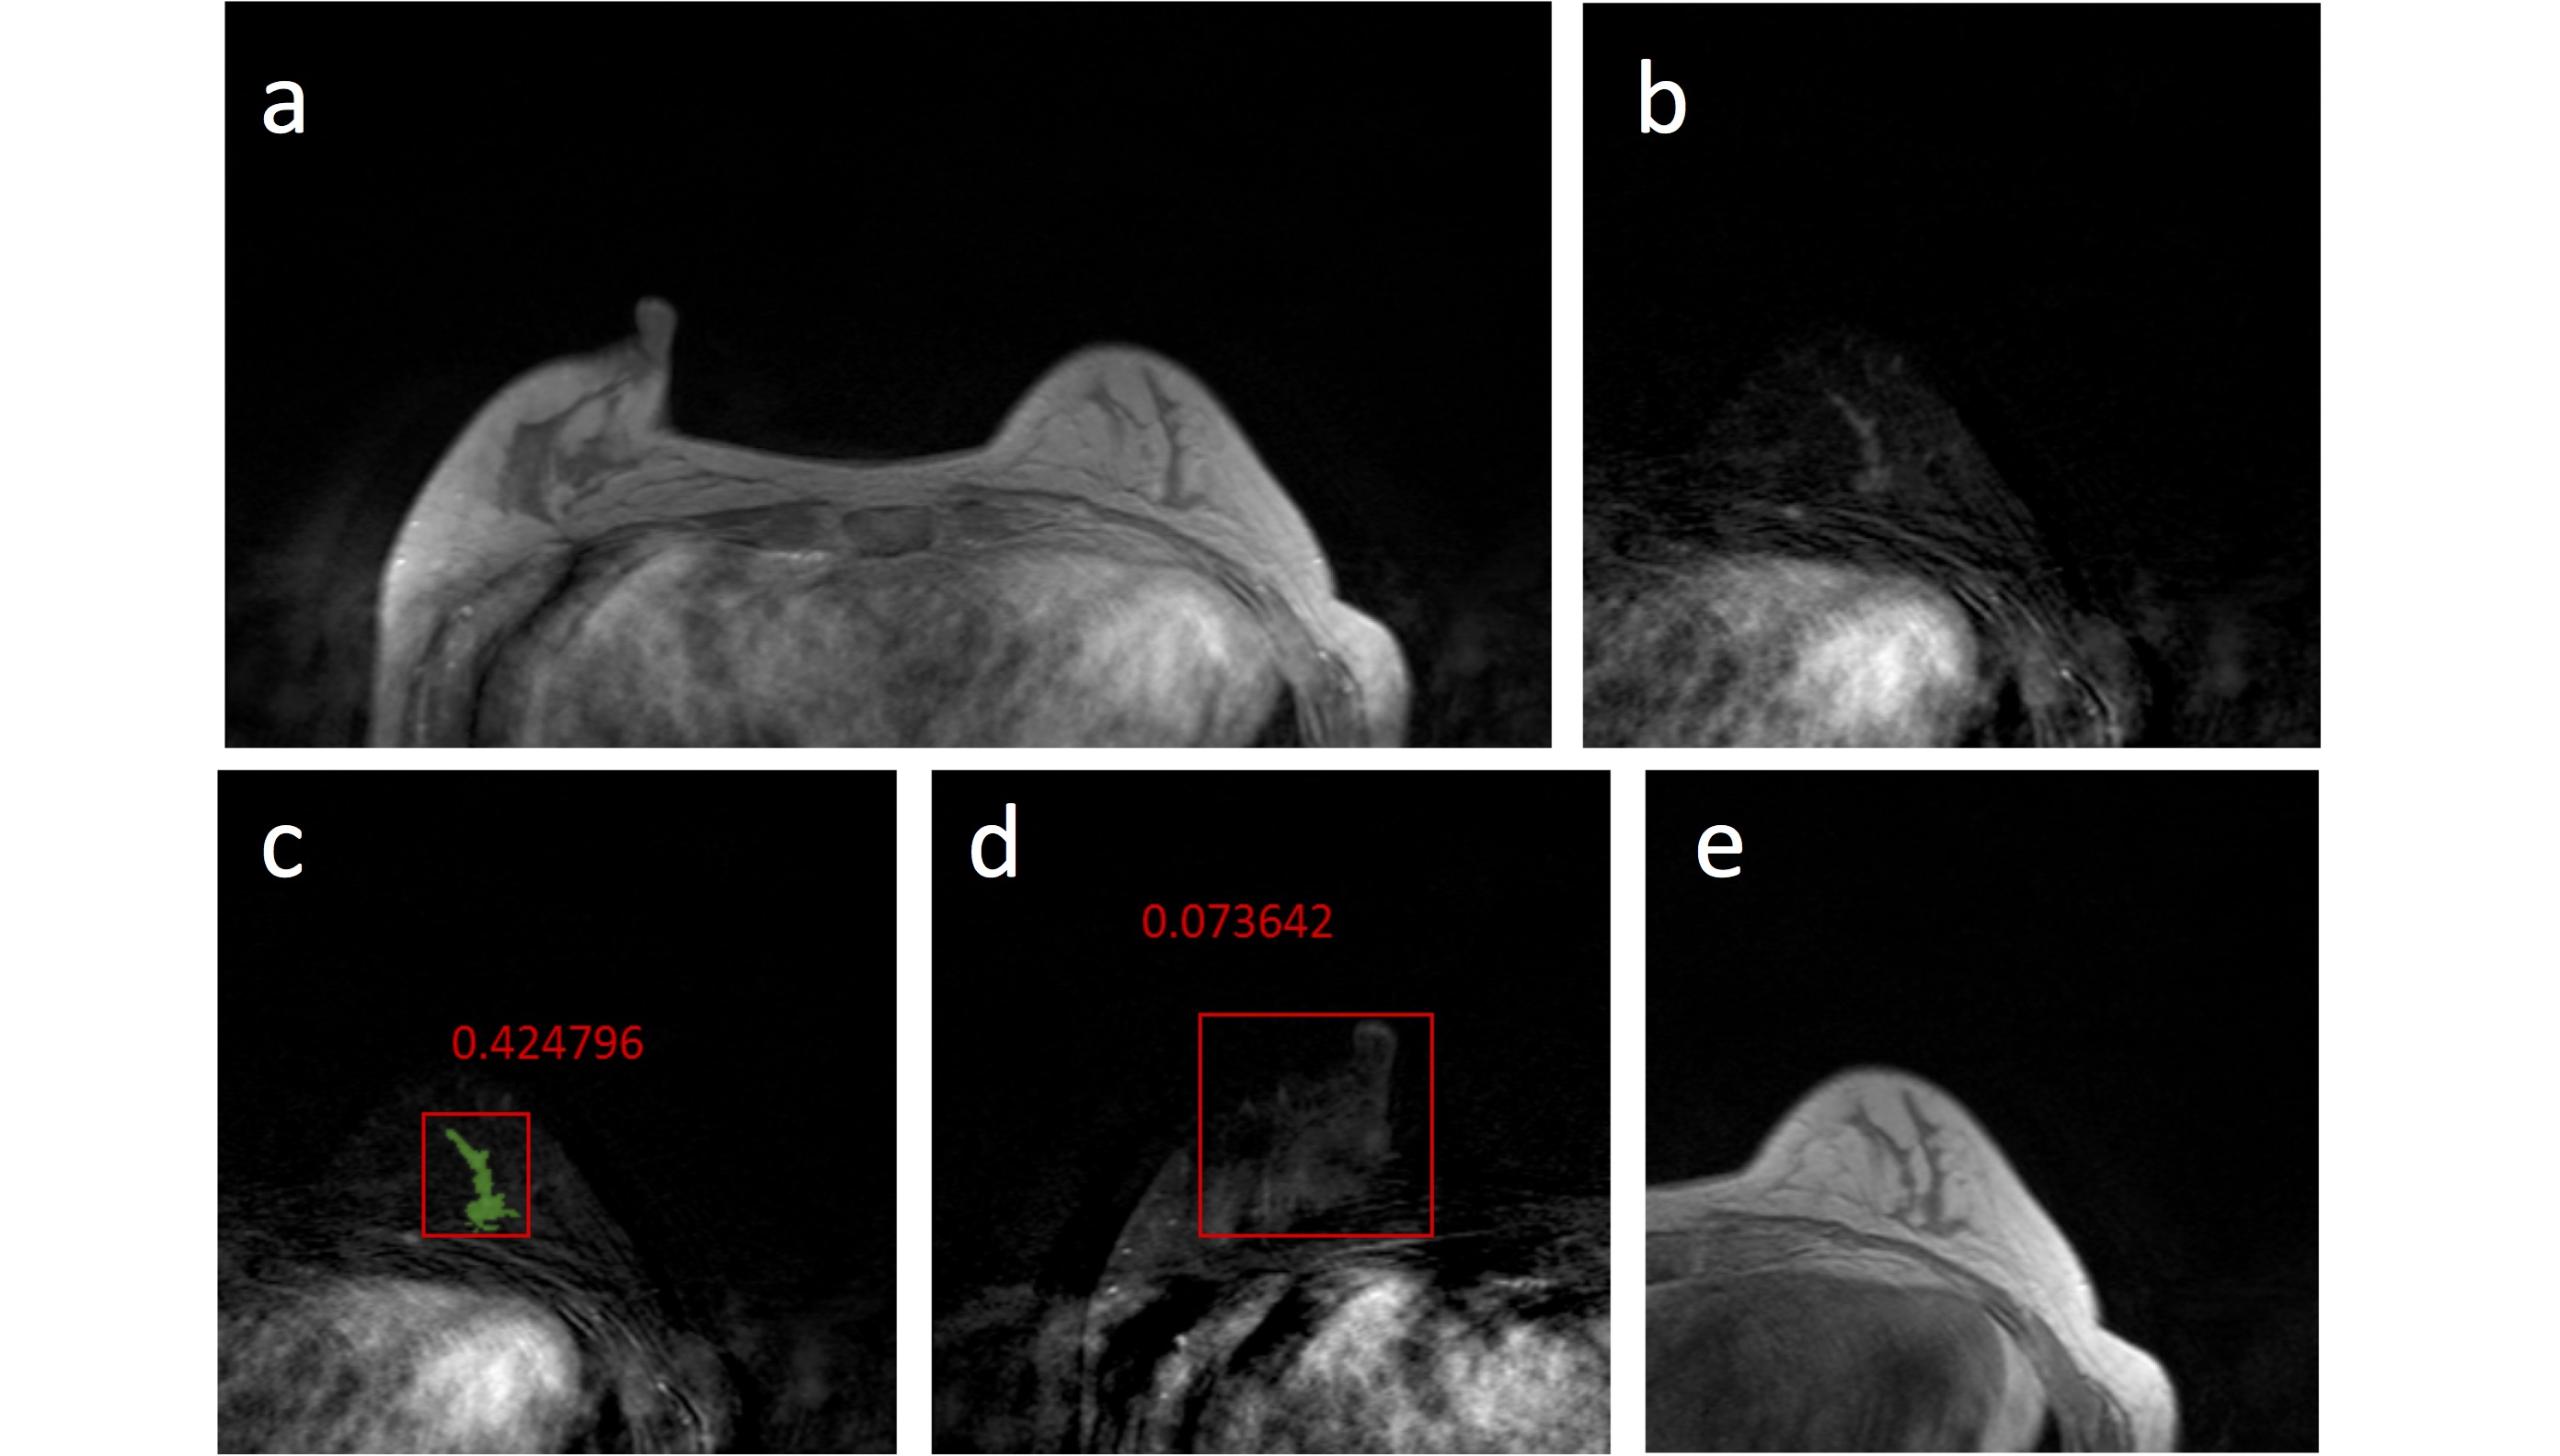
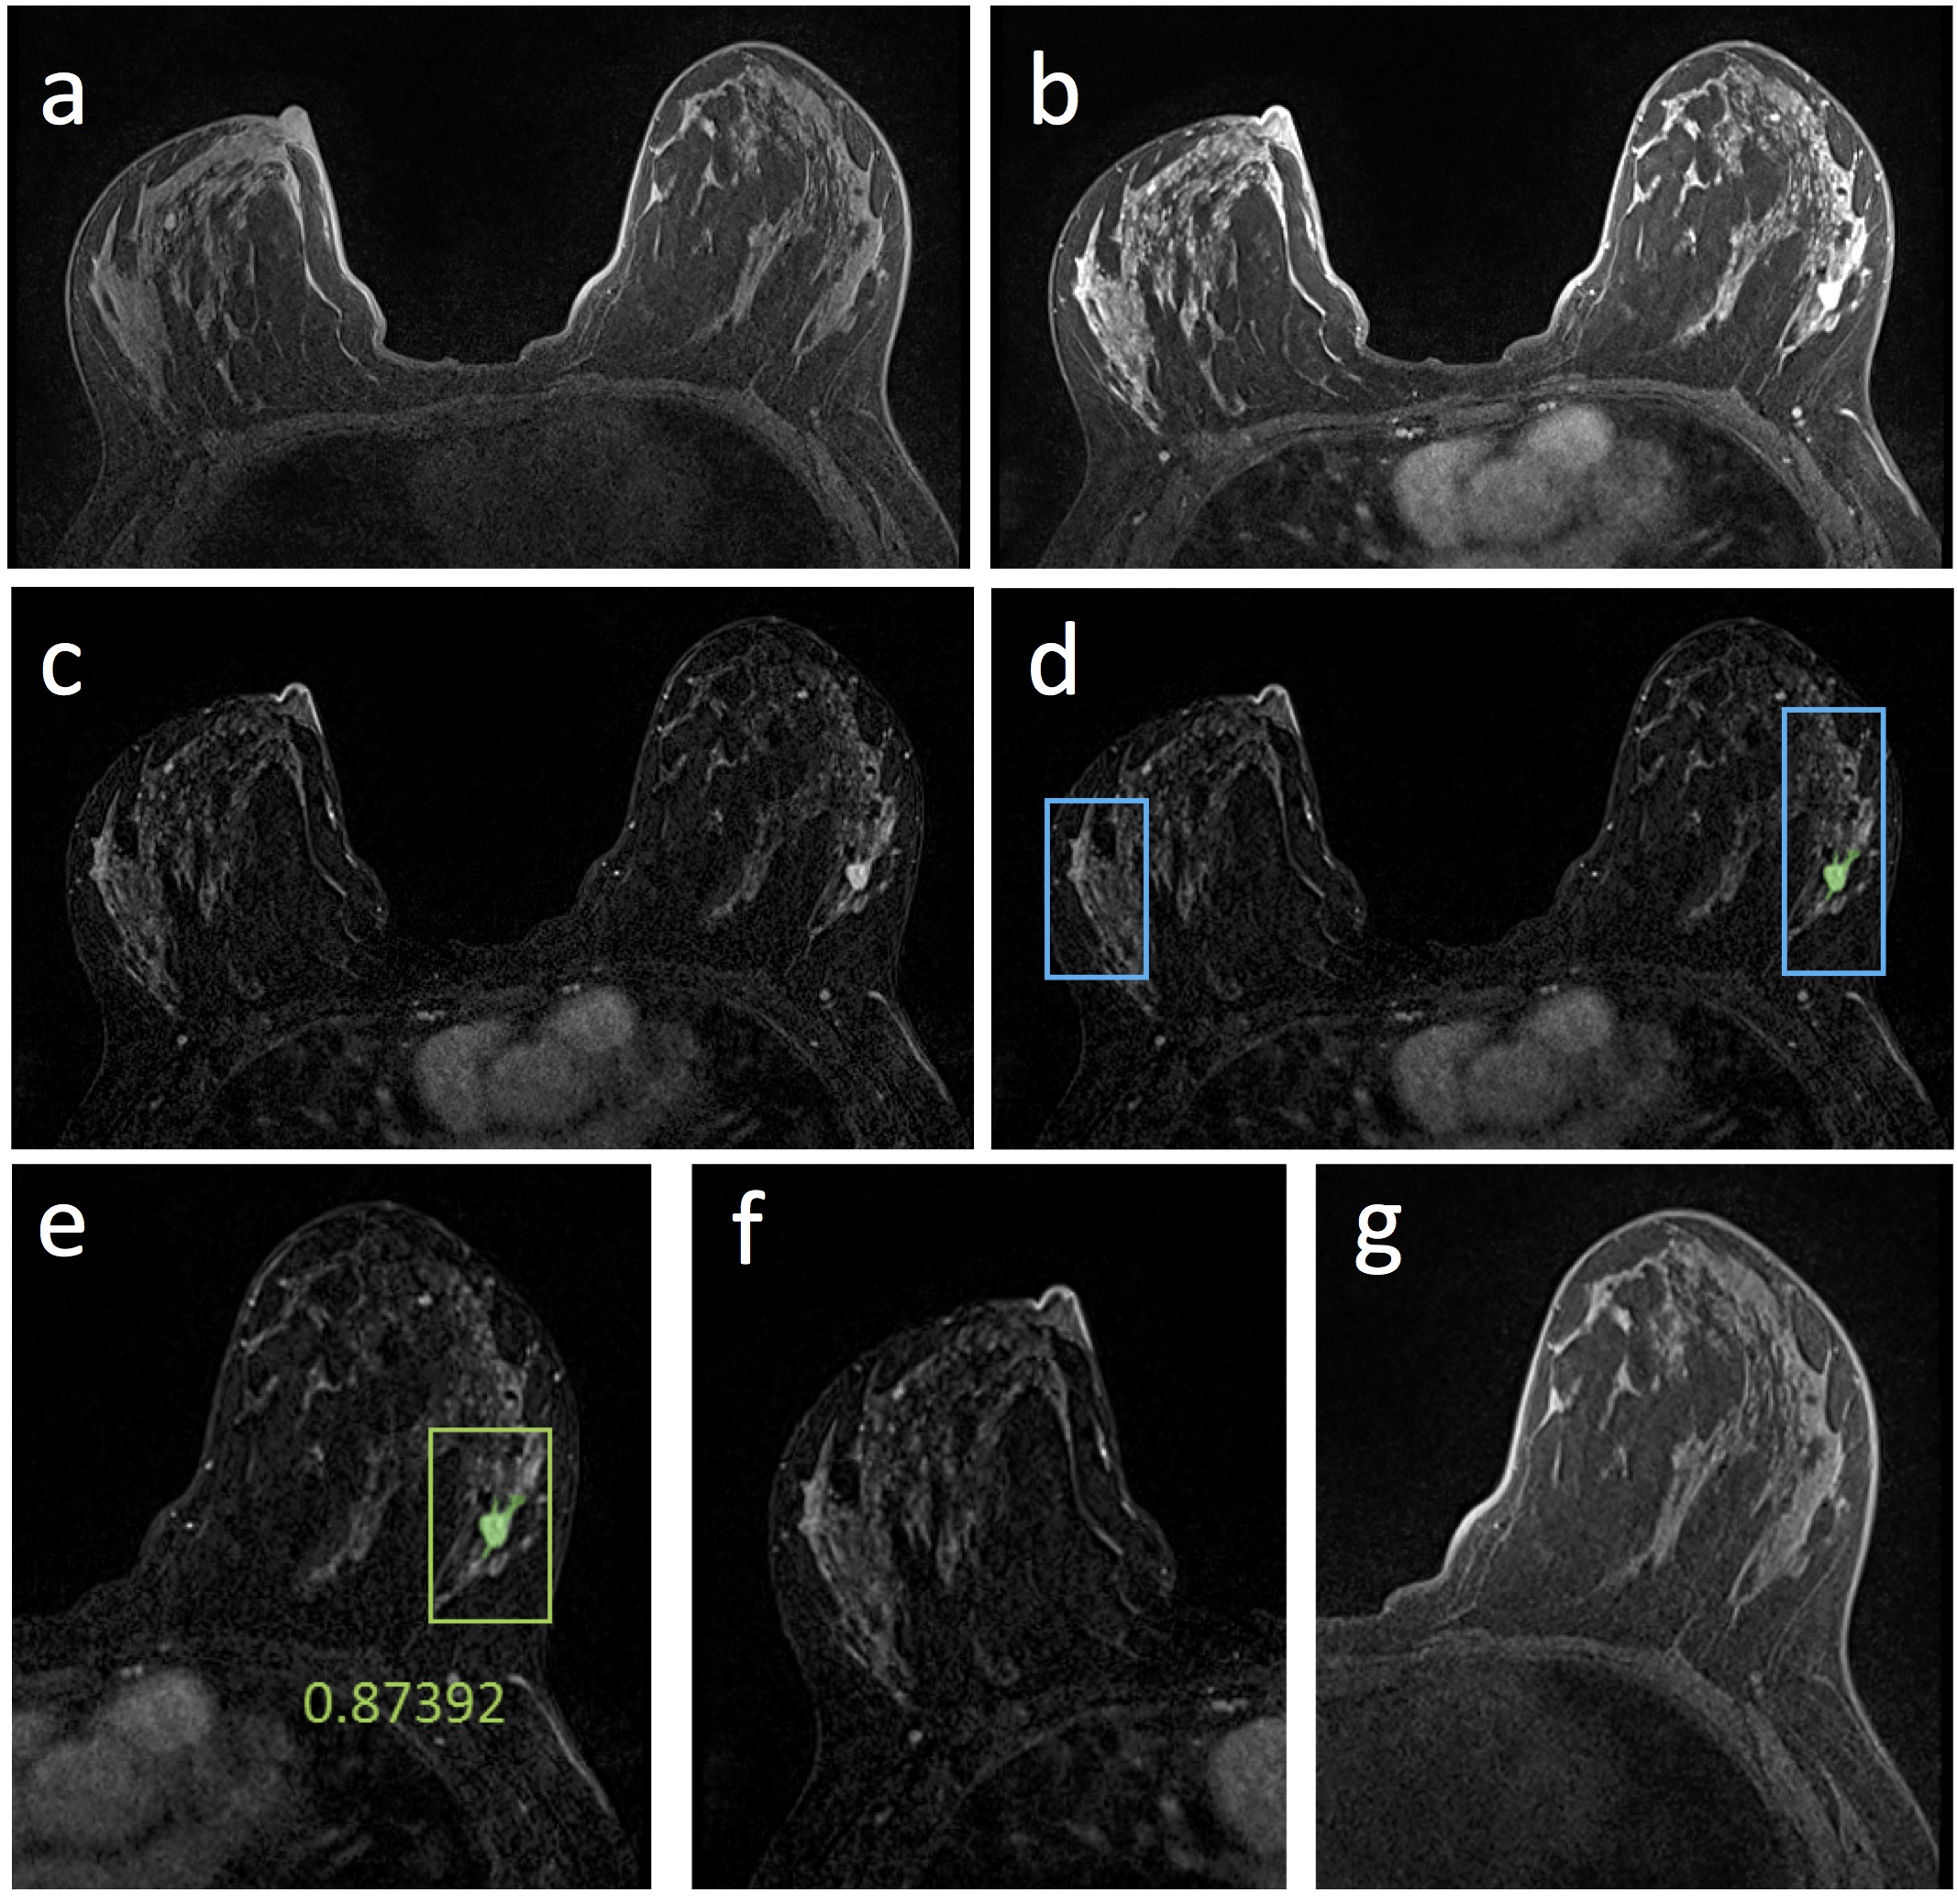
Figures 2-5 show 4 case examples, illustrating true positive and false positive results detected by the mask R-CNN as outputs. For comparison, we also mark two examples, showing false negative and true negative diagnosis, which are not from the detection output of the mask R-CNN. The 10-fold cross-validation in the training dataset yielded accuracy=0.80, sensitivity=0.87, specificity=0.79, mean DSC= 0.82. For the first testing dataset also acquired using non-fat-sat sequence, accuracy=0.73, sensitivity=0.82, specificity=0.72, mean DSC= 0.79. The performance was close to the results in the training dataset. For the second testing dataset done using fat-sat sequence, accuracy=0.62, sensitivity=0.78, specificity=0.60, mean DSC= 0.71. The worse performance in this dataset may be due to the noisier image quality and lower image contrast acquired using fat-sat sequence. The inclusion of the normal contralateral breast could eliminate wrong detection of unspecific parenchymal enhancement based on breast symmetry, as illustrated in Figure 5.Discussion
Developing an efficient and reliable lesion detection method may provide helpful information for diagnosis of lesions in breast MRI. We applied mask R-CNN, which contains Retina Network as backbone, and three sub-networks, including bounding box regression network, classification network and mask network. The Retina network can increase the sensitivity in the search of the whole image. Then the sub-networks can decrease the false positives, which increase specificity. The results showed that deep learning using mask R-CNN provided an efficient method to localize and segment the lesion on breast MRI, which achieved accuracy of 0.80 in the training and 0.73 in the first testing dataset using non-fat-sat images. But when the model was applied to fat-sat images in the second testing dataset, the accuracy was decreased to 0.62. A possible solution is to apply transfer learning, which needs to be further investigated. The current commercially available software for breast MRI analysis can generate useful information to improve reading efficiency of radiologists. Although these methods work well to assist radiologists’ interpretation, a fully automatic method that can search the entire set of images and identify suspicious lesions is needed to build automatic, artificial intelligence-based, diagnostic tools.Acknowledgements
This work was supported in part by NIH R01 CA127927 and R21 CA208938.References
1. Nie K, Chen J-H, Hon JY, Chu Y, Nalcioglu O, Su M-Y. Quantitative analysis of lesion morphology and texture features for diagnostic prediction in breast MRI. Academic radiology. 2008;15(12):1513-1525.
2. He K, Gkioxari G, Dollár P, Girshick R. Mask r-cnn. Paper presented at: Computer Vision (ICCV), 2017 IEEE International Conference on2017.
3. Lin T-Y, Goyal P, Girshick R, He K, Dollár P. Focal loss for dense object detection. IEEE transactions on pattern analysis and machine intelligence. 2018.
4. Simonyan K, Zisserman A. Very deep convolutional networks for large-scale image recognition. arXiv preprint arXiv:14091556. 2014.
Figures