2315
Diffusion-Weighted MRI-Based Quantitative Markers for Characterizing Breast Cancer Lesions Using Machine Learning1Center for Magnetic Resonance Research, University of Illinois at Chicago, Chicago, IL, United States, 2Department of Bioengineering, University of Illinois at Chicago, Chicago, IL, United States, 3The First Clinical Medical College, Zhejiang Chinese Medical University, Hangzhou, China, 4The First Affiliated Hospital of Zhejiang Chinese Medical University, Hangzhou, China, 5Departments of Radiology and Neurosurgery, University of Illinois at Chicago, Chicago, IL, United States
Synopsis
We investigate the quantitative markers obtained from the parameters of two diffusion-weighted imaging (DWI) models, continuous-time random-walk (CTRW) and intravoxel incoherent motion (IVIM) models, for differentiating malignant and benign breast lesions. The quantitative markers are extracted from the histograms of each parameter, and then the statistical importance of each marker is determined using a feature importance algorithm. Our results show the Gradient Boosted Classifier (GBC) achieves optimal performance using the top quantitative markers. The statistical histogram features from the parameters of CTRW and IVIM models can be used in a GBC to provide a new avenue in breast cancer diagnosis.
Introduction
Breast cancer is the second cause of female cancer death in the US1. An accurate characterization of breast lesions is important for efficient risk assessment and optimized treatment planning. With its sensitivity to probe underlying tissue microstructure, diffusion-weighted MRI (DWI) has been increasingly used for lesion characterization2. In the simplest mono-exponential model from which apparent diffusion coefficient is derived, the diffusion displacements in a homogeneous medium are assumed to follow a Gaussian distribution. Breast tissue, however, is highly heterogenous consisting of phenotypically and functionally distinct cell populations. Such heterogeneity is further pronounced in lesions, benign or malignant, due to hypercellularity, angiogenesis, and other factors. DWI can be performed with a wide range of b-values to probe a variety of tissue properties. For example, by utilizing relatively lower b-values, intravoxel incoherent motion (IVIM) model3 can reveal tissue cellularity and micro-vascularity through diffusion coefficient (Ddiff), pseudo-diffusion coefficient (Dperf), and perfusion fraction (f). A recently proposed high b-value non-Gaussian model, continuous-time random-walk (CTRW) model4-6, recognizes the intra-voxel diffusion heterogeneity in time and space, introducing two new parameters related to temporal (α) and spatial (β) intravoxel tissue heterogeneity and an anomalous diffusion coefficient, Dm. Irrespective of the model used to characterize the diffusion signal, the most common approach for lesion characterization is to perform a region-of-interest (ROI)-based analysis by using the mean or median value as the single feature. While simple, this approach artificially homogenizes the voxel-level functional information revealed from heterogeneous tissue. In this study, we generate statistical histograms offered by the parameters of the CTRW and IVIM; and create quantitative markers that can differentiate between benign and malignant breast lesions using a machine learning paradigm. We identify the benefits of using a multi-parametric approach for breast lesion characterization by determining the top performing quantitative markers and training various machine-learning classifiers for comparison.Methods and Materials:
DWI Acquisition and Analysis: Forty women with histologically confirmed breast lesions (16 benign, 24 malignant) underwent MRI at 3T. DWI was performed with 11 b-values (50-3000 s/mm2). The multi-b-value diffusion-weighted images were analyzed by using all b-values with the CTRW model,$$S/S_0=E_α (-(bD_m )^β) (1)$$
to produce Dm, α, and β. The images at b-values 200-800 s/mm2 were then analyzed with the IVIM model,
$$S/S_o =fe^ \left(-b(D_{diff}+D_{perf} )\right) +(1-f)e^ \left(-bD_{diff} \right) (2)$$
to produce Ddiff, Dperf, and f. The tumor region-of-interests (ROIs) were drawn by a radiologist on images with b = 50 s/mm2.
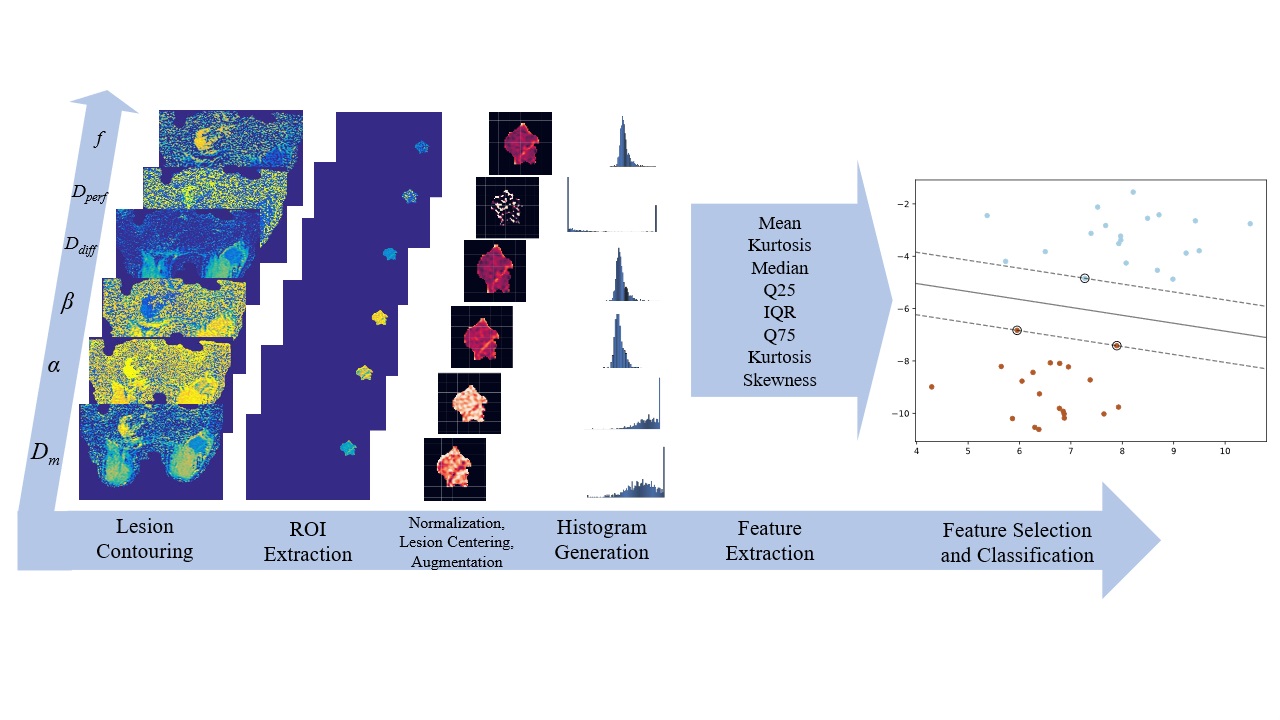
Data Processing: Data augmentation was done by generating random crops, rotations, and flips, resulting in a total of 120 tumor images for each parameter. Histograms with variable length were generated for each parameter from the ROI; and used to calculate the following quantitative markers: 10th percentile, 1st and 3rd quartile, interquartile range, median, kurtosis, mean, variance, and skewness. Feature importance was calculated following the Boruta paradigm with a two-stage multiple testing methodology process: Benjamin Hochberg FDR and Bonferroni correction to account for testing with repeated samples.
Machine-learning-based Classification: Predictive performance of the top features was evaluated using Support Vector Machines, Gaussian Processes, Decision Trees, Random Forest, Gradient Boosting (GBC), adaBoost, and Naïve Bayes. Optimization of hyperparameters including histogram bin width was performed by maximizing the receiver operating characteristic (ROC) curves during the cross-validation (CV) stage. To compare models in the testing stage we used area-under-the-curve (AUC), F1-Score, and accuracy metrics with 10000 bootstrapped samples to generate a p-value via a Mann-Whitney U-test. The data processing and classification steps are illustrated in Figure 1.
Results:
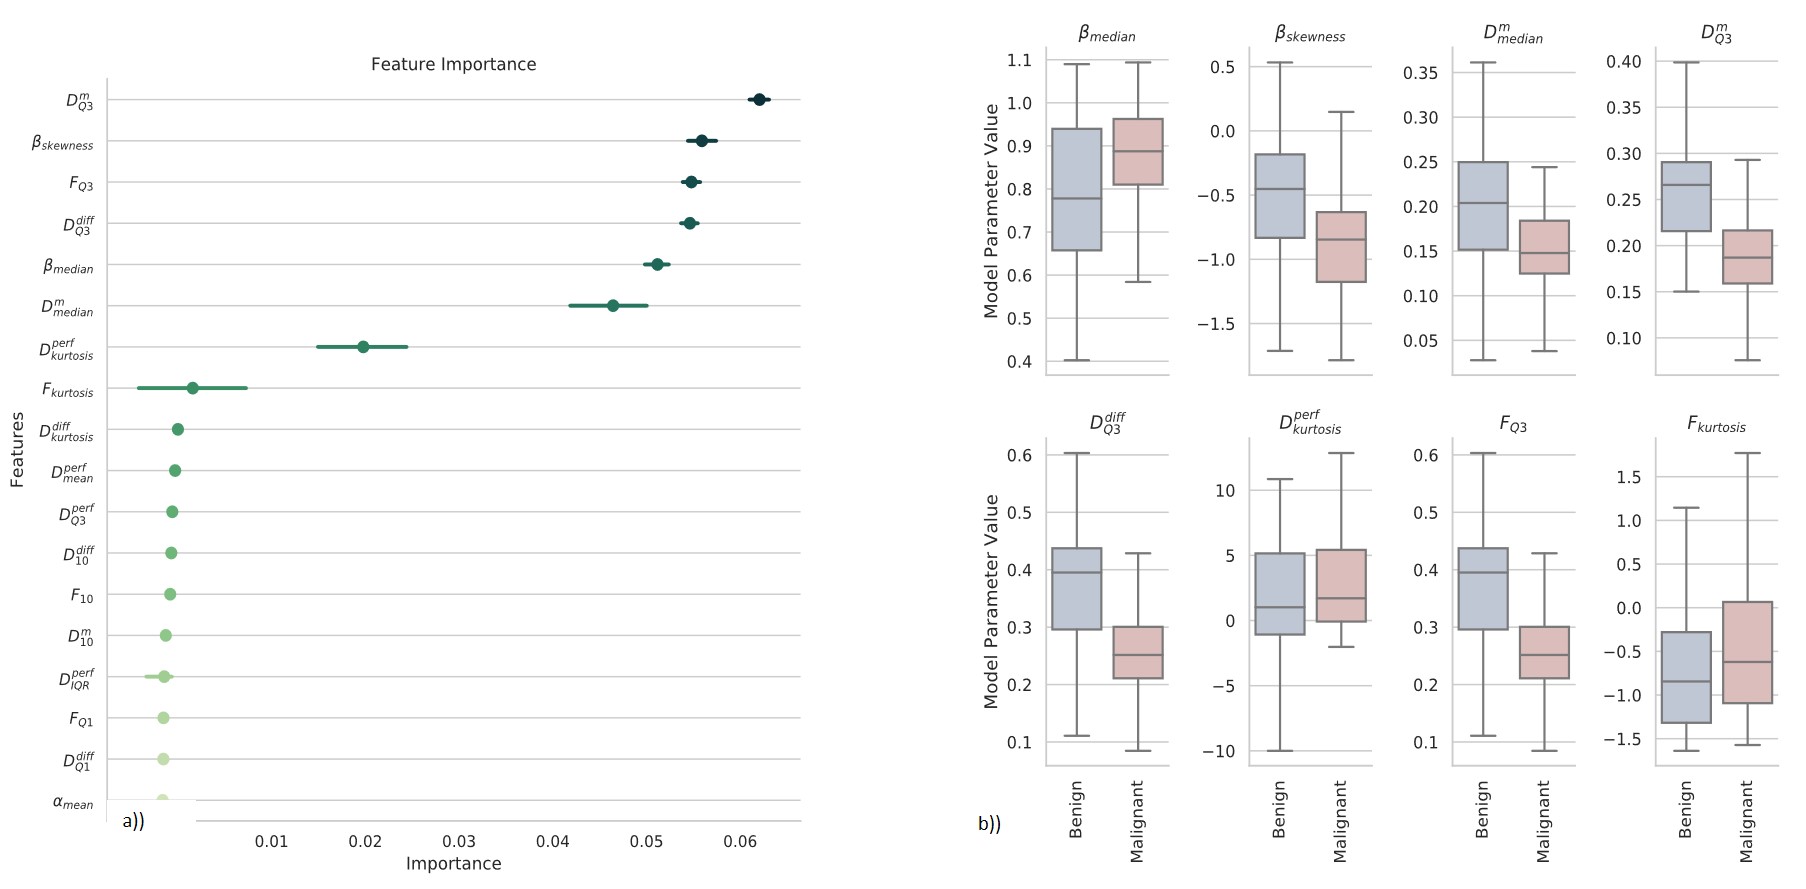
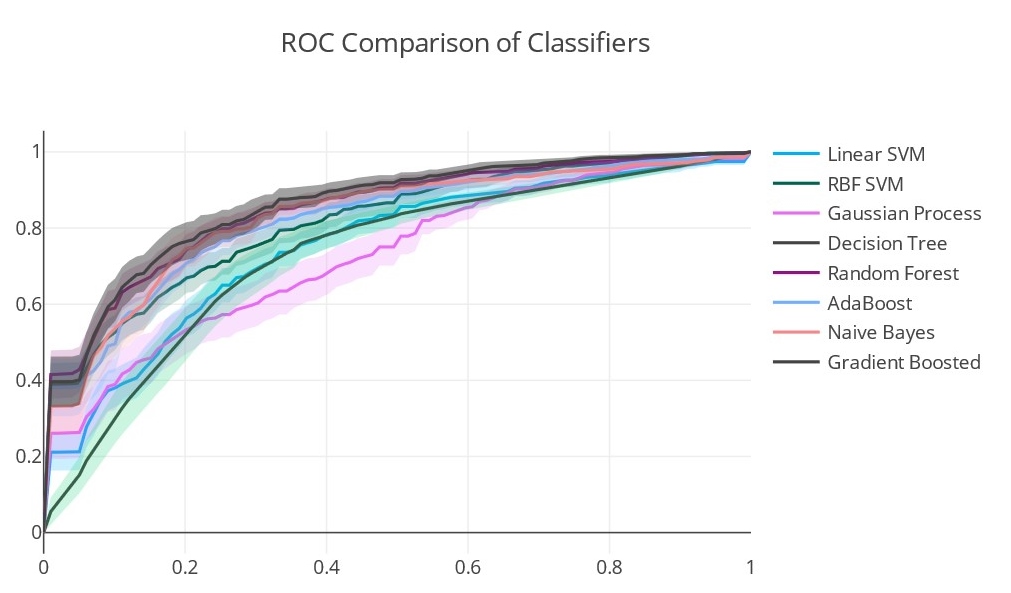
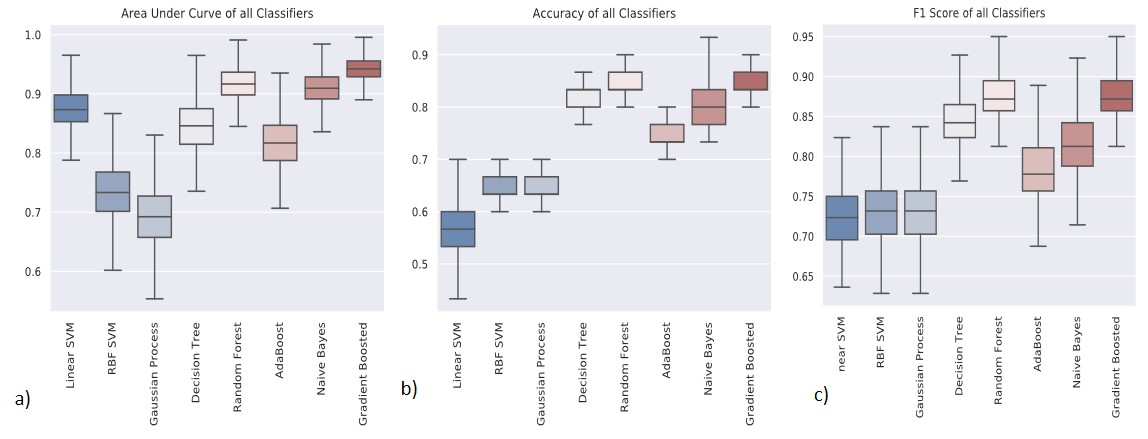
Figure 2 shows Dm, α, β, Ddiff, Dperf, and f maps from one representative malignant (left column) and benign patient (right column). The malignant lesion exhibited lower parameter values and increased variability within the ROI than the benign lesion. The assessment of the top 18 features with 95% confidence intervals of their relative importance is shown in Figure 3a. The top 8 features that carry the most weight in classification were determined as the median and skewness of β, third quartile and kurtosis of f, third quartile of Ddiff, kurtosis of Dperf, and third quartile and median of Dm. With the exception of the kurtosis of f, these top features were found to be statistically significantly different between the malignant and benign lesions as shown in Figure 3b. The comparison between the ROC curves during CV (Figure 4) shows that the GBC converges faster towards an optimal trade-off between the true positive and false positive ratio. GBC also provided the best performance during testing with the highest mean AUC of 0.942 (p<0.05) a mean accuracy of 0.833 with a 95% confidence interval of [0.8, 0.9], a mean F1 score of 0.872 with a 95% confidence interval of [0.824, 0.967] as seen in Figures 5a-5c.Discussion and Conclusion:
We have shown that a GBC can accurately differentiate malignant and benign breast lesions using a combination of quantitative markers generated from statistical histograms of CTRW and IVIM models. The comprehensive analysis of multi-parametric information provided by multiple DWI models offers an alternative way to characterize breast lesions. This approach is expected to stimulate additional clinical applications in other types of cancers.Acknowledgements
No acknowledgement found.References
[1] American Cancer Society. Cancer Facts & Figures 2017. Cancer Facts Fig 2017. 2017:1.
[2] Partridge SC, Nissan N, Rahbar H, et al. Diffusion-weighted breast MRI: Clinical applications and emerging techniques. J Magn Reson Imaging. 2017;45(2):337-355.
[3] Le Bihan D, Breton E, Lallemand D, et al. MR imaging of intravoxel incoherent motions: application to diffusion and perfusion in neurologic disorders. Radiology. 1986;161(2):401-407.
[4] Karaman MM, Sui Y, Wang H, et al. Differentiating low- and high-grade pediatric brain tumors using a continuous-time random-walk diffusion model at high b-values. Magn Reson Med. 2016;76(4):1149-1157.
[5] Zhang J, Weaver TE, Zhong Z, et al. White matter structural differences in OSA patients experiencing residual daytime sleepiness with high CPAP use: a non-Gaussian diffusion MRI study. Sleep Med. 2019;53:51-59.
[6] Zhong Z, Merkitch D, Karaman M, et al. High-Spatial-Resolution Diffusion MRI in Parkinson Disease: Lateral Asymmetry of the Substantia Nigra. Radiology. 2019;291(1):149-157.
Figures