2314
Classification of Breast Magnetic Resonance Imaging Using 3D Convolution Neural Network: A Pilot Study1Hong Kong Sanatorium and Hospital, Hong Kong, Hong Kong
Synopsis
BIRADS classification is one of the standard of reporting breast MRI. It reveals the information about the likelihood of cancer and management recommendation for the patients. In this study, we aimed to develop and evaluate a 3D convolution neural network (CNN) for breast MRI BIRADS classification. This 3D CNN network was evaluated and it achieved overall 90% classification accuracy. In particular, the network also has high sensitivity (100%) of highly suspicious of malignancy findings. The results suggested that a deep learning-based computerized tool might be useful in BIRADS-MRI classification.
Introduction
BIRADS categories provide valuable information on the likelihood of cancer and management recommendations in breast MRI, but this manual assessment procedure occupies intensive workload of radiologists. Previous study using deep learning focused more on BIRADS mammogram classification for breast cancer screening [1]. In breast MRI, discrimination of malignant and benign breast tumors using deep learning was also reported [2]. However, BIRADS MRI classification was rarely explored. In this study, we aimed to develop and evaluate a 3D convolutional neural network (CNN) for breast MRI BIRADS classification.Methods
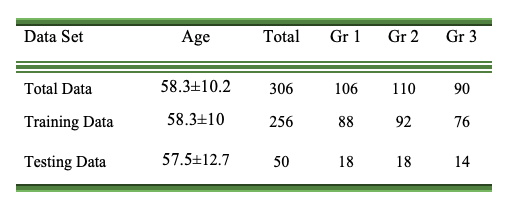
153 breast cancer suspicious females (mean:58.3±10.2 years old, range:41-96 years old) who underwent breast DCE-MRI (fat-saturated gradient echo sequence, pixel size = 0.74 x 0.74 mm2, flip angle = 200, TE/TR = 3.27/7.3ms, and slice thickness = 3 mm) at 3T were retrospectively analyzed. BIRADS scores (1 to 5) given per breast (N=143x2=286) by four radiologists (all with 10+ years of experience) were used as reference.The BIRADS scores were re-categorized into Group 1 (including BIRADS 1: negative; BIRADS 2: benign; <2% malignant likelihood), Group 2, (including BIRADS 3: probably benign; BIRADS 4: suspicious; 2%-95% malignant likelihood), and Group 3 (BIRADS 5: highly suggestive of malignancy; >95% malignant likelihood). First post-contrast DCE images were cropped into left and right breast, and then resized to 75x65x48 by linear interpolation. Paired-breast image sets were divided into training data (n=256) and testing data (n=30). 10-fold stratified cross validation was conducted. The distribution of the breast images was shown in Table 1.
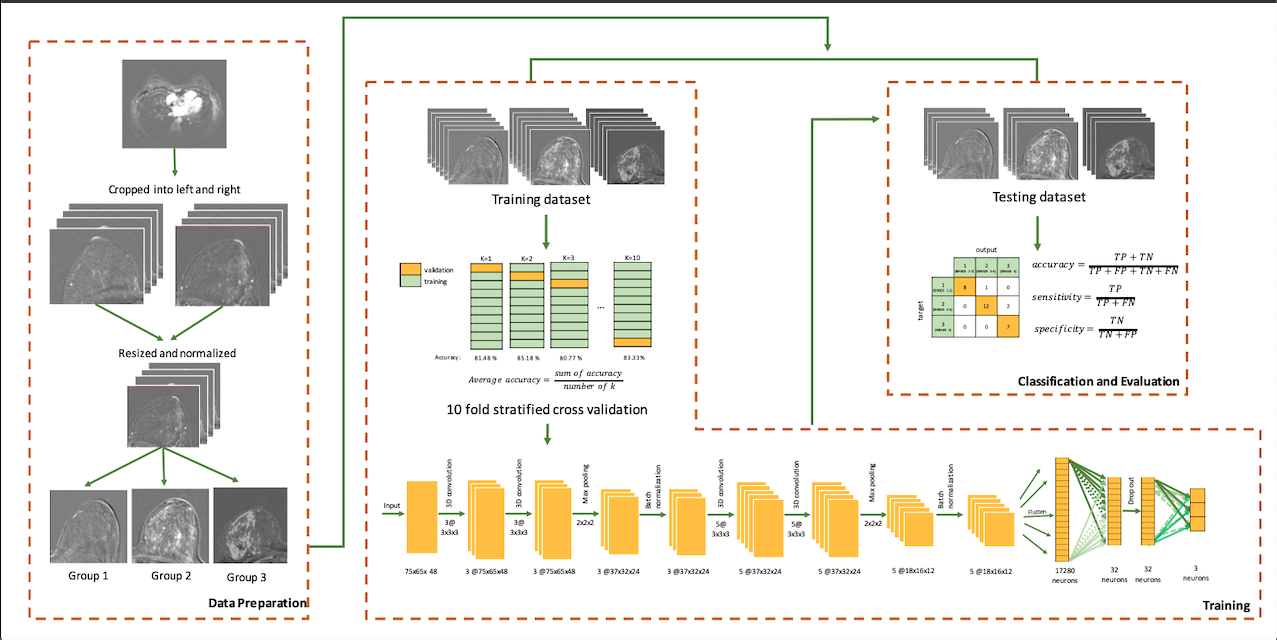
The networks were constructed with 13 layers, which included 1 input layer, 4 convolutional layers, 2 max pooling layers, 2 batch normalization layers, 1 flattened layer, 1 dropout layer, and 2 fully-connected layers where the last fully-connected layer acted as output layer. The first two convolutional layers used (ReLU) activation function and had 3 filters with size 3x3x3 and the second two convolutional layers had 5 filters with size 3x3x3. It also used L2 regularization with regularization parameter = 0.01. The first fully connected layers contained 32 neurons, and used 20% drop out scheme to avoid overfitting. The second fully connected layers consisted of 3 neurons, corresponding to the three groups to be classified. He initialization [3] was used as the weight initialization. The number of batch and epoch used were 16 and 100 respectively. Adadelta optimizer was also adopted for parameter tuning. Accuracy, sensitivity and specificity of the network were calculated to evaluate the 3D CNN. The overall workflow of this pilot study is shown in figure 1.
Results
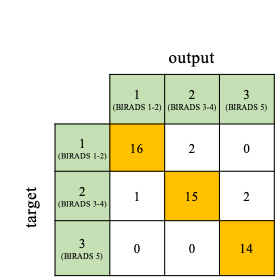
10-fold stratified cross validation used to examine the network resulted into an average accuracy of 84.4% with each fold accuracy as follow 81.48%, 85.18%, 80.77%, 84.61%, 84.61%, 88.46%, 84%, 84%, 87.5%, and 83.33%.The network achieved a total accuracy of 90% in classifying 30 testing breasts into 3 groups. The network had 100% sensitivity in BIRADS 5 classification, while 88.9% and 83.3% sensitivity in Group 1 and 2 consecutively. The specificity of classification of Group 1, Group 2, and Group 3 were 96.9%, 93.75%, and 94.4% consecutively. The confusion matrix was shown in figure 2.
Discussion
This 3D CNN network utilized the first post-contrast DCE images, which was known crucial in indicating the aggressiveness of breast tumor [4], and achieved overall 90% classification accuracy. In particular, the network also has high sensitivity (100%) of highly suspicious of malignancy findings, independent of many image descriptors. This would be valuable in breast cancer diagnosis and screening. However, the network slightly over-rated group 1 and group 2, and might lead to more biopsy if used in clinics. It is worth noting that giving BIRADS 1or 2 depends much on whether the radiologist choose to report benign findings or not. It was the rationale of re-categorization of group 1 in this study. Accurate differentiation between BIRADS 3 and 4 is still difficult, probably due to the broad malignant likelihood of 2%-95% and the highly heterogeneous images.As a pilot study, relatively small data size is a major limitation. The relationship between classification and BIRADS-MRI descriptors was unclear, and yet to be further studied. Future works on multi-input 3D CNN network using all DCE-MRI dynamics, DWI, T2W and PET data, is warranted for better BIRADS-MRI classification.
Conclusion
The results suggested that a deep learning-based computerized tool might be useful in BIRADS-MRI classification.Acknowledgements
No acknowledgement found.References
[1] Mohamed, Aly A et al. “A deep learning method for classifying mammographic breast density categories.” Medical physics vol. 45,1 (2018): 314-321. doi:10.1002/mp.12683
[2] Parekh VS, Macura KJ, Harvey S, et al. Multiparametric deep learning tissue signatures for a radiological biomarker of breast cancer: preliminary results. arXiv:180208200. 2018:1–23.
[3] He, K., Zhang, X., Ren, S., Sun, J.: Delving deep into rectifiers: Surpassing human-level performance on imagenet classification (2015), arXiv:1502.01852
[4] Fernandez-Guinea O., Andicoechea A., Gonzalez L.O., Gonzalez-Reyes S., Merino A.M., Hernandez L.C., Lopez-Muniz A., Garcia-Pravia P., Vizoso F.J. Relationship between morphological features and kinetic patterns of enhancement of the dynamic breast magnetic resonance imaging and clinicopathological and biological factors in invasive breast cancer. BMC Cancer. 2010;10:8.
Figures