2309
Free breathing 1H MRI Specific Ventilation: Sensitivity to Bronchodilator and Airway Dysfunction in Severe Asthma1Department of Radiation Oncology, Stanford University School of Medicine, Stanford, CA, United States, 2Imaging Research Centre, St. Joseph’s Healthcare Hamilton, Hamilton, ON, Canada, 3Firestone Institute for Respiratory Health, St. Joseph's Healthcare Hamilton, Hamilton, ON, Canada, 4Department of Electrical and Computer Engineering, McMaster University, Hamilton, ON, Canada, 5Department of Medicine, McMaster University, Hamilton, ON, Canada
Synopsis
Free-breathing 1H MRI–derived specific ventilation (SV) provides a way to visualize regional ventilation, which has been shown to be reduced in asthmatics compared to healthy volunteers. We hypothesized that free breathing MRI–derived SV in severe asthmatics would be sensitive to airway bronchodilation and airway dysfunction, and hence our objective was to measure SV using 1H MRI in healthy volunteers and severe asthmatics pre- and post-bronchodilator and to evaluate the relationship with airway oscillometry measurements. Preliminary results in severe-asthmatics showed that free-breathing 1H MRI–derived SV is sensitive to bronchodilator therapy and may reflect regional small airway pathology.
Introduction
Asthma is a chronic disease that is characterized by smooth muscle dysfunction and inflammation that may affect the large and/or small airways. It is commonly diagnosed and monitored using spirometry – a simple and inexpensive measurement of airflow obstruction that is made at the mouth. Spirometry measurements are limited as they do not provide regional information and are insensitive to changes in small airway pathology that may be relevant to better manage patients with severe asthma. 1H MRI specific-ventilation (SV) maps, derived from a free-breathing acquisition, have been proposed as a way to evaluate regional pulmonary SV without exogenous contrast by evaluating the change in 1H signal intensity at different lung volumes.1 In asthmatics, free-breathing 1H MRI–derived SV was previously shown to be reduced compared to healthy volunteers, and was spatially related to ventilation defects visualized by inhaled hyperpolarized gas MRI.1 Here, our objective was to measure SV using 1H MRI in healthy volunteers and patients with severe asthma pre- and post-bronchodilator and to evaluate the relationship with airway oscillometry measurements of small and large airway dysfunction.2 We hypothesized that free-breathing 1H MRI–derived SV in patients with severe asthma would be sensitive to airway bronchodilation and dysfunction.Methods
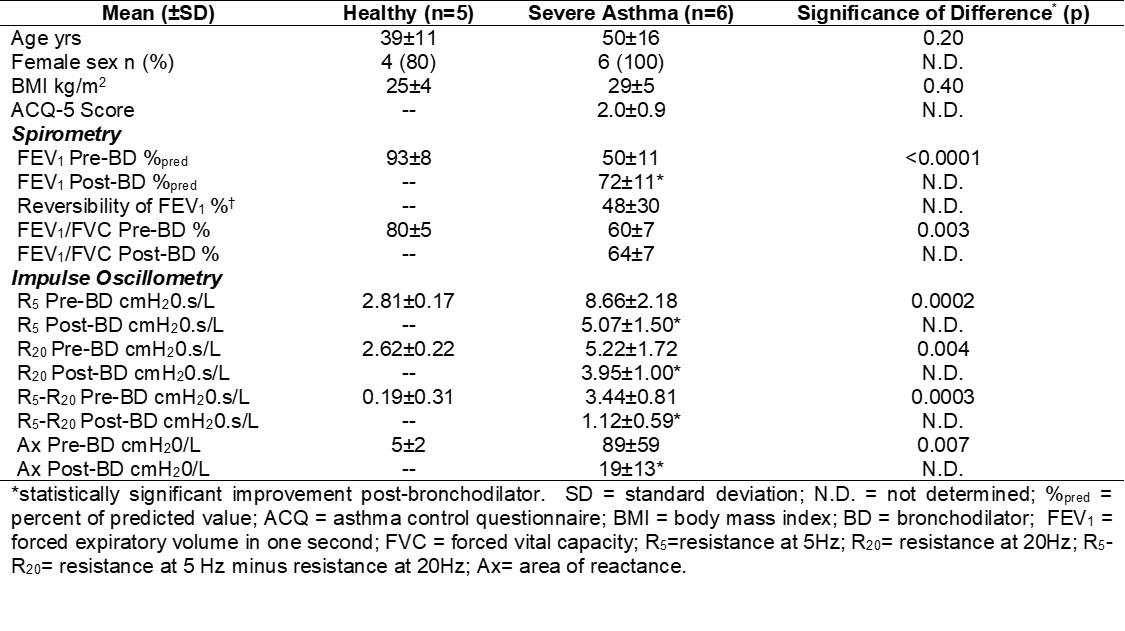
Subjects: Six severe asthmatics and five healthy volunteers (Table 1) provided written informed consent and underwent free-breathing 1H MRI as well as spirometry and impulse oscillometry during a single study visit. Patients with asthma performed all assessments pre- and post-bronchodilator inhalation (four 100μg doses of salbutamol).Image Acquisition and Analysis: MRI was acquired in the coronal-plane on a whole-body 3.0 Tesla Discovery MR750 (General Electric Healthcare (GEHC), Milwaukee USA). Free-breathing 1H MRI was acquired in the posterior-to-anterior direction, for whole-lung coverage, using a 32-channel torso-coil (GEHC), with respiratory bellows to monitor respiratory rate, and an optimized balanced-steady-state-free-precession (bSSFP) sequence (total acquisition time=128s; TR/TE/flip angle=1.9ms/0.6ms/15°; FOV=40×40cm2; rBW=250kHz; matrix=256×256; 10 slices; slice thickness=15mm; number of excitations (NEX)=1; number of temporal phases=51, no gap). Image analysis was performed using Matlab R2019a (Mathworks, Natick USA). Briefly, multi-slice free-breathing 1H MRI and respiratory bellows data were entered into the pipeline as inputs, as previously described.1 All images were then co-registered, using an optical-flow deformable-registration method,3 to a single-phase point halfway between the tidal inspiration and expiration volumes, via compounding these deformation fields. Using the registered tidal inspiration and expiration volumes, specific ventilation (SV) maps on a voxel-by-voxel basis were determined via:
(1) $$SV\approx\frac{SIexp - SIinsp}{SIinsp}$$
where $$${SIinsp}$$$ and $$${SIexp}$$$ are the MR signal-intensities at inspiration and expiration, respectively.4 The reference phase used to register the interpolated dataset was segmented using a multi-regional segmentation approach.5 A single observer with seven years segmentation experience placed seeds on the background, left-lung, and right-lung. The probability distribution of signal intensities was generated using these seeds, where the distributions were used to generate the cost for assigning a corresponding label to a voxel. A primal-dual optimization technique was implemented to solve the convex segmentation optimization problem, resulting in the segmented lung. The mean SV measurement for the whole lung was determined.
Statistical Analysis: Unpaired t-tests and Mann-Whitney U-tests were performed to compare measurements in healthy volunteers and patients with severe asthma. Paired t-tests and Wilcoxon matched-pairs signed rank tests were performed to compare measurements acquired pre and post-bronchodilator. Univariate relationships were evaluated using Pearson and Spearman correlation coefficients. Statistics were performed using GraphPad Prism version 8.1.1 (La Jolla, USA).
Results
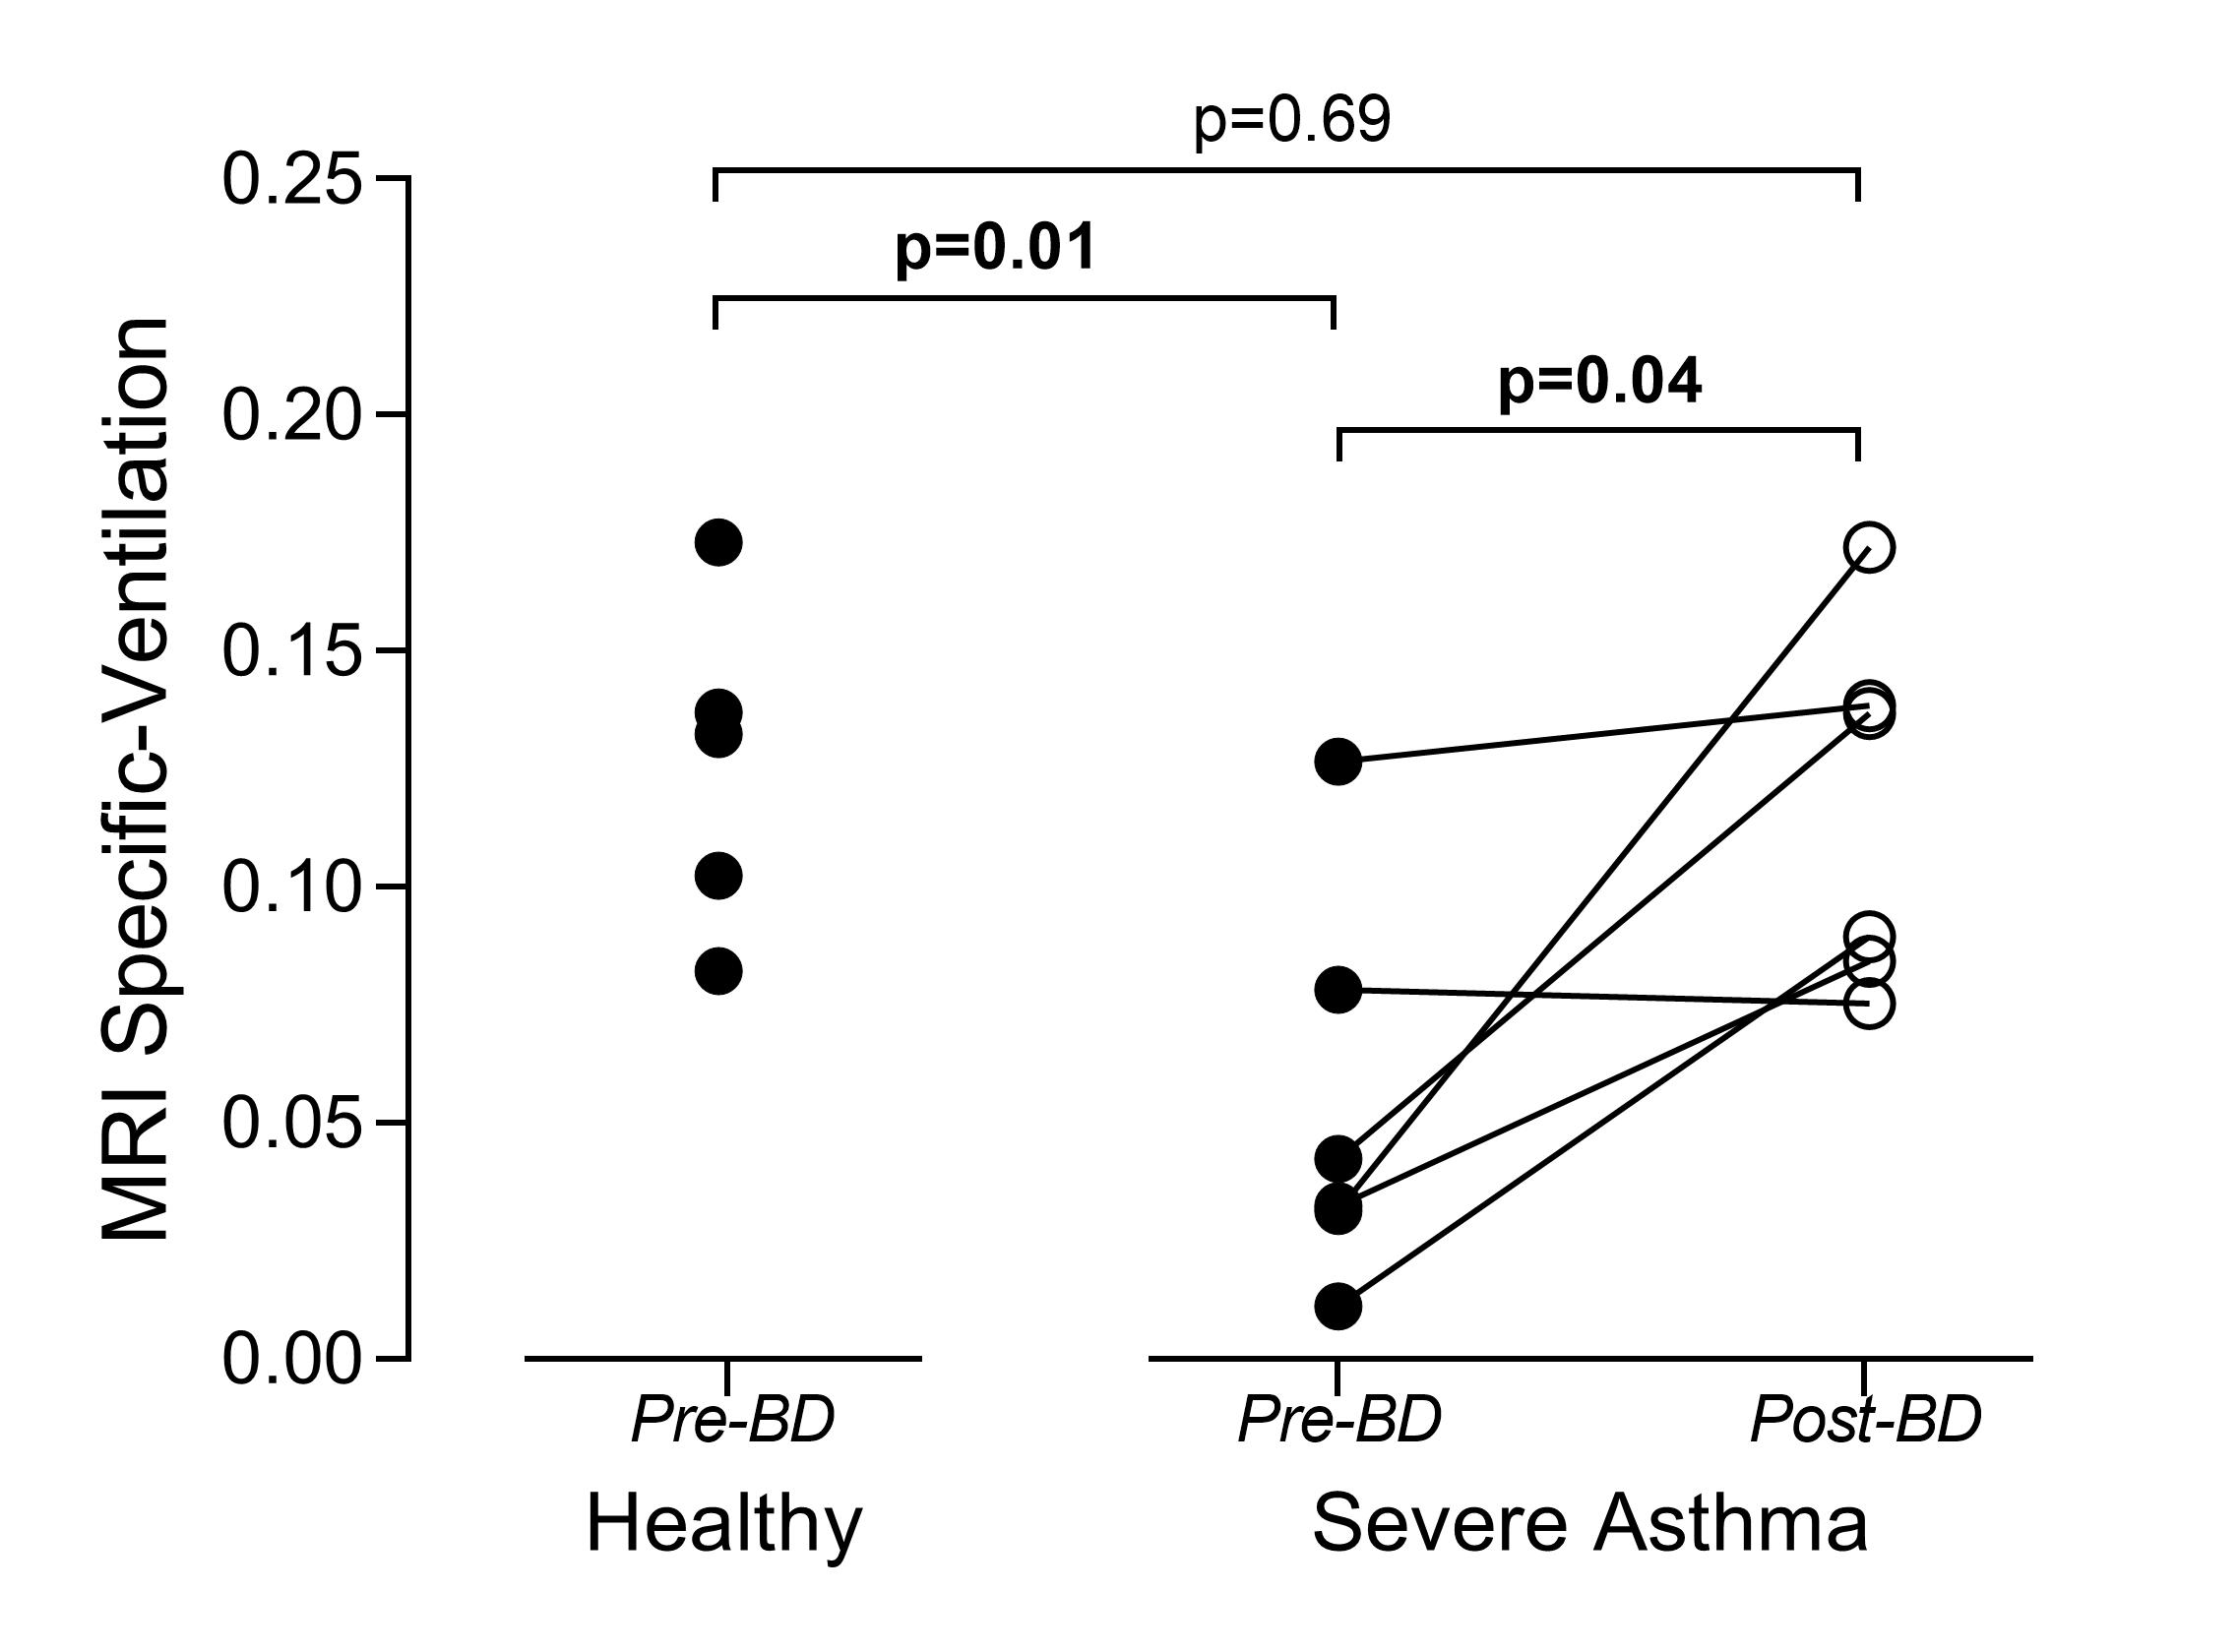
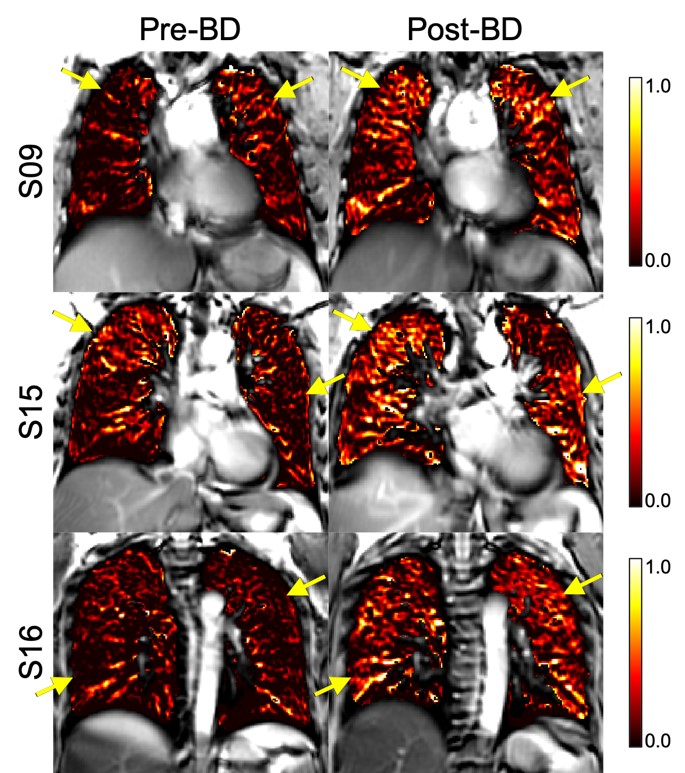
Table 1 summarizes patient characteristics, spirometry, and oscillometry measurements for six severe asthmatics and five healthy volunteers who completed free-breathing 1H MRI such that SV could be derived. Figure 1 summarizes free-breathing 1H MRI–derived SV for healthy volunteers and severe asthmatics. Prior to bronchodilator inhalation, MRI SV was significantly greater in healthy volunteers (0.13±0.03) than in patients with severe asthma (0.05±0.04, p=0.01). MRI SV was significantly improved in patients with severe asthma following bronchodilator inhalation (mean change of 0.06±0.05, p=0.04) such that MRI SV was no longer different from healthy volunteers (p=0.69). Figure 2 shows pre- and post-bronchodilator MRI SV maps for three representative asthmatics and yellow arrows highlight focal changes in SV following bronchodilator. As shown in Table 1, spirometry and oscillometry measurements were also improved following bronchodilator inhalation. For all participants, MRI SV was significantly correlated with oscillometry measurements of small airway dysfunction (R5-R20: r=-0.77, p=0.005, Ax: r=-0.89, p=0.0005) and large airway dysfunction (R20: r=-0.62, p=0.04). For patients with severe asthma, the improvement in MRI SV following bronchodilator inhalation was significantly correlated with the improvement in large airway dysfunction (∆R20: r=-0.83, p=0.04), but not small airway dysfunction (∆R5-R20: r=-0.33, p=0.53, ∆Ax: r=-0.49, p=0.32).Discussion
Free-breathing 1H MRI–derived SV was significantly increased following bronchodilator inhalation in patients with severe asthma confirming the sensitivity of this non-contrast enhanced method to changes in airway caliber. Importantly, we observed that MRI SV was related to oscillometry measures of large and small airway dysfunction. Bronchodilator therapy reduced the respiratory resistance of the large (R20) and small airways (R5-R20), and the reduction in large airways resistance was related to improved MRI SV.Conclusions
Free-breathing 1H MRI–derived SV is sensitive to bronchodilator therapy in patients with severe asthma and may reflect regional small airway pathology.Acknowledgements
The authors thank M. Kjarsgaard and C. Huang for helping with recruitment and assessment of study subjects, and J. Lecomte, C. Awde, T. DiLeonardo and S. Faseruk, the MRI technologists who performed the scanning.References
1. Capaldi DPI, Eddy RL, Svenningsen S, et al. Free-breathing Pulmonary MR Imaging to Quantify Regional Ventilation. Radiology. 2018;287(2):693-704.
2. Postma DS, Brightling C, Baldi S, et al. Exploring the relevance and extent of small airways dysfunction in asthma (ATLANTIS): baseline data from a prospective cohort study. Lancet Respir Med. 2019;7(5):402-416.
3. Lucas B.D. KT. An iterative image registration technique with an application to stereo vision. Paper presented at: 7th international joint conference on Artificial intelligence1981; San Francisco, California.
4. Zapke M, Topf HG, Zenker M, et al. Magnetic resonance lung function--a breakthrough for lung imaging and functional assessment? A phantom study and clinical trial. Respir Res. 2006;7:106.
5. Guo F, Svenningsen S, Eddy RL, et al. Anatomical pulmonary magnetic resonance imaging segmentation for regional structure-function measurements of asthma. Med Phys. 2016;43(6):2911-2926.
Figures