2308
129Xe and free-breathing 1H ventilation MRI in patients with cystic fibrosis1POLARIS, Academic Radiology, University of Sheffield, Sheffield, United Kingdom, 2Institute for Diagnostic and Interventional Radiology, Hannover Medical School, Hannover, Germany
Synopsis
Free-breathing 1H MRI offers a means of producing surrogate ventilation images without use of a contrast agent but more validation against direct ventilation imaging methods such as hyperpolarised gas MRI is required. 24 patients with cystic fibrosis were scanned with 1H and 129Xe ventilation MRI. There were strong correlations between 1H ventilation defect percentage (VDP), 129Xe VDP, lung clearance index and FEV1. 1H VDP was typically smaller than 129Xe VDP with wide limits of agreement (LOA) (bias 2.8%, LOA -13.7%, 19.3%). Both similarities and differences between 129Xe and 1H ventilation images were observed across the range of disease severity.
Introduction
Free-breathing 1H MRI can produce surrogate maps of ventilation without the use of a contrast agent. 1H ventilation metrics correlate strongly with lung clearance index (LCI)1 and show good short-term reproducibility2 in children with cystic fibrosis (CF). However, little validation has been performed against methods which directly image lung ventilation in patients. Hyperpolarised gas MRI using 129Xe or 3He provides ventilation images with signal directly proportional to the density of the inhaled tracer gas.Single slice measurements of 1H ventilation defect percentage (VDP) have shown moderate correlation with whole lung 129Xe VDP in children with CF3, and strong correlation with matched-slice 3He VDP in patients with CF4. However, a large bias between 3He and 1H VDP values and varying degrees of visual agreement between 3He and 1H ventilation images have been observed4.
The aim of this work was to investigate the relationship between 1H and 129Xe ventilation images across the whole lung in patients with a broad spectrum of CF lung disease.
Methods
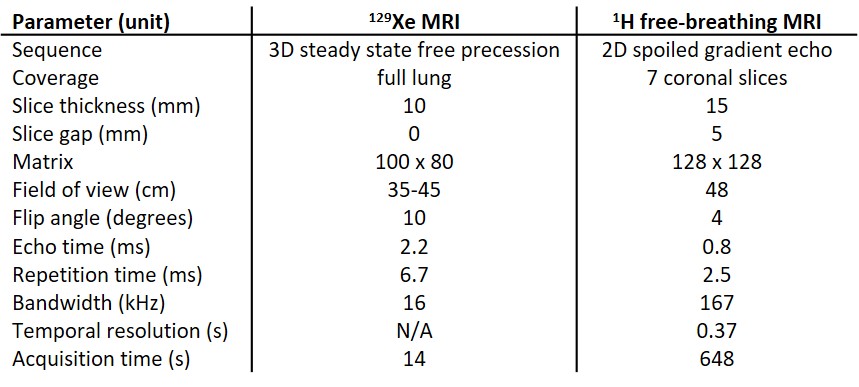
24 patients (aged 9 to 47) were scanned using a 1.5T whole body MRI system (GE HDx). Sequence parameters are shown in table 1. Patients also underwent spirometry and LCI testing.129Xe MRI: Patients were positioned supine in a 129Xe transmit-receive coil (CMRS). A mix (0.65-1L) of hyperpolarised 129Xe (~25% polarisation, 86% 129Xe, 0.4-0.5L) and N2 was inhaled from functional residual capacity (FRC), with gas volumes determined by patient height, and 129Xe ventilation images were acquired during breath-hold. 1H anatomical images of the same imaging volume were also acquired.
Free-breathing 1H MRI: Patients were positioned supine in an 8-element chest array (GE) and 250 dynamic images per slice were acquired during relaxed free-breathing. Phase-resolved functional lung (PREFUL) analysis5 was performed, including registration, low-pass filtering and calculation of fractional ventilation.
Analysis: Ventilation defect percentage (VDP) was calculated from the 129Xe and PREFUL ventilation images in the same manner. The anatomical 1H image volumes associated with the ventilation images were segmented semi-automatically using spatial fuzzy C-means thresholding6 to produce lung cavity masks with the large airways and vessels excluded. Linear binning7 of the ventilation images was performed with histograms scaled by the mean signal inside the lung cavity mask8, and the resulting ventilation defect region (1st bin) was used to calculate VDP. Correlations between metrics were performed, and Bland-Altman analysis was used to assess agreement between 129Xe and 1H VDP.
Results and Discussion
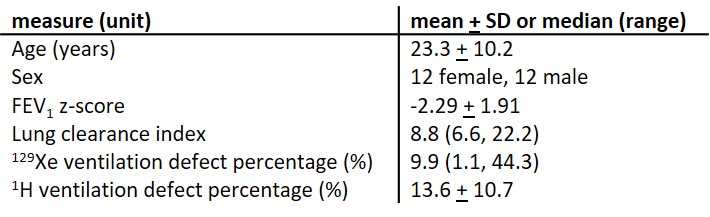
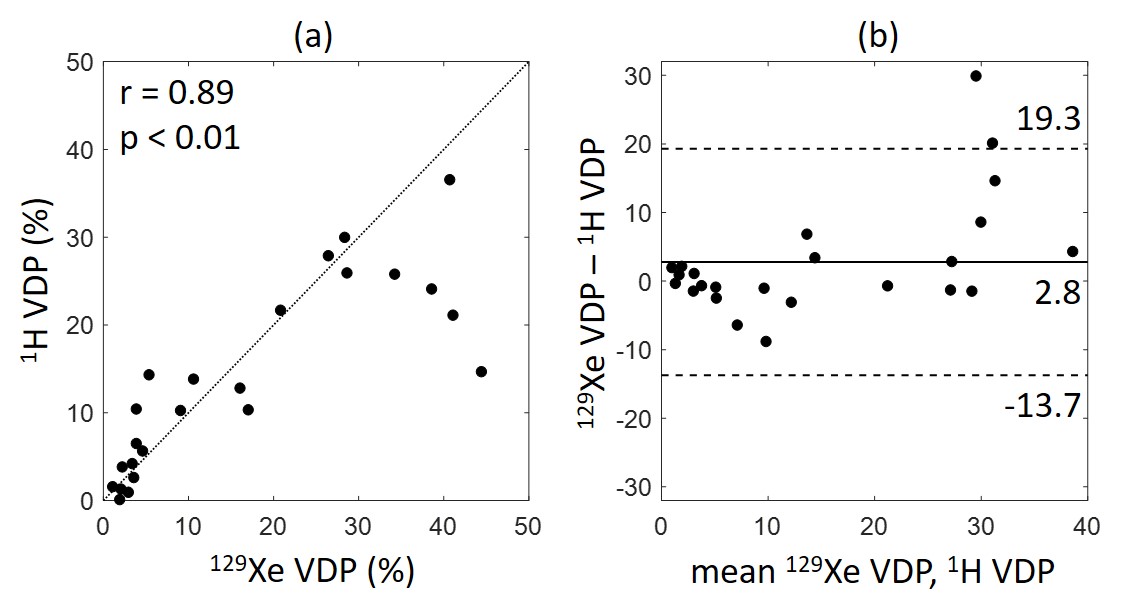
Patient demographics, pulmonary function test results and VDP values are summarised in table 2.There was a strong correlation between 129Xe VDP and 1H VDP (r=0.89, p<0.01, figure 1a). Mean 1H VDP was lower than mean 129Xe VDP with a bias of 2.8% (figure 1b) and limits of agreement at -13.7% and 19.3%. The correlations of 129Xe VDP with LCI (r=0.91) and FEV1 z-score (r=-0.83) were stronger than those of 1H VDP with LCI (r=0.82) and FEV1 z-score (r=-0.78), all p<0.01. Linear binning allowed user-independent evaluation of VDP with both techniques treated equally.
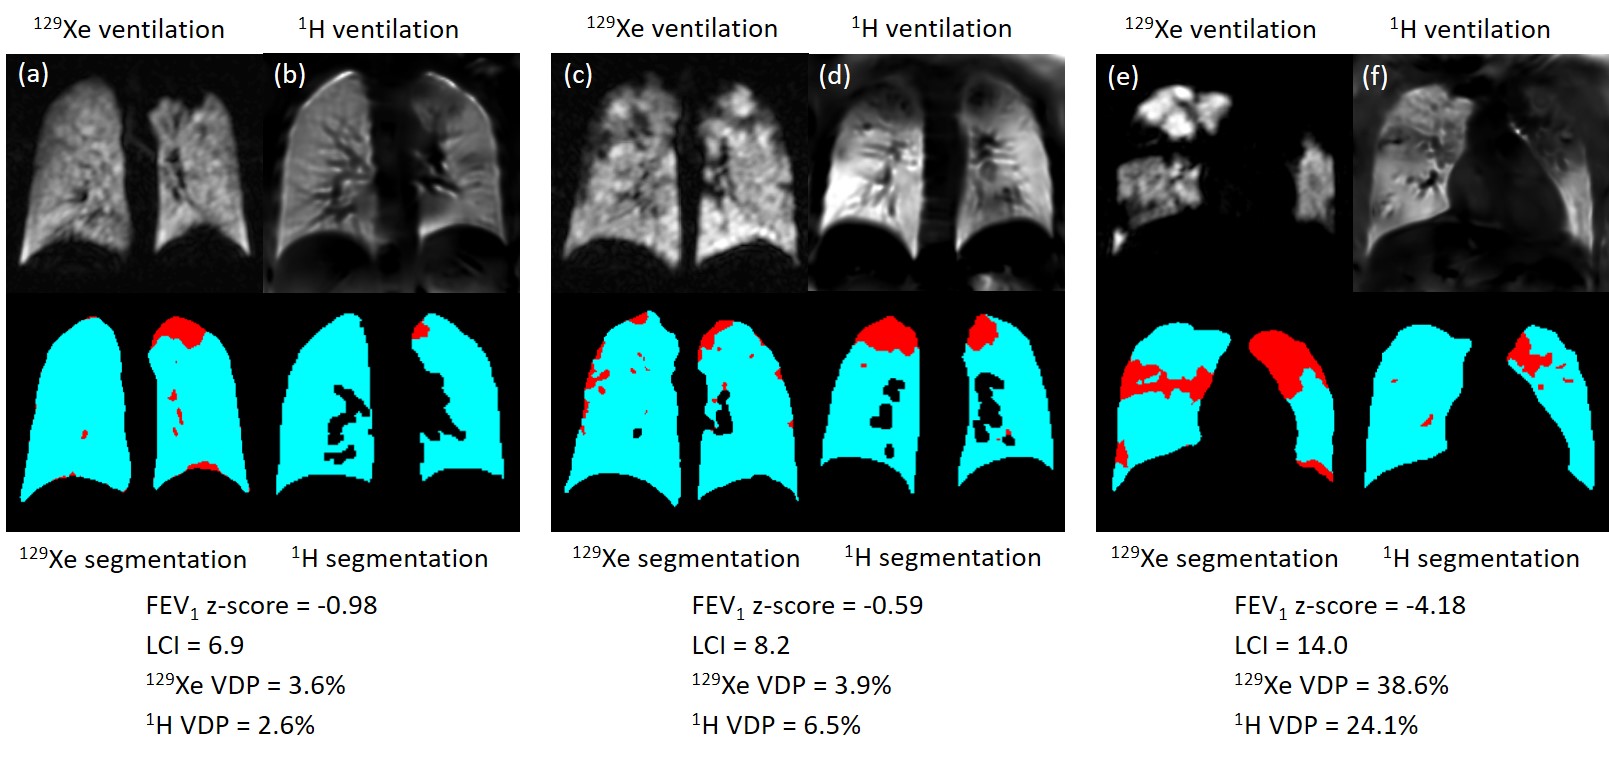
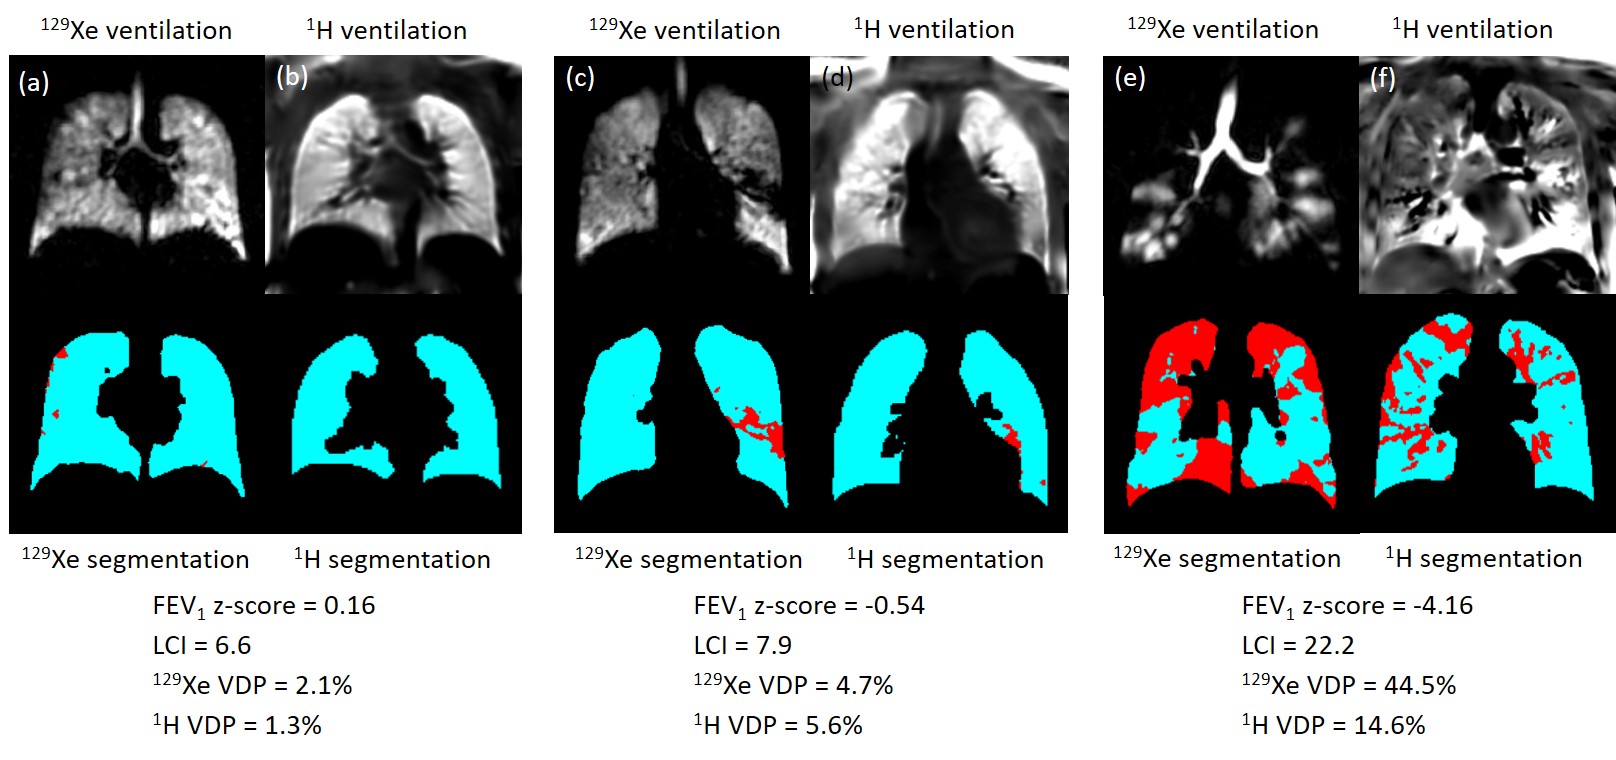
Similarities (e.g. figure 2) and differences (e.g. figure 3) were observed between 129Xe and 1H ventilation images across the range of disease severity. Regions of reduced 1H ventilation were often associated with 129Xe ventilation defects or heterogeneity but did not always capture their full extent or detailed patterns evident on 129Xe images (e.g. figure 2). In some cases, the appearance of 129Xe and 1H ventilation images were dissimilar (e.g. figure 3), which was possible even when 129Xe and 1H VDP values were concordant (e.g. figure 3a-d). Of particular relevance in patients with normal FEV1, small defects and patchy ventilation heterogeneity visible with 129Xe MRI were not seen on 1H ventilation images (e.g. figure 3a,b). Images from the patient with the largest difference between 129Xe and 1H VDP are shown in figure 3e,f.
Differences between techniques may be due to the fundamentally different sources of image contrast; inhaled 129Xe gas density and 1H signal modulation due to respiratory motion. Study limitations include differing voxel size, lung coverage, lung volumes during image acquisition and some error in matching of image planes for visual comparison. In particular, the lower spatial resolution of the 1H ventilation images (3.75x3.75x15mm) compared to the 129Xe images (3.5x3.5x10mm - 4.5x4.5x10mm) may in part explain the bias towards lower 1H VDP.
Conclusions
Ventilation defect percentage calculated from 1H free-breathing MRI showed strong correlations with 129Xe VDP, LCI and FEV1 z-score. 1H VDP was lower than 129Xe VDP with a bias of 2.8% and limits of agreement at -13.7% and 19.3%. Both similarities and differences between 129Xe and 1H ventilation images were observed across the range of disease severity. Reduced 1H ventilation was often, but not always, associated with 129Xe ventilation defects or heterogeneity. Small defects and patchy ventilation heterogeneity observed in early-stage CF lung disease on 129Xe ventilation images were not visualised with 1H ventilation MRI. The cause of the uncertainty in agreement between the techniques is unknown and warrants further investigation.Acknowledgements
National Institute for Health Research and Medical Research Council for funding.References
1. Nyilas S, Bauman G, Sommer G, et al. Novel magnetic resonance technique for functional imaging of cystic fibrosis lung disease. Eur Respir J 2017;50.
2. Nyilas S, Bauman G, Pusterla O, et al. Ventilation and perfusion assessed by functional MRI in children with CF: reproducibility in comparison to lung function. J Cyst Fibros 2019;18:543-50.
3. Couch MJ, Rayment JH, Grimm R, et al. Comparison of Phase-Resolved Functional Lung (PREFUL) MRI and Hyperpolarized 129Xe MRI in Pediatric Cystic Fibrosis. International Society for Magnetic Resonance in Medicine; 2019; Montreal, Canada. p. 0006.
4. Marshall H, Voskrebenzev A, Biancardi A, et al. Investigating the relationship between free-breathing 1H and breath-hold 3He MRI in patients with cystic fibrosis. International Society for Magnetic Resonance in Medicine; 2019; Montreal, Canada. p. 0014.
5. Voskrebenzev A, Gutberlet M, Klimes F, et al. Feasibility of quantitative regional ventilation and perfusion mapping with phase-resolved functional lung (PREFUL) MRI in healthy volunteers and COPD, CTEPH, and CF patients. Magn Reson Med 2018;79:2306-14.
6. Hughes PJC, Horn FC, Collier GJ, Biancardi A, Marshall H, Wild JM. Spatial fuzzy c-means thresholding for semiautomated calculation of percentage lung ventilated volume from hyperpolarized gas and (1) H MRI. J Magn Reson Imaging 2018;47:640-6.
7. He M, Driehuys B, Que LG, Huang YT. Using Hyperpolarized (129)Xe MRI to Quantify the Pulmonary Ventilation Distribution. Acad Radiol 2016;23:1521-31.
8. Collier GJ, Acunzo L, Smith LJ, et al. Linear binning maps for image analysis of pulmonary ventilation with hyperpolarized gas MRI: transferability and clinical applications. International Society for Magnetic Resonance in Medicine; 2018; Paris. p. 4482.
Figures