2307
Free breathing and breath hold lung T1 is significantly different in pulmonary hypertension subgroups.
Laura Saunders1, Andy Swift1, and Jim Wild1
1University of Sheffield, Sheffield, United Kingdom
1University of Sheffield, Sheffield, United Kingdom
Synopsis
This work explores lung T1 mapping as a contrast-free, radiation-free method of differentiating subgroups in pulmonary hypertension, measured during both free breathing and inspiration breath hold acquisitions. Inspiration lung T1 mapping is significantly different between patients with pulmonary arterial hypertension (PAH) and chronic thromboembolic PH (CTEPH), as well as between patients with idiopathic PAH and PAH due to connective tissue disease (CTD) and congenital heart disease (CHD). Free breathing lung T1 mapping was also significantly different between patients with IPAH and PAH CTD and CHD and may be useful in patients who struggle to maintain breath hold due to dyspnoea.
Background
Lung T1 mapping has been shown to be sensitive to pulmonary perfusion and lung T1 reflects a combination of tissue composition and density, blood volume and blood oxygenation [1]. Pulmonary hypertension is a heterogeneous condition defined by increased blood pressure in the pulmonary artery, which may have a variety of causes including stiffening or thickening of the small pulmonary artery branches (pulmonary arterial hypertension, PAH) or blood clots in the lungs (chronic thromboembolic pulmonary hypertension, CTEPH). Patient treatment and outcome depends upon the cause (and therefore subgroup) of pulmonary hypertension and therefore differentiating patients is key to patient management and treatment. Lung T1 mapping may be a contrast-free, radiation-free method of differentiating subgroups in pulmonary hypertension however patients may struggle with a breath hold due to dyspnoea.Purpose
To explore lung T1 mapping as a contrast-free, radiation-free method of differentiating subgroups in pulmonary hypertension, measuring during both free breathing and inspiration breath hold acquisitions.Methods
65 patients with suspected pulmonary hypertension and 9 healthy volunteers underwent lung T1 mapping on a 1.5T GE scanner using a Look-Locker inversion recovery sequence. T1 mapping images were acquired during inspiration breath hold and also during an identical acquisition during free breathing with post-processing image registration for motion correction. The Look-Locker sequence comprises a global 180 degree inversion pulse followed by 16 gradient echo readout images [2]. Imaging parameters were as follows: inversion time (TI): 229ms; TR=3.2ms; flip angle: 7; phase x frequency: 128x128; slice thickness: 15mm; pixel bandwidth: 244.14; normal field of view 400-440mm. Breathing instructions for the free breathing acquisition were to breathe normally.For analysis, patients were grouped into the 5 subcategories of pulmonary hypertension (PAH: n=29; pulmonary hypertension with left heart disease (PH LHD): n=9; pulmonary hypertension due to lung disease (PH-lung): n=7; CTEPH: n=8; other pulmonary hypertension (MISC): n=3) and patients without pulmonary hypertension (no-PH: n=9). Of the patients with PAH, 8 had a diagnosis of idiopathic PAH (IPAH), 10 had a diagnosis of PAH due to connective tissue disease (PAH-CTD) and 8 had a diagnosis of PAH due to congenital heart disease (PAH-CHD), 1 had PAH due to drugs and 1 had PAH associated with portal hypertension.
For free breathing acquisitions, post-processing image registration was used to spatially align acquired images based creating spatially aligned synthetic images. Automatically selected ROIs from the acquired images are input into a combined respiratory and inversion recovery model to determine images which are in the similar respiratory states. Spatially aligned images are then input into a simplified inversion recovery model to create synthetic images. Acquired images are then co-registered to synthetic images, see Figure 1. Image alignment before and after image registration was evaluated using Dice Similarity Coefficient (DSC).
Results
Lung image alignment was significantly improved after image registration for free breathing images (DSC before registration: 0.93±0.02; DSC after registration: 0.95±0.02; p<0.001) and post registration DSC was not significantly different from breath hold DSC (p=0.651).T1 maps were created for all patients, see Figure 2. Mean lung T1 during inspiration was significantly lower in CTEPH (T1=0.97±0.2s) than both healthy volunteers (T1=1.10±0.12s, p=0.038) and PAH (T1=1.14±0.11, p=0.016), see Figure 3. Mean free breathing T1 was significantly lower in patients with PH-Lung (T1=0.93±0.33s) when compared to healthy volunteers (T1=1.22±0.3s, p=0.049). Within the group of patients with PAH, during inspiration and free breathing acquisition, mean lung T1 was significantly lower in patients with IPAH than patients (T1=1.03±0.09s) with PAH-CTD (T1=1.22±0.06s, inspiration: p<0.001; free breathing: p=0.019) or PAH-CHD (T1=1.16±0.07s, inspiration: p=0.005; free breathing: p=0.004), see Figure 4. There was no significant difference in mean lung T1 between patients with PAH-CHD and PAH-CTD.
T1 values from inspiration and breath hold significantly correlated with one another (r=0.534, p<0.001) and did not differ from one another significantly in this patient cohort (p=0.461).
Discussion and conclusion
Inspiration lung T1 mapping is significantly different between patients with PAH and CTEPH, as well as between patients with IPAH and PAH due to CTD and CHD. Free breathing lung T1 mapping was significantly lower in patients with PH-Lung when compared to healthy volunteers, as well as being significantly different between patients with IPAH and PAH due to CTD and CHD. Free breathing T1 mapping acquisition may be particularly useful in patients who struggle to maintain breath hold due to dyspnoea.Acknowledgements
No acknowledgement found.References
[1] Jobst et a., (2015). Functional Lung MRI in Chronic Obstructive Pulmonary Disease: Comparison of T1 Mapping, Oxygen-enhanced T1 Mapping and Dynamic Contrast Enhanced Perfusion.Figures
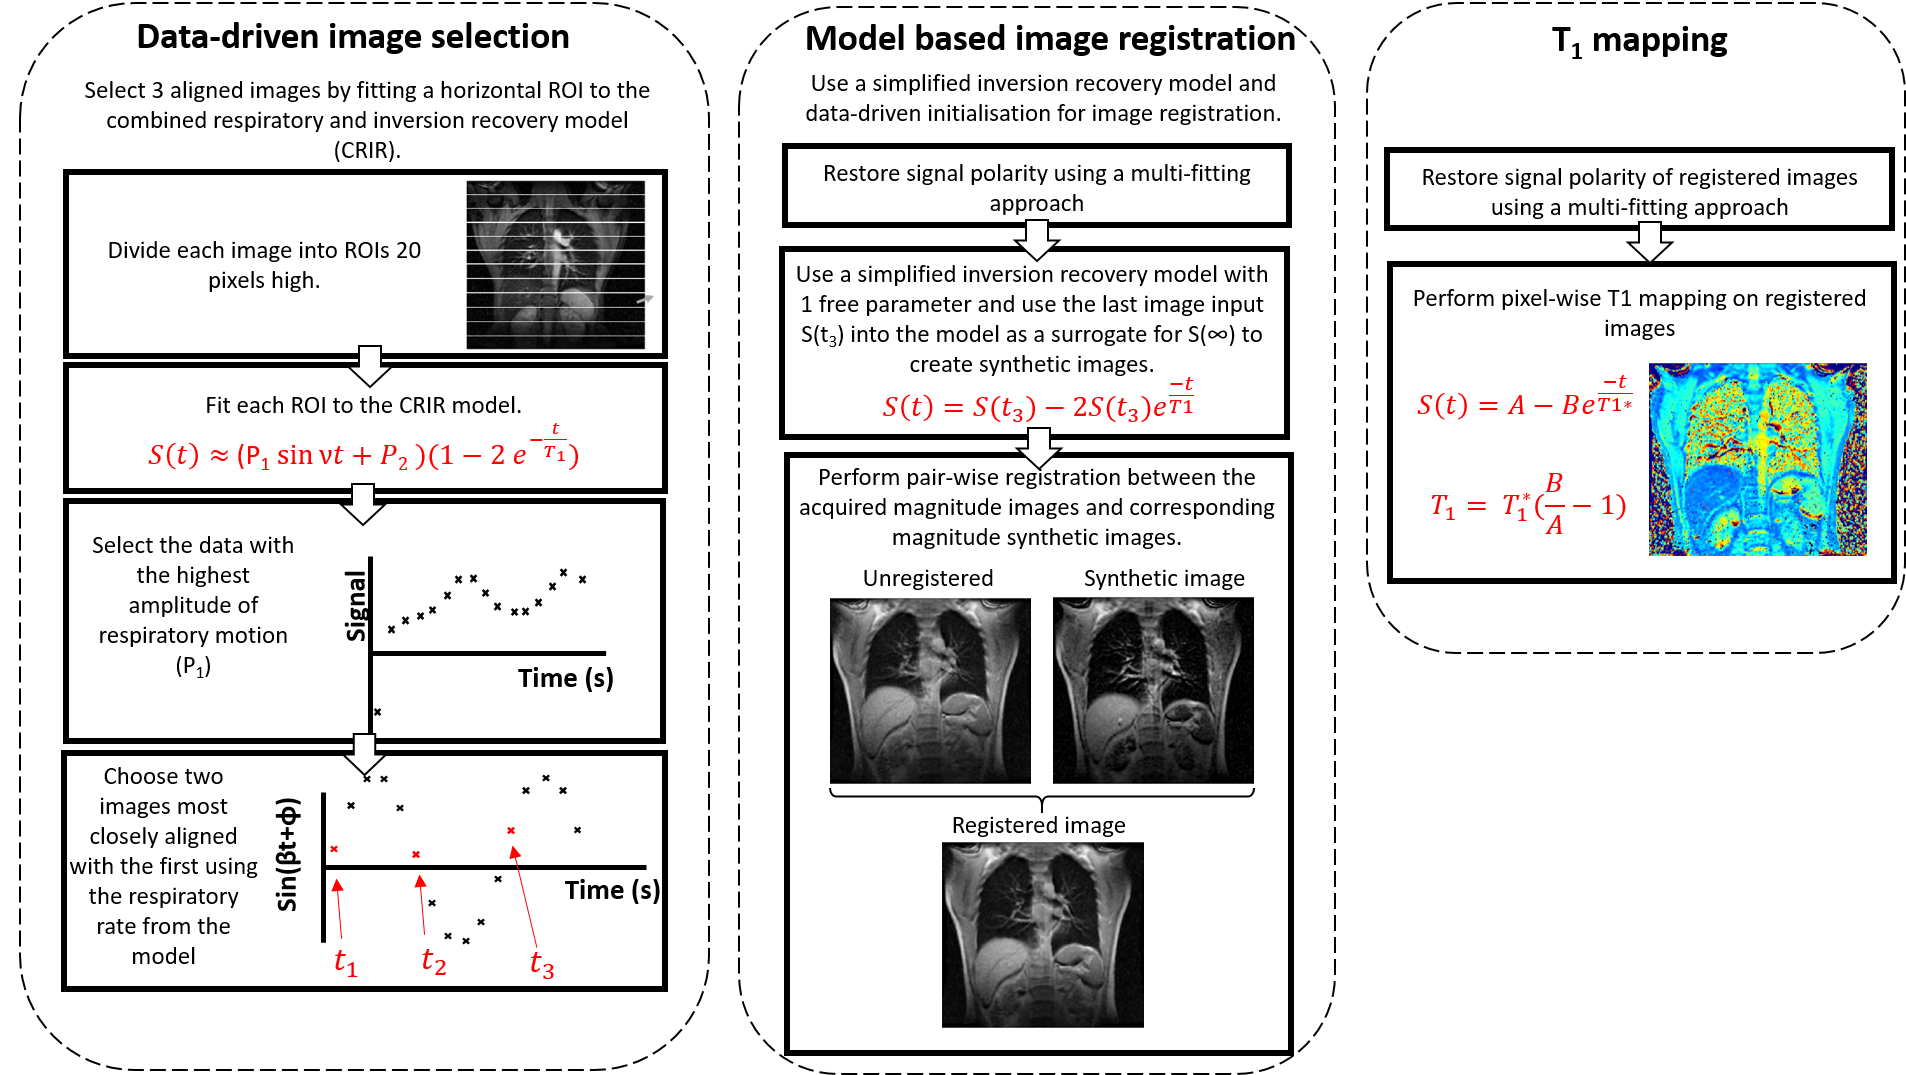
Method for image
registration of free breathing Look-Locker images. Equations 2 and 2: S=signal;
P1 =fitting constant; ν = respiratory rate; t=time. Equations 3 and
4: A=fitting constant; B=fitting constant; S=signal; t=time.
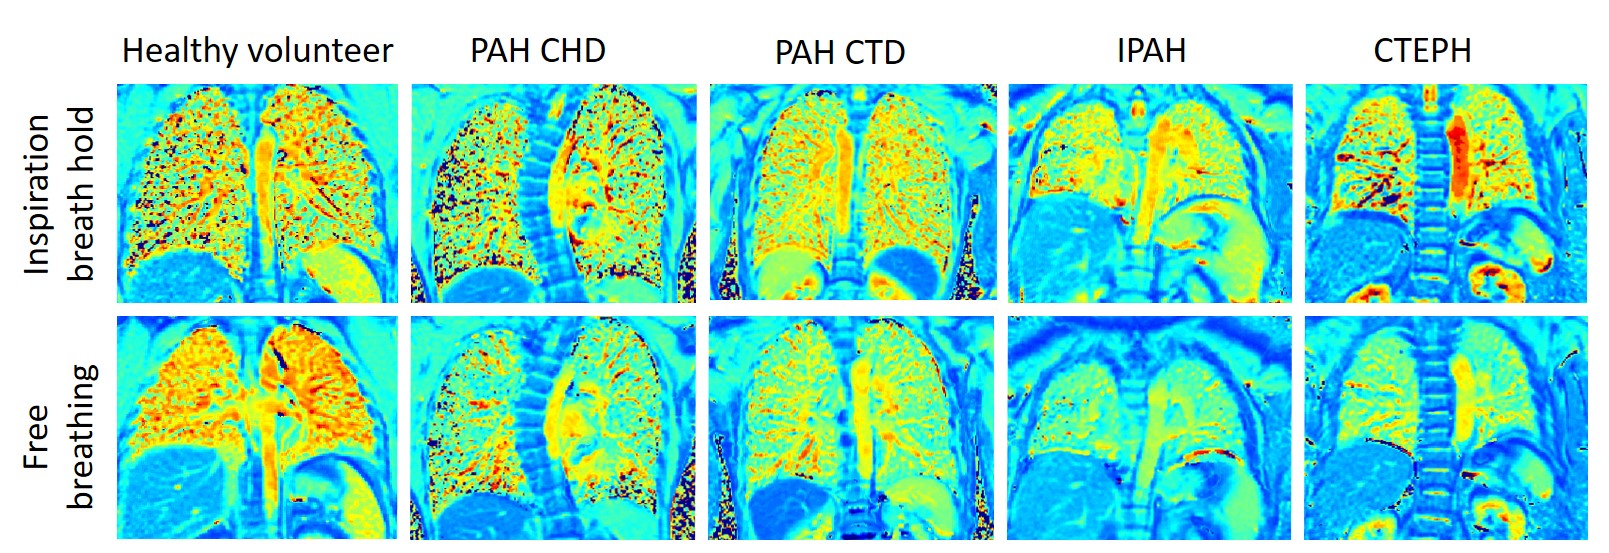
Example T1 maps from a healthy
volunteer, a patient with PAH due to congenital heart disease, PAH due to
connective tissue disease, idiopathic PAH and chronic thromboembolic pulmonary hypertension.
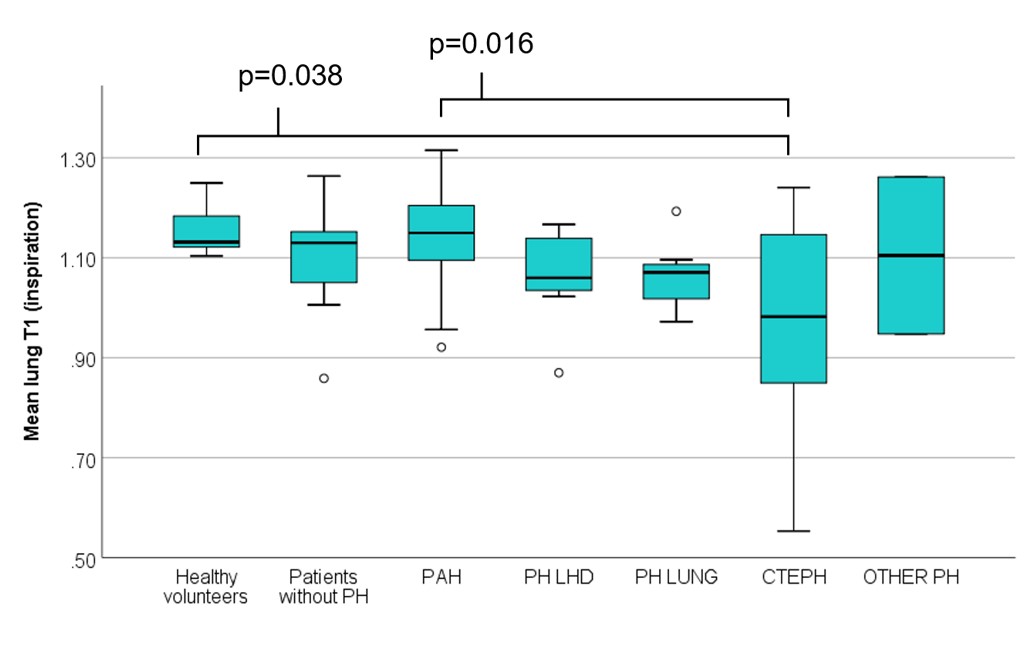
Box plot of mean
lung T1 in PH group groups and control groups. Mean lung T1 was
significantly different between healthy volunteers and patients with CTEPH, as
well as between patients with PAH and CTEPH.
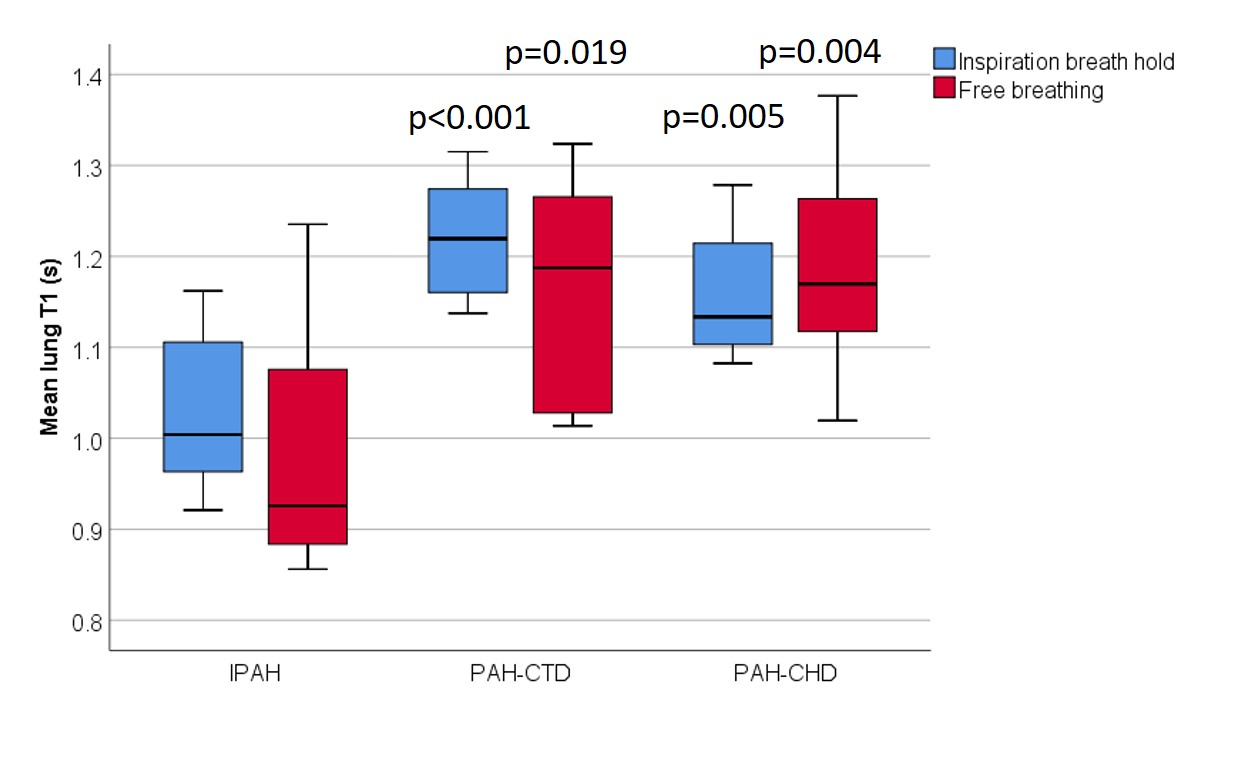
Box plot of mean lung T1 in PAH subgroups. Mean lung T1 was significantly lower in IPAH
compared to both PAH-CTD (inspiration: p<0.001, free breathing: p=0.019) and
PAH-CHD (inspiration: p=0.005, free breathing: p=0.004). There
was no significant difference in mean lung T1 for patients with
PAH-CHD and PAH-CTD.