2306
On gamma variate fitting for perfusion quantification in the lung.1Bioxydyn Ltd, Manchester, United Kingdom, 2Division of Cardiovascular Sciences, University of Manchester, Manchester, United Kingdom, 3POLARIS, , Academic Radiology, Department of Infection, Immunity and Cardiovascular Disease, The University of Sheffield, Sheffield, United Kingdom, 4Centre for Medical Image Computing, University College London, London, United Kingdom
Synopsis
Application of first pass imaging to the lung is a promising technique. The majority of works apply a Singular Value Decomposition (SVD) with or without a prior fit to a gamma variate function to the concentration-time curve. In this study we compare lung perfusion quantification with and without 2 versions of the gamma-variate fitting in data from 66 patients with Interstitial lung disease. We found that the presence and choice of gamma variate fitting has an influence on perfusion parameters, but this is generally very small, except for mean transit time, suggesting that these approaches are broadly equivalent in practice.
Introduction
Imaging of the first pass of a contrast agent bolus through a tissue allows the measurement of blood flow (BF), blood volume (BV) and mean transit time (MTT)1. Application of first pass imaging to the lung with MRI has significant advantages over perfusion quantification with SPECT or CT. The majority of works on this topic apply a Singular Value Decomposition (SVD4) with2,3 or without5,6 a prior fit to a gamma variate (GV) function to the concentration-time curve. In this study we compare lung perfusion quantification with and without GV fitting in a population of patients with interstitial lung disease (ILD). We also compare results from two GV formulations, as described by Madsen7 and by Li8.Methods
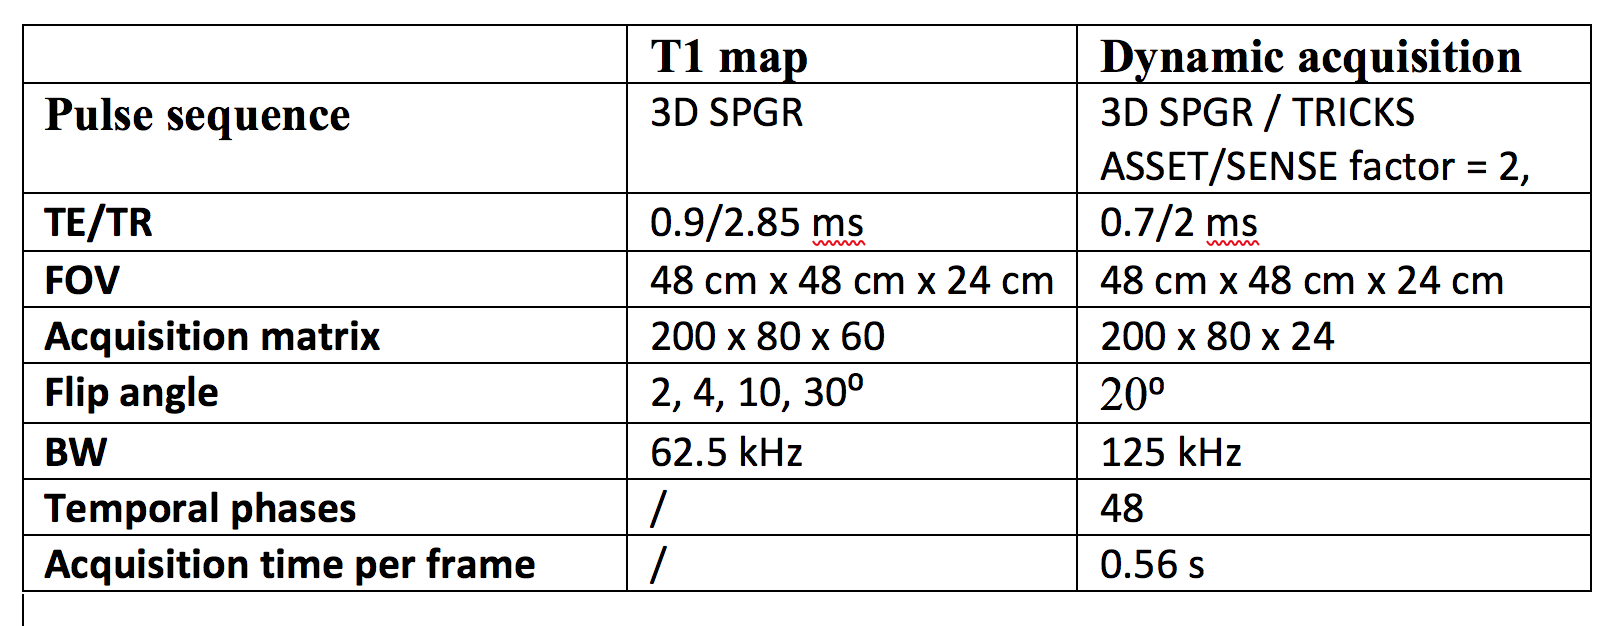
66 patients with ILD underwent DCE lung perfusion MRI at 1.5 T (Signa HDxt GE). The protocol is summarised in Table 1. At the start of the dynamic acquisition, a bolus injection of 0.06 mL/kg gadoteric acid (Dotarem, Guerbet, Villepinte, France) was administered in the left antecubital vein by a power injector at 2 mL/s followed by a saline flush at 4 mL/s. All images were acquired at end expiration breath hold. Lungs were manually segmented and an ROI in the main trunk of the pulmonary artery was defined to derive the arterial input function (AIF).Signal curves within the lung ROI and the AIF were converted into concentration-time curves (C(t), CAIF(t)) and fitted with two types of GV curve, namely GV17:
$$$ \begin{equation}GV1(t) \begin{cases}0, & t<t_{start}\\\alpha(\frac{t-t_{start}}{t_{p}})^{\beta} e^{\frac{t-t_{start}}{t_{p}}} & t≥_{start}\end{cases}\end{equation} $$$
where parameters α, β, tstart and tp represent respectively the maximum value of the curve, its shape, the timepoint at start of the curve, and the time between tstart and the curve maximum point; and GV28:
$$$ \begin{equation}GV2(t) \begin{cases}0, & t<t_{start}\\\frac{AUC}{\gamma^{\beta+1}\sqrt[]{2\pi\beta }\beta^{\beta}e^{-\beta+1/(12\beta)}}(t-t_{start})^{\beta}e^{\frac{t-t_{start}}{\gamma}} &t≥t_{start}\end{cases}\end{equation} $$$
where parameters β, γ define the shape of the curve. AUC is the area under the concentration-time curve, and is calculated, not fitted. Each curve fit was executed using a Levenberg-Marquardt algorithm (least_squares routine, Scipy Python package).
Blood volume was calculated as BV = $$BV = \frac{\int_{0}^{inf} C(t)dt }{\int_{0}^{inf} C_{AIF}(t)dt } $$ . On the basis of indicator dilution theory, a deconvolution of CAIF(t) from C(t) was performed by truncated SVD (tSVD, threshold of 20% of the largest SV). Blood Flow (BF) is defined as the maximum of the obtained impulse response function and the mean transit time as MTT = BV/BF.
Median and interquartile range (IQR) over the whole lung for BV, MTT and BF were obtained using C(t), and with C(t) and CAIF(t)) substituted by their GM1 and GM2 fits.
Parameters were compared using a repeated measure one-way ANOVA with Bonferroni correction. The median values of residuals were compared using a repeated measures two-tailed t-test. Spearman correlation coefficients were calculated between perfusion parameters and FEV1% pred, FVC pred%, DLCO and KCO. p<0.05 was considered significant.
Results
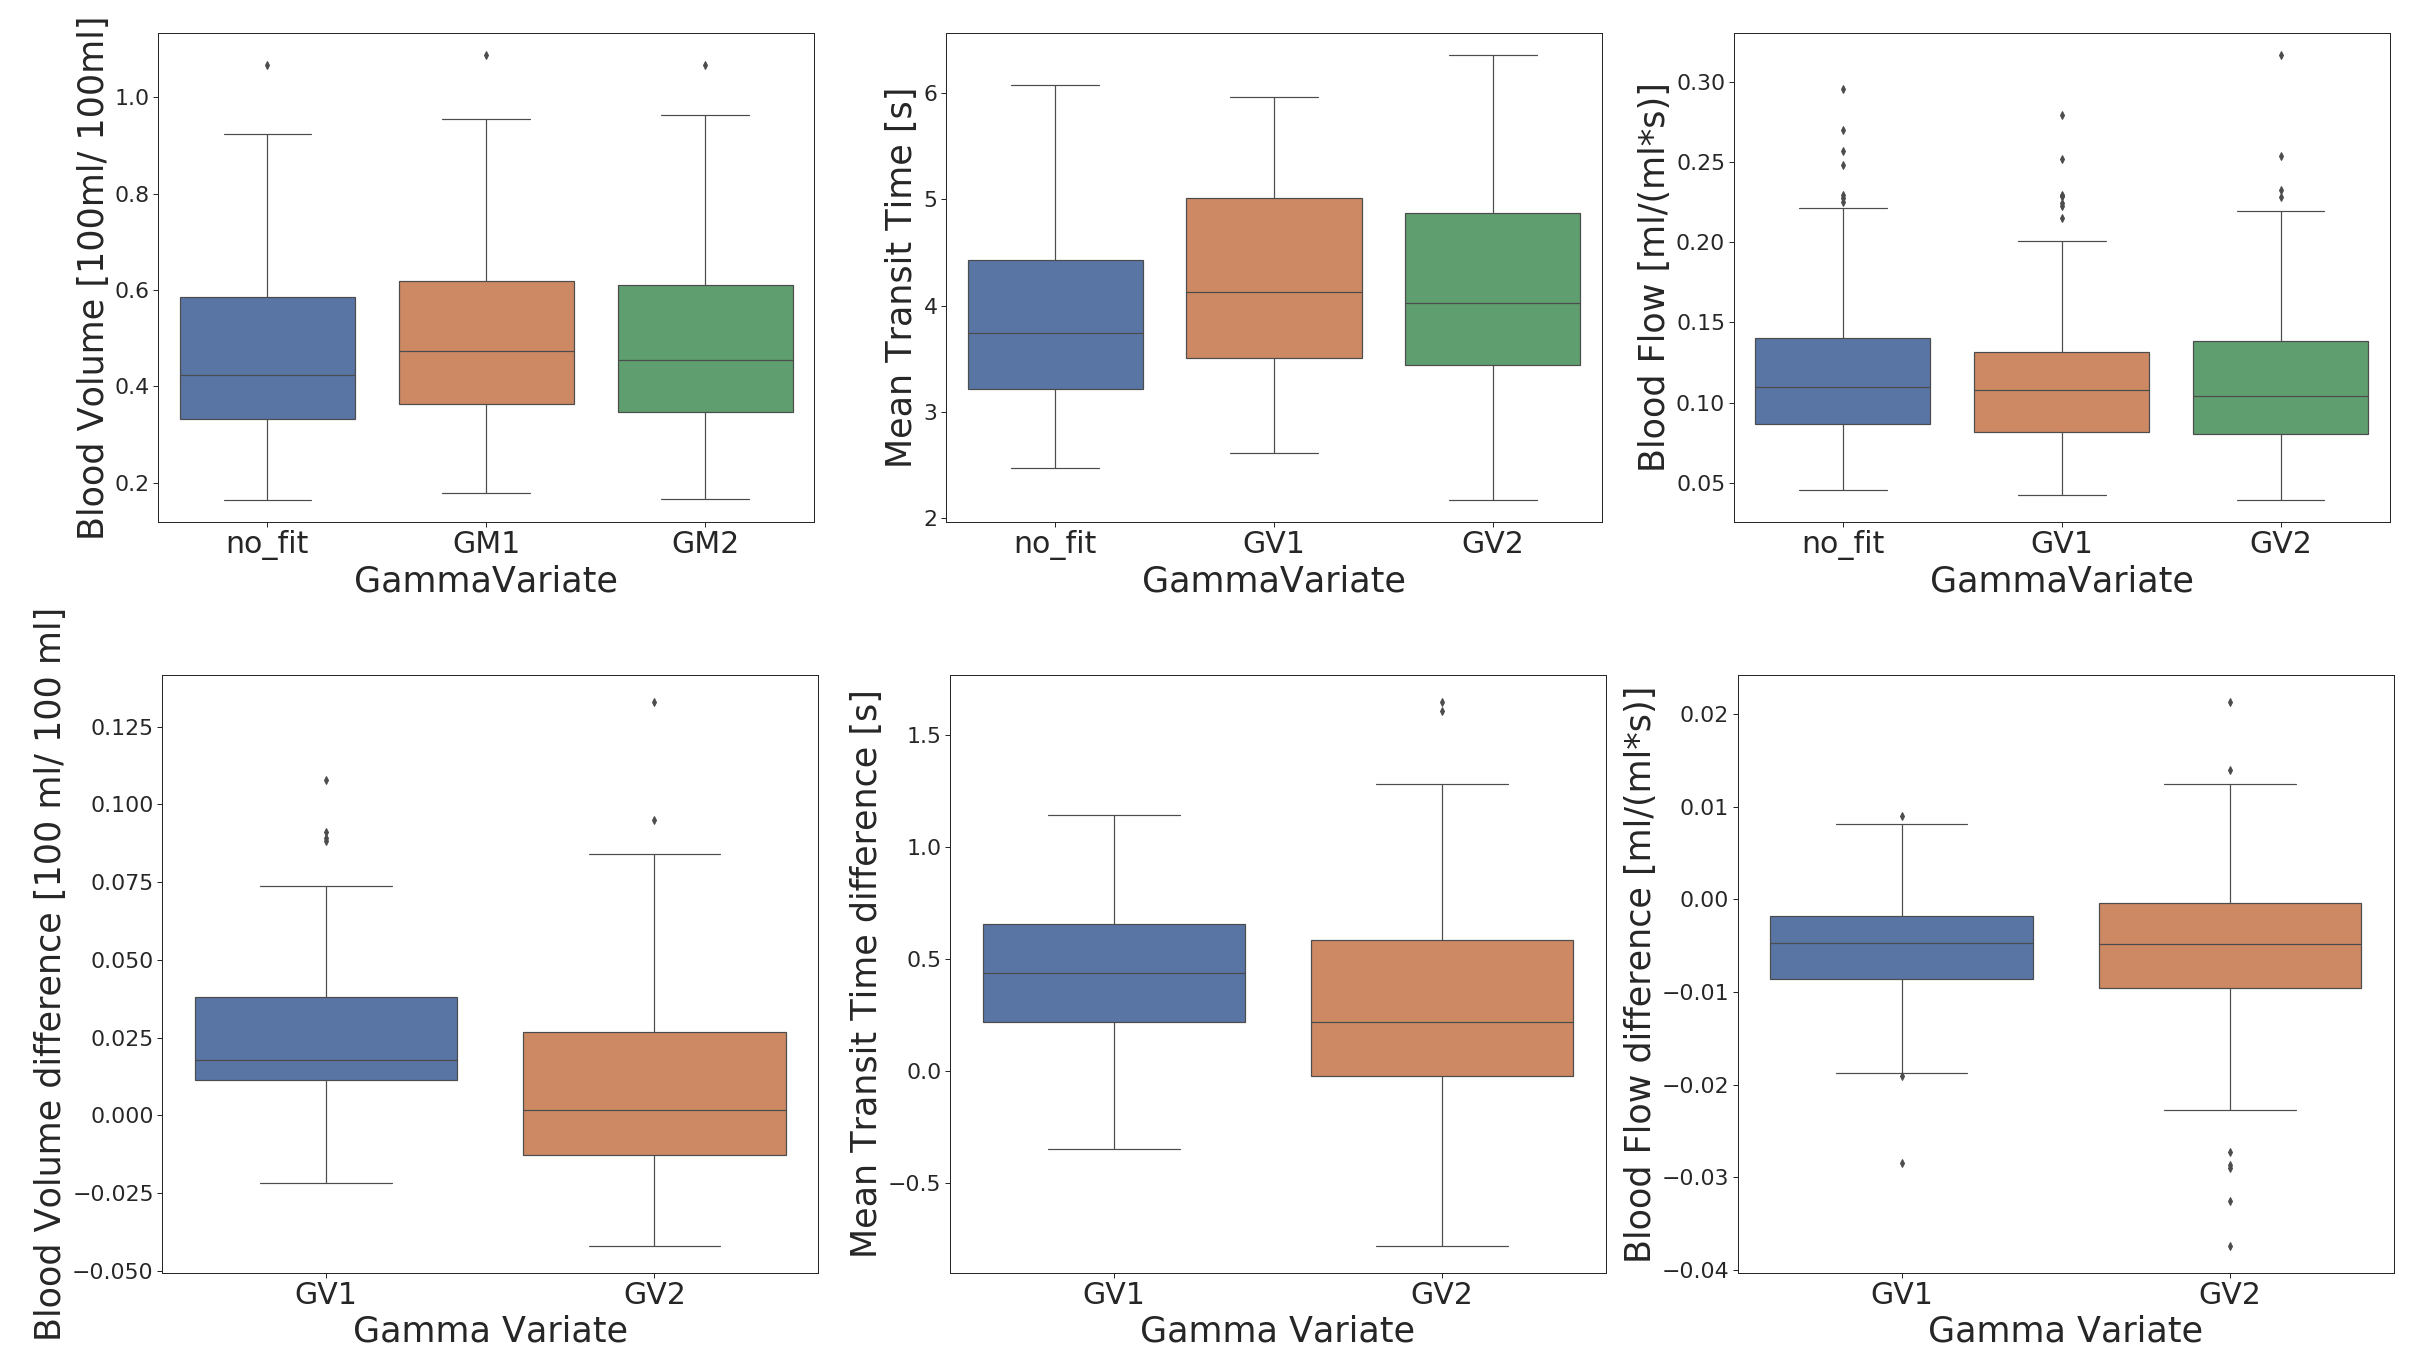
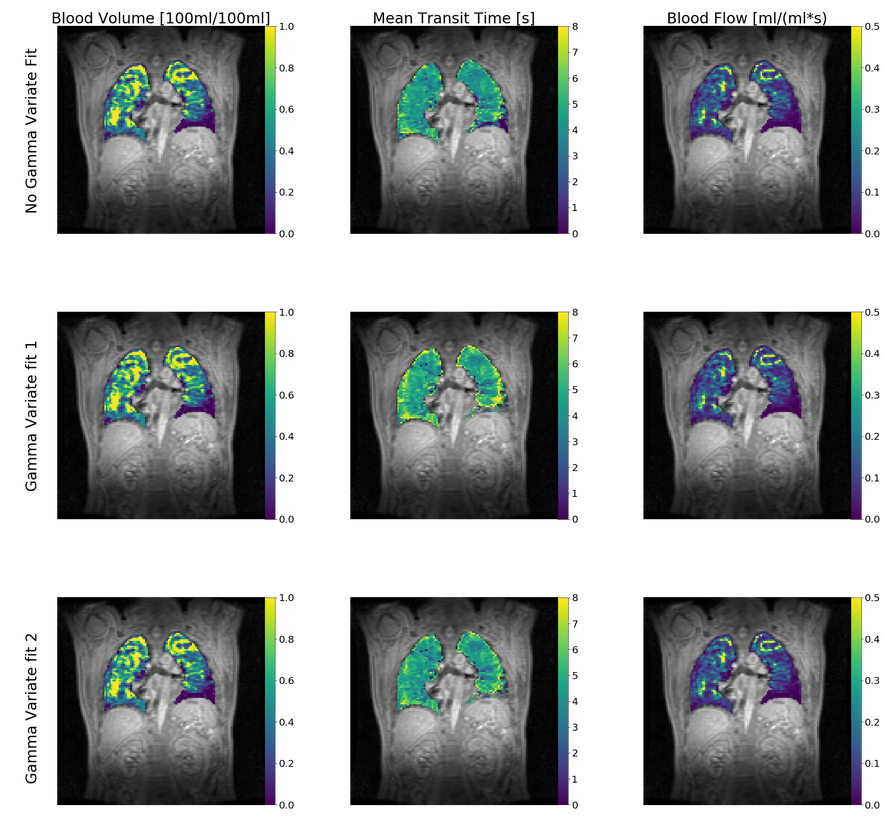
One dataset was eliminated due to incorrect breathhold.Figure 1 presents box plots of BV, MTT and BF median values and the difference between the GV1 and GV2 fits and no fit results. Parameters obtained by the different methods are all significantly different, with the exception of BF obtained by GV1 and GV2. Figure 2 presents maps from one subject showing BV, MTT and BF derived using each of the three considered methods.
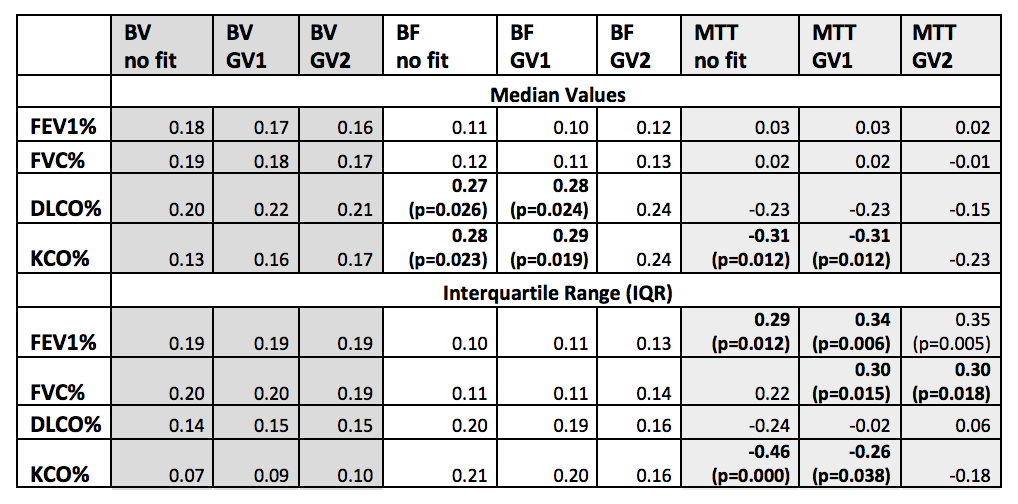
Table 2 presents the Pearson correlation between perfusion parameters and lung function tests. P-values are indicated when p<0.05. GV1 generates consistently slightly higher fitting residuals than GV2 (0.88 ± 0.06 vs 0.86 ± 0.06, p<0.0001).
Discussion
Concentration-time curves are fitted to a GV curve on the basis that this helps reduce the effects of the contrast agent second pass, its extravasation, and the effects of noise. The second pass curve may have a higher contribution in terms of AUC on the AIF curve than on the tissue curve, therefore its elimination may lead to an increase in BV. This may explain why BV is higher in GV1 and GV2 than no_fit. However, titting has minimal influence on BF values, thanks to the robustness of the tSVD. MTT is the perfusion parameter most influenced by fitting, due to the non-linear relationship with BV. In all parameters, results obtained with GV2 show greater standard deviation across individuals than GV1 or no fit.The lack of a gold standard, independent measurement of lung perfusion parameters does not allow determination of which analysis method is most accurate. However, when comparing the perfusion parameters with lung function parameters, similar correlations exist between parameters extracted with no_fit and GV1. The only exception is MTT IQR, where a stronger correlation exists with KCO% when no fit is applied, than when the GV1 fit is applied. GV2 results generally show less evidence correlation with lung function.
Conclusions
The presence and choice of gamma variate fitting has an influence on lung perfusion parameters, but this is generally very small, except for the mean transit time. GV1 is to be preferred to GV2 given the the lower dispersal of results and only minimally higher fitting residuals. Also, the observed correlations between perfusion MR parameters and lung function tests are similar between fitting with GV1 and no fit, suggesting that these approaches are broadly equivalent in practice.Acknowledgements
The research leading to these results received funding from the Innovative Medicines Initiatives 2 Joint Undertaking under grant agreement No 116106. This Joint Undertaking receives support from the European Union’s Horizon 2020 research and innovation programme and EFPIA.References
(1): Sourbron, Steven P., and David L. Buckley. "Classic models for dynamic contrast‐enhanced MRI." NMR in Biomedicine 26.8 (2013): 1004-1027.
(2) Ley-Zaporozhan, Julia, et al. "Repeatability and reproducibility of quantitative whole-lung perfusion magnetic resonance imaging." Journal of thoracic imaging 26.3 (2011): 230-239.
(3) Ohno, Yoshiharu, et al. "Dynamic perfusion MRI versus perfusion scintigraphy: prediction of postoperative lung function in patients with lung cancer." American Journal of Roentgenology 182.1 (2004): 73-78.
(4) Thompson Jr, Howard K., et al. "Indicator transit time considered as a gamma variate." Circulation Research 14.6 (1964): 502-515.
(5) Ingrisch, Michael, et al. "Assessment of pulmonary perfusion with breath-hold and free-breathing dynamic contrast-enhanced magnetic resonance imaging: quantification and reproducibility." Investigative radiology 49.6 (2014): 382-389.
(6) Salehi Ravesh, M., et al. "Quantification of pulmonary microcirculation by dynamic contrast‐enhanced magnetic resonance imaging: Comparison of four regularization methods." Magnetic resonance in medicine 69.1 (2013): 188-199.
(7) Madsen, Mark T. "A simplified formulation of the gamma variate function." Physics in Medicine & Biology 37.7 (1992): 1597.
(8) Li, Xingfeng, Jie Tian, and R. K. Millard. "Erroneous and
inappropriate use of gamma fits to tracer-dilution curves in magnetic resonance
imaging and nuclear medicine." Magnetic resonance imaging 21.9 (2003):
1095-1096.
Figures