2305
Repeatability and correlation of hyperpolarized xenon-129 and oxygen enhanced MRI parameters in healthy volunteers1POLARIS, Department of Infection, Immunity and Cardiovascular Disease, The University of Sheffield, Sheffield, United Kingdom, 2Bioxydyn, Manchester, United Kingdom, 3Sheffield Children's Hospital NHS Foundation Trust, Sheffield, United Kingdom, 4Division of Cardiovascular Sciences, University of Manchester, Manchester, United Kingdom, 5Insigneo Institute for in silico Medicine, The University of Sheffield, Sheffield, United Kingdom, 6Centre for Medical Image Computing, University College London, London, United Kingdom
Synopsis
Hyperpolarised xenon-129 MRI has shown utility in longitudinal assessment of lung structure and function, and has been shown to be a repeatable method. Oxygen enhanced MRI is a cheaper method of imaging different aspects of lung function. This work aimed to assess a single-centre repeatability of multiple metrics from both imaging methods in volunteers, and assess any correlations between xenon-129 and oxygen enhanced metrics of lung function.
Introduction
Hyperpolarized xenon-129 (129Xe) is able to assess both structure1 and function2-4 of the lungs. Oxygen enhanced MRI (OE-MRI) is a low-cost and easier to implement proton MRI acquisition method that may provide alternative functional metrics5,6 to 129Xe. We studied the repeatability of 129Xe and OE-MRI parameters in a population of adult healthy volunteers, and evaluated the degree of correlation between the resulting metrics.Methods
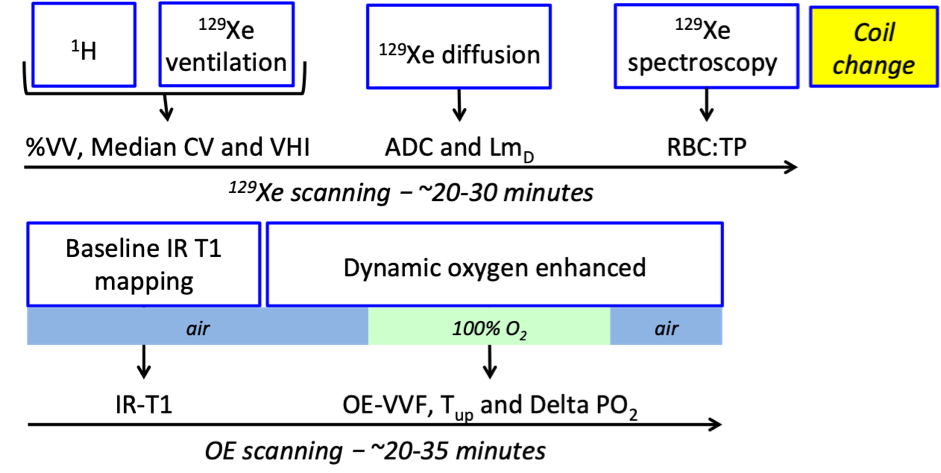
Nine healthy volunteers (26 - 75 yo, 3 females) were scanned twice using a 1.5 T GE Signa HDxt, in separate sessions 4 to 7 days apart. The full protocol comprises 129Xe MR imaging followed by OE-MRI imaging (Figure 1).129Xe MRI: All 129Xe imaging was carried out using a flexible quadrature transmit/receive vest coil (Clinical MR Solutions, Brookfield, Wisconsin, USA). Participants underwent three hyperpolarized 129Xe7 scans:
- Ventilation-weighted imaging2 (500mL 129Xe and 500mL N2). Prior to this acquisition a structural 1H image was acquired. This 1H image is then co-registered to the 129Xe image to calculate percentage lung ventilated volume (%VV), median coefficient of variation of 129Xe signal intensity (Median CV) and ventilation heterogeneity index (VHI)3,8
- 3D diffusion-weighted imaging1 (550mL 129Xe and 450mL N2). Providing apparent diffusion coefficient (ADC) and diffusive length scale (LmD)1
- 129Xe Spectroscopy4 (500mL 129Xe and 500mL N2). Providing the red blood cell to tissue plasma (RBC:TP) ratio
OE MRI: All OE MRI was acquired using an 8-element chest receiver coil. A free-breathing protocol based on an inversion-prepared centric ordered single shot 3D-turbo field echo sequence was used. A baseline proton T1 map was calculated from a series of 6 acquisitions with variable TI (40, 100, 300, 1100, 2000 and 5000 ms). This was followed by a dynamic OE acquisition lasting 15 min (TI=1100 ms) with a temporal resolution of 10 s, during which gas was delivered at 10 L/min via a disposable non-rebreathing mask and switched at minute 2 from medical air to 100% O2, and back to air at minute 10. Images were registered to correct for respiratory motion using a non-linear registration algorithm9. Lungs were manually segmented from identified target images using in-house VoxelFlow software.
The following parameters were extracted:
- Baseline proton T1 values (IR-T1)5
- O2 wash-in time (τup)5
- Change in partial pressure of O2 (ΔPO2)5
- OE-MRI Ventilated volume fraction (OE-VVF): a pixel within the lung is considered ventilated when the Akaike information criterion (AIC) favours an exponential fit to the dynamic time series OE signal change over a constant function.
Statistical analysis: All statistical analysis was carried out using Graphpad Prism version 7 for Mac (GraphPad Software, La Jolla California USA). Bland-Altman analysis was carried out on each of the metrics described above to assess repeatability, along with the calculation of the repeatability metric10. Additionally, paired t-tests, or Wilcoxon matched pairs tests were carried out (depending on the result of the Shapiro-Wilk normality test) to assess differences between each visit. Finally, Spearman/Pearson correlations were carried out to assess the relationship between OE and 129Xe metrics (note for this analysis the average measure over both visits was used).
Results
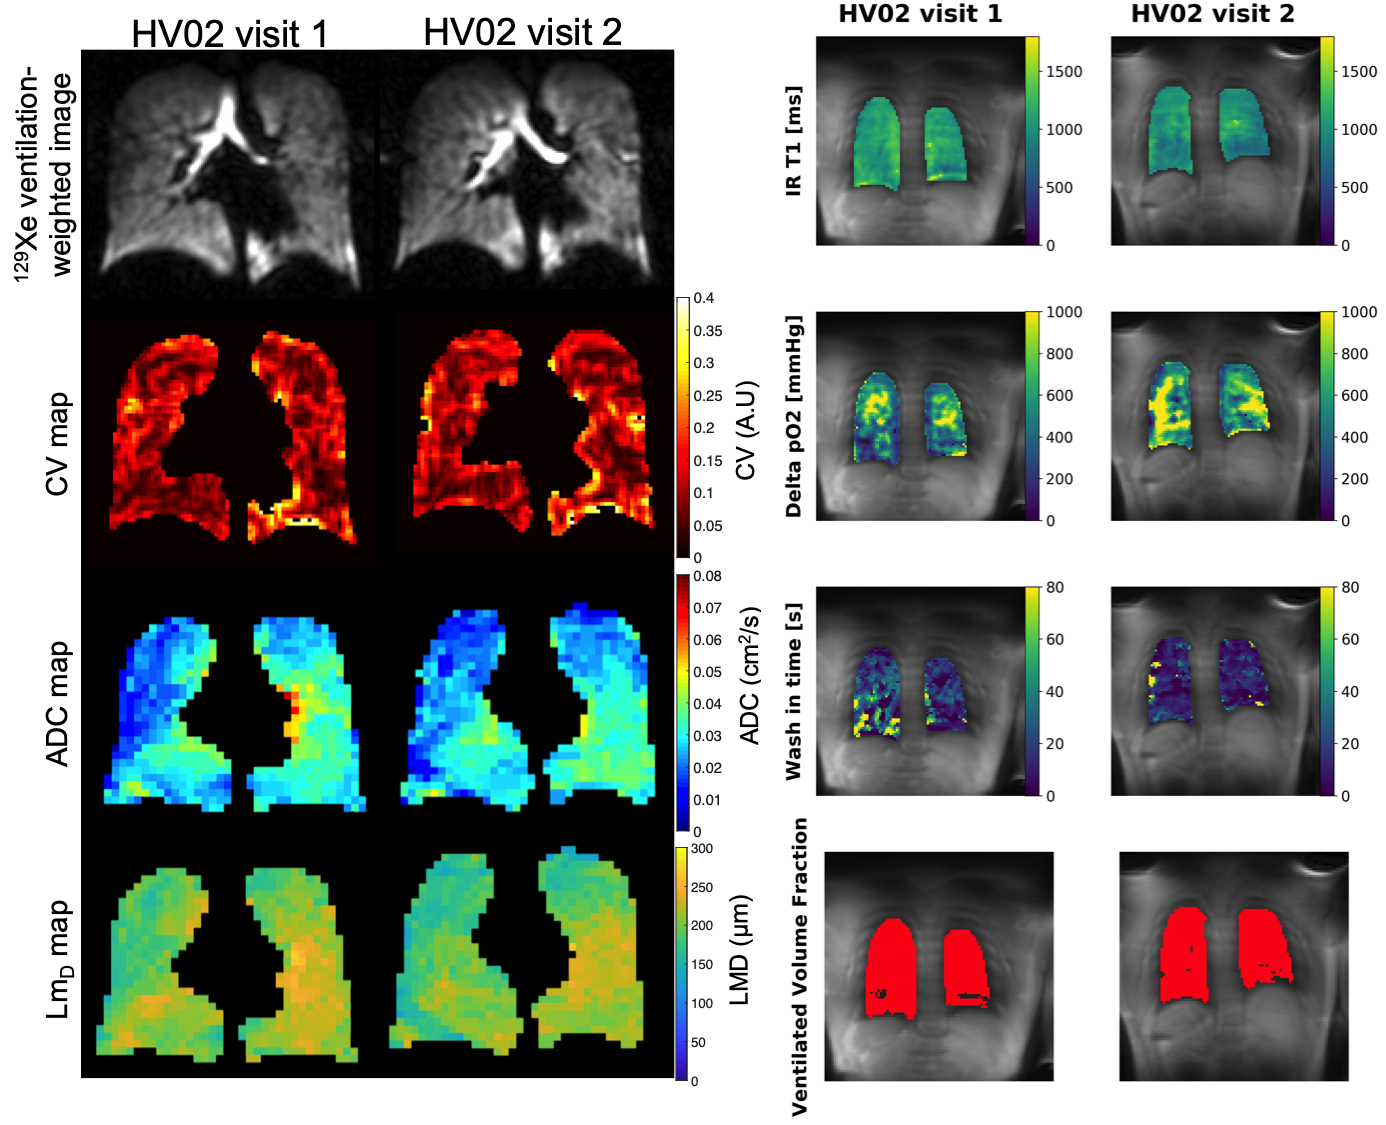
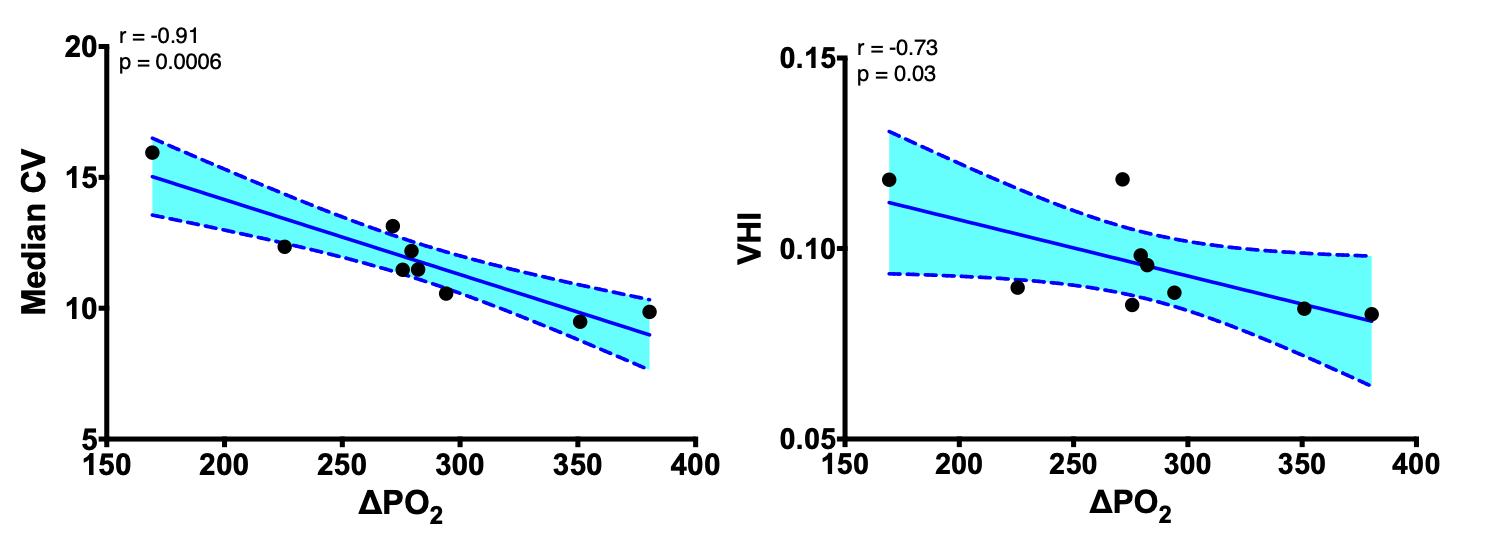
All volunteers tolerated both 129Xe and OE scanning with no adverse events. An example of the obtained parameter maps (129Xe left, OE right) in one 29 year old healthy volunteer is given in Figure 2. Table 1 shows the results of the Bland-Altman analysis (bias±limits of agreement), repeatability metric and paired t-tests/Wilcoxon matched-pairs tests for all considered metrics. Only τup showed a significant change between visits. Significant correlations were observed between ΔPO2 and median CV (r=-0.91, p=0.0006), and ΔPO2 and VHI (r=-0.73, p=0.03) (Figure 3).Discussion
All 129Xe metrics had bias close to zero, as assessed by Bland-Altman analysis, with ADC, LmD and RBC:TP being the most repeatable. Furthermore, all 129Xe metrics had narrow limits of agreement suggesting these metrics to be suitable for longitudinal assessment of patients. OE-VVF was the most repeatable OE-MRI metric, with the remaining three having reasonable repeatability, strongly influenced by one subject (HV03) who showed large variability between visits. The existence of a correlation between ΔPO2 and 129Xe ventilation heterogeneity measures in healthy volunteers requires further investigation.Conclusions
129Xe and OE MRI metrics are reproducible and it is feasible to acquire images using both methods in volunteers.Acknowledgements
The research leading to these results received funding from the Innovative Medicines Initiatives 2 Joint Undertaking under grant agreement No 116106. This Joint Undertaking receives support from the European Union’s Horizon 2020 research and innovation programme and EFPIA. This work was also supported by the NIHR (RP-R3-12-027), MRC (MR/M008894/1) and GlaxoSmithKline (PJCH:BIDS3000032592).References
1. Chan Ho-Fung et al., “3D Diffusion-Weighted 129Xe MRI for Whole Lung Morphometry” Magnetic Resonance in Medicine 79 (2018): 2986-2995
2. Stewart, Neil J., et al. “Comparison of 3He and 129Xe MRI for evaluation of lung microstructure and ventilation at 1.5T”Journal of Magnetic Resonance Imaging 48.3 (2018): 632-642 3
. Smith, Laurie et al., “Patterns of regional lung physiology in cystic fibrosis using ventilation magnetic resonance imaging and multiple-breath washout” European Respiratory Journal 8.52(5) (2018)
4. Weatherley, Nicholas D. et al., “Hyperpolarised xenon magnetic resonance spectroscopy for the longitudinal assessment of changes in gas diffusion in IPF” Thorax 74.5 (2018): 500-502
5. Zhang, Wei-Juan, et al. "Dynamic oxygen-enhanced magnetic resonance imaging of the lung in asthma—Initial experience." European journal of radiology 84.2 (2015): 318-326
6. Martini, K., et al. "Volumetric dynamic oxygen-enhanced MRI (OE-MRI): comparison with CT Brody score and lung function in cystic fibrosis patients." European radiology 28.10 (2018): 4037-4047.
7. Norquay, Graham, et al. “129Xe-Rb Spin-Exchange Optical Pumping with High Photon Efficiency” Physical Review Letters 121.15 (2018):153201-1:153201-5
8. Hughes, Paul J.C. et al., “Spatial fuzzy c-means thresholding for semiautomated calculation of percentage lung ventilated volume from hyperpolarized gas and 1 H MRI” Journal of Magnetic Resonance Imaging 47.3 (2017): 640-646
9. Avants, Brian B., et al. "A reproducible evaluation of ANTs similarity metric performance in brain image registration." Neuroimage 54.3 (2011): 2033-2044.
10. Galbraith, Susan M., et al., “Reproducibility of dynamic contrast-enhanced MRI in human muscle and tumours: comparison of quantitative and semi-quantitative analysis” NMR in Biomedicine 15 (2002): 132-142
Figures