2304
Comparison of Capability for Therapeutic Effect Prediction between CEST Imaging and FDG-PET/CT in NSCLC Patients with Chemoradiotherapy1Radiology, Fujita Health University School of Medicine, Toyoake, Japan, 2Radiology, Kobe University Graduate School of Medicine, Kobe, Japan, 3Canon Medical Systems Corporation, Otawara, Japan, 4Diagnostic Radiology, Hyogo Cancer Center, Akashi, Japan
Synopsis
No major repots have been evaluated the capability for therapeutic effect evaluation or prediction by chemical exchange saturation transfer (CEST) imaging and compared with FDG-PET/CT. We hypothesized that CEST imaging had equal or better potential for therapeutic effect evaluation and prediction in non-small cell lung cancer (NSCLC) patients with conservative therapy, when compared with FDG-PET/CT. The purpose of this study was to directly and prospectively compare the capability for prediction of therapeutic effect for chemoradiotherapy between CEST imaging and FDG-PET/CT in NSCLC patients.
Introduction
In the last a few decades, several investigators have suggested that therapeutic effect prediction and/or assessment in non-small cell lung cancer (NSCLC) patients after conservative therapy could be performed with positron emission tomography (PET) or PET combined with CT (PET/CT) using 2-[fluorine-18]-fluoro-2-deoxy-D-glucose (FDG) as one of the metabolic imaging. In contrast to FDG-PET or PET/CT, chemical exchange saturation transfer (CEST) imaging at 3.5 ppm has been suggested as the new technique for MR-based molecular imaging and reported as having the potential for diagnosis of thoracic lesions (1, 2). However, no major repots have been evaluated the capability for therapeutic effect evaluation or prediction by CEST imaging and compared with FDG-PET/CT. We hypothesized that CEST imaging had equal or better potential for therapeutic effect evaluation and prediction in NSCLC patients with conservative therapy, when compared with FDG-PET/CT. The purpose of this study was to directly and prospectively compare the capability for prediction of therapeutic effect for chemoradiotherapy between CEST imaging and FDG-PET/CT in NSCLC patients.Materials and Methods
32 consecutive and pathologically diagnosed stage III NSCLC patients (18 males and 14 females; mean age 73 year) underwent CEST imaging at a 3T MR system (Vantage Titan 3T, Canon Medical Systems Corporation, Otawara, Japan), FDG-PET/CT, and chemoradiotherapy and follow-up examinations. According to the results of follow-up examinations including pathological examinations, all patients were divided into responder (n=7) and non-responder (n=25) groups. To obtain CEST data in each subject, respiratory-synchronized FASE imaging was conducted following a series of magnetization transfer (MT) pulses. Then, magnetization transfer ratio asymmetry at 3.5 ppm (MTRasym at 3.5ppm) was calculated from z-spectra in each pixel, and MTRasym at 3.5ppm map was computationally generated. Then, MTRasym at 3.5ppm and SUVmax in each primary lesion were measured by ROI measurements. To compare all indexes between two groups, Student’s t-test was performed. To investigate the discriminating factors of two groups, multivariate logistic regression analyses were performed. Then, ROC-based positive test was performed to determine each feasible threshold value for distinguishing responder from non-responder groups. When applied each threshold value, differentiation capability was compared between MTRasym at 3.5ppm and SUVmax by means of McNemar’s test. Finally, disease free survival between responders and non-responders assessed by each index was compared by Kaplan-Meier method followed by log-rank test. A p value less than 0.05 was considered as significant in this study.Results
Representative cases are shown in Figures 1. There were significant differences between responder and non-responder groups on MTRasym at 3.5ppm (responders vs. non-responders: -2.4±1.1 vs. -0.6±1.1, p=0.0004) and SUVmax (responders vs. non-responders: 4.2±0.6 vs. 7.0±2.9, p=0.02). Multivariate regression analyses identified MTRasym at 3.5ppm (Odds ratio [OR]=4.1, p=0.007) and SUVmax (OR=17.2, p=0.02) as significant. Results of ROC analyses and diagnostic performance comparison for distinguishing responder from non-responder groups are shown in Figure 2. There were no significant differences of area under the curve, sensitivity, specificity and accuracy between MTRasym at 3.5ppm and SUVmax (p>0.05). Disease free survivals between two groups had significant differences on MTRasym at 3.5ppm (responders vs. non-responders: 23.4±3.5 months vs. 14.4±1.5 months, p=0.01) and SUVmax (responders vs. non-responders: 26.0±3.5 months vs. 14.7±1.3 months, p=0.004).Conclusion
CEST imaging has a potential for predicting therapeutic effect of chemoradiotherapy and considered at least as valuable as FDG-PET/CT in NSCLC patients.Acknowledgements
Authors wish to thank Mr. Katsusuke Kyotani and Prof. Takamichi Murakami in Kobe University Hospital for their valuable contributions to this study.References
- Ohno Y, Yui M, Koyama H, et al. Radiology. 2016; 279(2): 578-589.
- Ohno Y, Kishida Y, Seki S, et al. J Magn Reson Imaging. 2018; 47(4): 1013-1021.
Figures
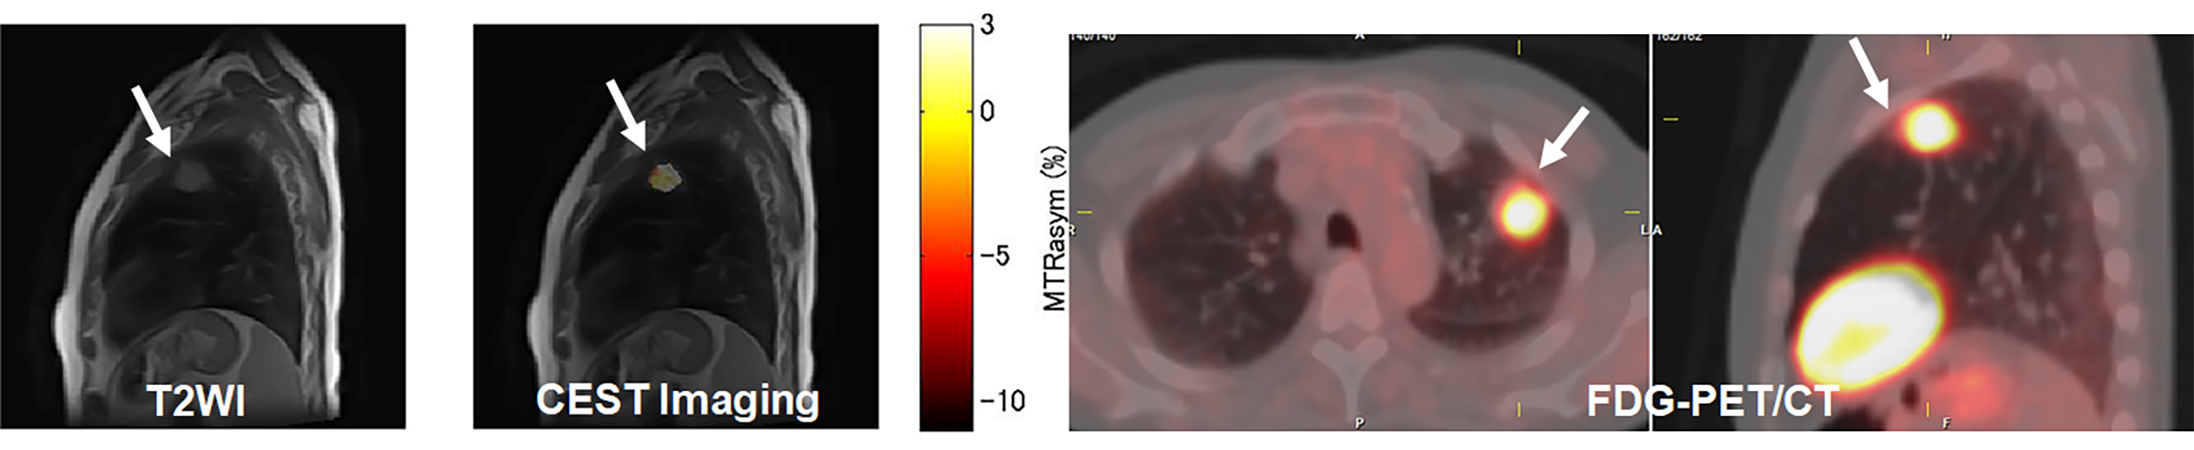
Figure 1. 72-year old invasive adenocarcinoma with Stage IIIA.
Invasive adenocarcinoma (arrow) is shown in the left upper lobe on T2-weighted imaging (T2WI), CEST imaging and FDG-PET/CT. MTRasym at 3.5ppm and SUVmax in this case were 1.8 and 15.7. When applied each threshold value, this case was assessed as non-responder and true-negative case.
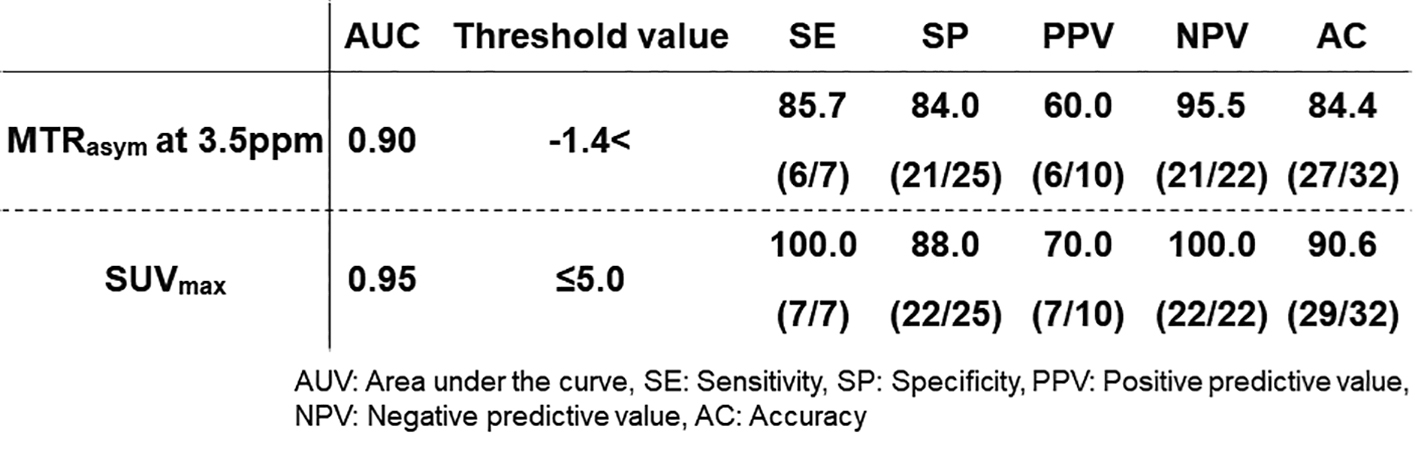
Figure 2. Results of ROC analyses and diagnostic performance comparisons for distinguishing responders from non-responders.
Area under the curve had no significant difference (p>0.05). When applied each threshold value, sensitivity, specificity and accuracy had significant differences between MTRasym at 3.5ppm and SUVmax (p>0.05).