2297
Pulmonary Ventilation Analysis Using Motion-Resolved Ultrashort Echo (UTE) MRI1Graduate Program in Bioengineering, UC Berkeley - UCSF, San Francisco, CA, United States, 2Department of Radiology and Biomedical Imaging, University of California, San Francisco, San Francisco, CA, United States
Synopsis
Pulmonary ventilation analysis using motion-resolved 1H UTE MRI with tissue deformation-based and signal intensity-based methods was conducted for the first time. The ventilation maps derived from both approaches are consistent with each other on healthy volunteers and a pediatric subject with lung abnormality.
Introduction
1H MRI is gaining more attention in pulmonary imaging because it can provide both structural and functional information (1). Compared to existing ventilation quantification methods such as pulmonary function testing (PFT), computed tomography (CT) and hyperpolarized noble gas MRI, 1H MRI offers local functionality via ventilation analysis, is non-ionizing, and does not require special equipment. The volume change between end-inspiration and end-expiration phases is a straightforward ventilation quantification approach. The recently developed motion-resolved 3D free-breathing pulmonary MRI enables the separation of respiratory states (2). Thus, the volume change can be assessed by the lung tissue deformation and intensity variation across the different respiratory phases. In this study, we aim to quantify ventilation with free-breathing motion-resolved 3D 1H UTE lung MRI through the tissue deformation-based Jacobian determinant method (3), and the intensity-based specific ventilation (SV) method (4). We further compare the ventilation maps derived from UTE lung MRI with the ventilation results using modified Phase-Resolved Functional Lung (PREFUL) MRI (5).Methods
Five healthy volunteers (age 26-30, 2 females 3 males) and one subject with bronchiolitis obliterans (age 11, female) were included in this feasibility study. All images were acquired on a 3T MR750 clinical scanner (GE Healthcare, Waukesha, WI) with an 8-channel cardiac phased-array coil. An SNR optimized 3D radial UTE sequence (6) with golden-angle ordering (7) (Fig. 1a) was adopted during free-breathing (FOV = 32-40cm, pixel size = 1.5-2.5mm isotropic). A 2D SPGR with 250 temporal frames were acquired for the modified PREFUL analysis with FOV = 48cm, resolution = 2.5mmx2.5mmx15mm, temporal resolution = 261ms.The ventilation analysis pipeline for 3D UTE MRI is illustrated in Figure 1. Four respiratory phases between end-inspiration and end-expiration are reconstructed by the self-navigating (Fig. 1b) motion-resolved reconstruction method (2). The deformation field from the end-inspiration state (Fig. 1c) to the end-expiration state (Fig. 1d) is calculated by non-rigid registration via Advanced Normalization Tools (ANTs) (8,9). The tissue deformation-based approach measures the volume change of each voxel with the Jacobian determinant (JD) (3,10) (Fig. 1e), defined as
$$JD = \frac{V_{insp}}{V_{expi}} = \left |\det \left [Id + \frac{\partial (D_x, D_y, D_z)}{\partial (x,y,z)} \right] \right|$$
where $$$V_{expi}, V_{insp}$$$ are the volume at end-expiratory and end-inspiratory state. $$$D$$$ is the deformation field, $$$x,y,z$$$ are the spatial dimensions and $$$Id$$$ is the 3-by-3 identity matrix. The intensity-based approach is quantified by specific ventilation (SV) (4), defined as
$$SV = \frac{V_{insp} - V_{expi}}{V_{expi}} = \frac{S_{expi} - S_{insp}}{S_{insp}}$$
where $$$S_{expi}, S_{insp}$$$ are the signal intensity of each voxel in the registered expiratory and inspiratory image (Fig. 1f). The modified PREFUL (5) method is described in figure 2. Time-series images (Fig. 2a) are reordered according to the diaphragm position (Fig. 2b) to recover one high temporal resolution respiratory cycle (Fig. 2c-d). Time-to-peak (Fig. 2e) and specific ventilation (Fig. 2f) are calculated for ventilation quantifications.
Results
Figure 3 shows two coronal and two sagittal slices in a motion-resolved 3D ventilation map volume of a healthy subject. The volume change profile indicates that the posterior region is better ventilated than the anterior region, as expected in the supine position.Figure 4 shows one coronal slice motion-resolved ventilation map from a healthy volunteer and a subject with bronchiolitis obliterans, calculated by the Jacobian determinant and specific ventilation method respectively. The images show most parenchyma areas of the healthy subject are expanding during inhalation. The lobular histograms of the healthy volunteer overlap with each other, indicating good consistency across regions. For the pediatric subject with bronchiolitis obliterans, the right lung has significantly lower values in both ventilation maps, indicating the right lung is less ventilated than the left lung.
Figure 5 compares the ventilation maps on 3D UTE and 2D PREFUL datasets on healthy volunteers. For tissue deformation-based and intensity-based approaches, the healthy lung tissues are expanding (greater than 1 and 0 respectively) homogeneously. The ventilation time-to-peak (V-TTP) measures the parenchyma motion delay relative to the diaphragm. A V-TTP value of π (or 50%) means concurrent movement with diaphragm thus suggests healthy tissues. The ventilation maps derived from 2D and 3D images yield similar patterns despite the different ranges.
Discussion
The Jacobian determinant method has better apparent sensitivity while the specific ventilation map appears more homogeneous. The vasculature exhibits lower values in JD while SV ignores them due to smoothing. The range differences between the two methods could be caused by the T2* decay, the receive coil profile or partial volume effects, which need further investigation. The 3D ventilation map handles through-plane motion better than the 2D maps and is more time-efficient. 3D UTE ventilation map can provide 3D spatial ventilation information, while the 2D PREFUL method provides ventilation maps across time.Conclusion
Both the tissue deformation and intensity-based methods reveal ventilation for 3D motion-resolved UTE MRI. The ventilation maps derived from motion-resolved UTE are comparable to that from PREFUL. In the future, we will quantitatively compare the methods and possibly combine them to leverage their advantages.Acknowledgements
This work is supported by NIH grant R01 HL136965.References
- Biederer J, Beer M, Hirsch W, et al. MRI of the lung (2/3). Why... when ... how? Insights Imaging 2012;3:355–371 doi: 10.1007/s13244-011-0146-8.
- Jiang W, Ong F, Johnson KM, et al. Motion robust high resolution 3D free-breathing pulmonary MRI using dynamic 3D image self-navigator. Magn. Reson. Med. 2018;79:2954–2967 doi: 10.1002/mrm.26958.
- Chassagnon G, Martin C, Marini R, et al. Use of Elastic Registration in Pulmonary MRI for the Assessment of Pulmonary Fibrosis in Patients with Systemic Sclerosis. Radiology 2019;291:487–492 doi: 10.1148/radiol.2019182099.
- Sá RC, Cronin M V., Henderson AC, et al. Vertical distribution of specific ventilation in normal supine humans measured by oxygen-enhanced proton MRI. J. Appl. Physiol. 2010;109:1950–1959 doi: 10.1152/japplphysiol.00220.2010.
- Voskrebenzev A, Gutberlet M, Klimeš F, et al. Feasibility of quantitative regional ventilation and perfusion mapping with phase-resolved functional lung (PREFUL) MRI in healthy volunteers and COPD, CTEPH, and CF patients. Magn. Reson. Med. 2018;79:2306–2314 doi: 10.1002/mrm.26893.
- Johnson KM, Fain SB, Schiebler ML, Nagle S. Optimized 3D ultrashort echo time pulmonary MRI. Magn. Reson. Med. 2013;70:1241–1250 doi: 10.1002/mrm.24570.
- Feng L, Axel L, Chandarana H, Block KT, Sodickson DK, Otazo R. XD-GRASP: Golden-angle radial MRI with reconstruction of extra motion-state dimensions using compressed sensing. Magn. Reson. Med. 2016;75:775–788 doi: 10.1002/mrm.25665.
- Avants BB, Tustison NJ, Song G, Cook PA, Klein A, Gee JC. A reproducible evaluation of ANTs similarity metric performance in brain image registration. Neuroimage 2011;54:2033–2044 doi: 10.1016/j.neuroimage.2010.09.025.
- Avants BB, Epstein CL, Grossman M, Gee JC. Symmetric diffeomorphic image registration with cross-correlation: Evaluating automated labeling of elderly and neurodegenerative brain. Med. Image Anal. 2008;12:26–41 doi: 10.1016/j.media.2007.06.004.
- Castillo R, Castillo E, Martinez J, Guerrero T. TU‐B‐204B‐04: Ventilation from Four Dimensional Computed Tomography: Density versus Jacobian Methods. Med. Phys. 2010;37:3377 doi: 10.1118/1.3469193.
Figures

Figure 1. Pipeline for Motion-Resolved Reconstruction with Distortion-Based and Intensity-Based Ventilation Maps.
a) Optimized 3D ultrashort echo time acquisition with golden angle radial trajectory. b) Dividing the respiratory cycle into 4 motion states according to the DC component in k-space. c-d) Motion-resolved volume at end-inspiration and end-expiration. e) Tissue deformation-based Jacobian determinant. f) Signal intensity-based specific ventilation.
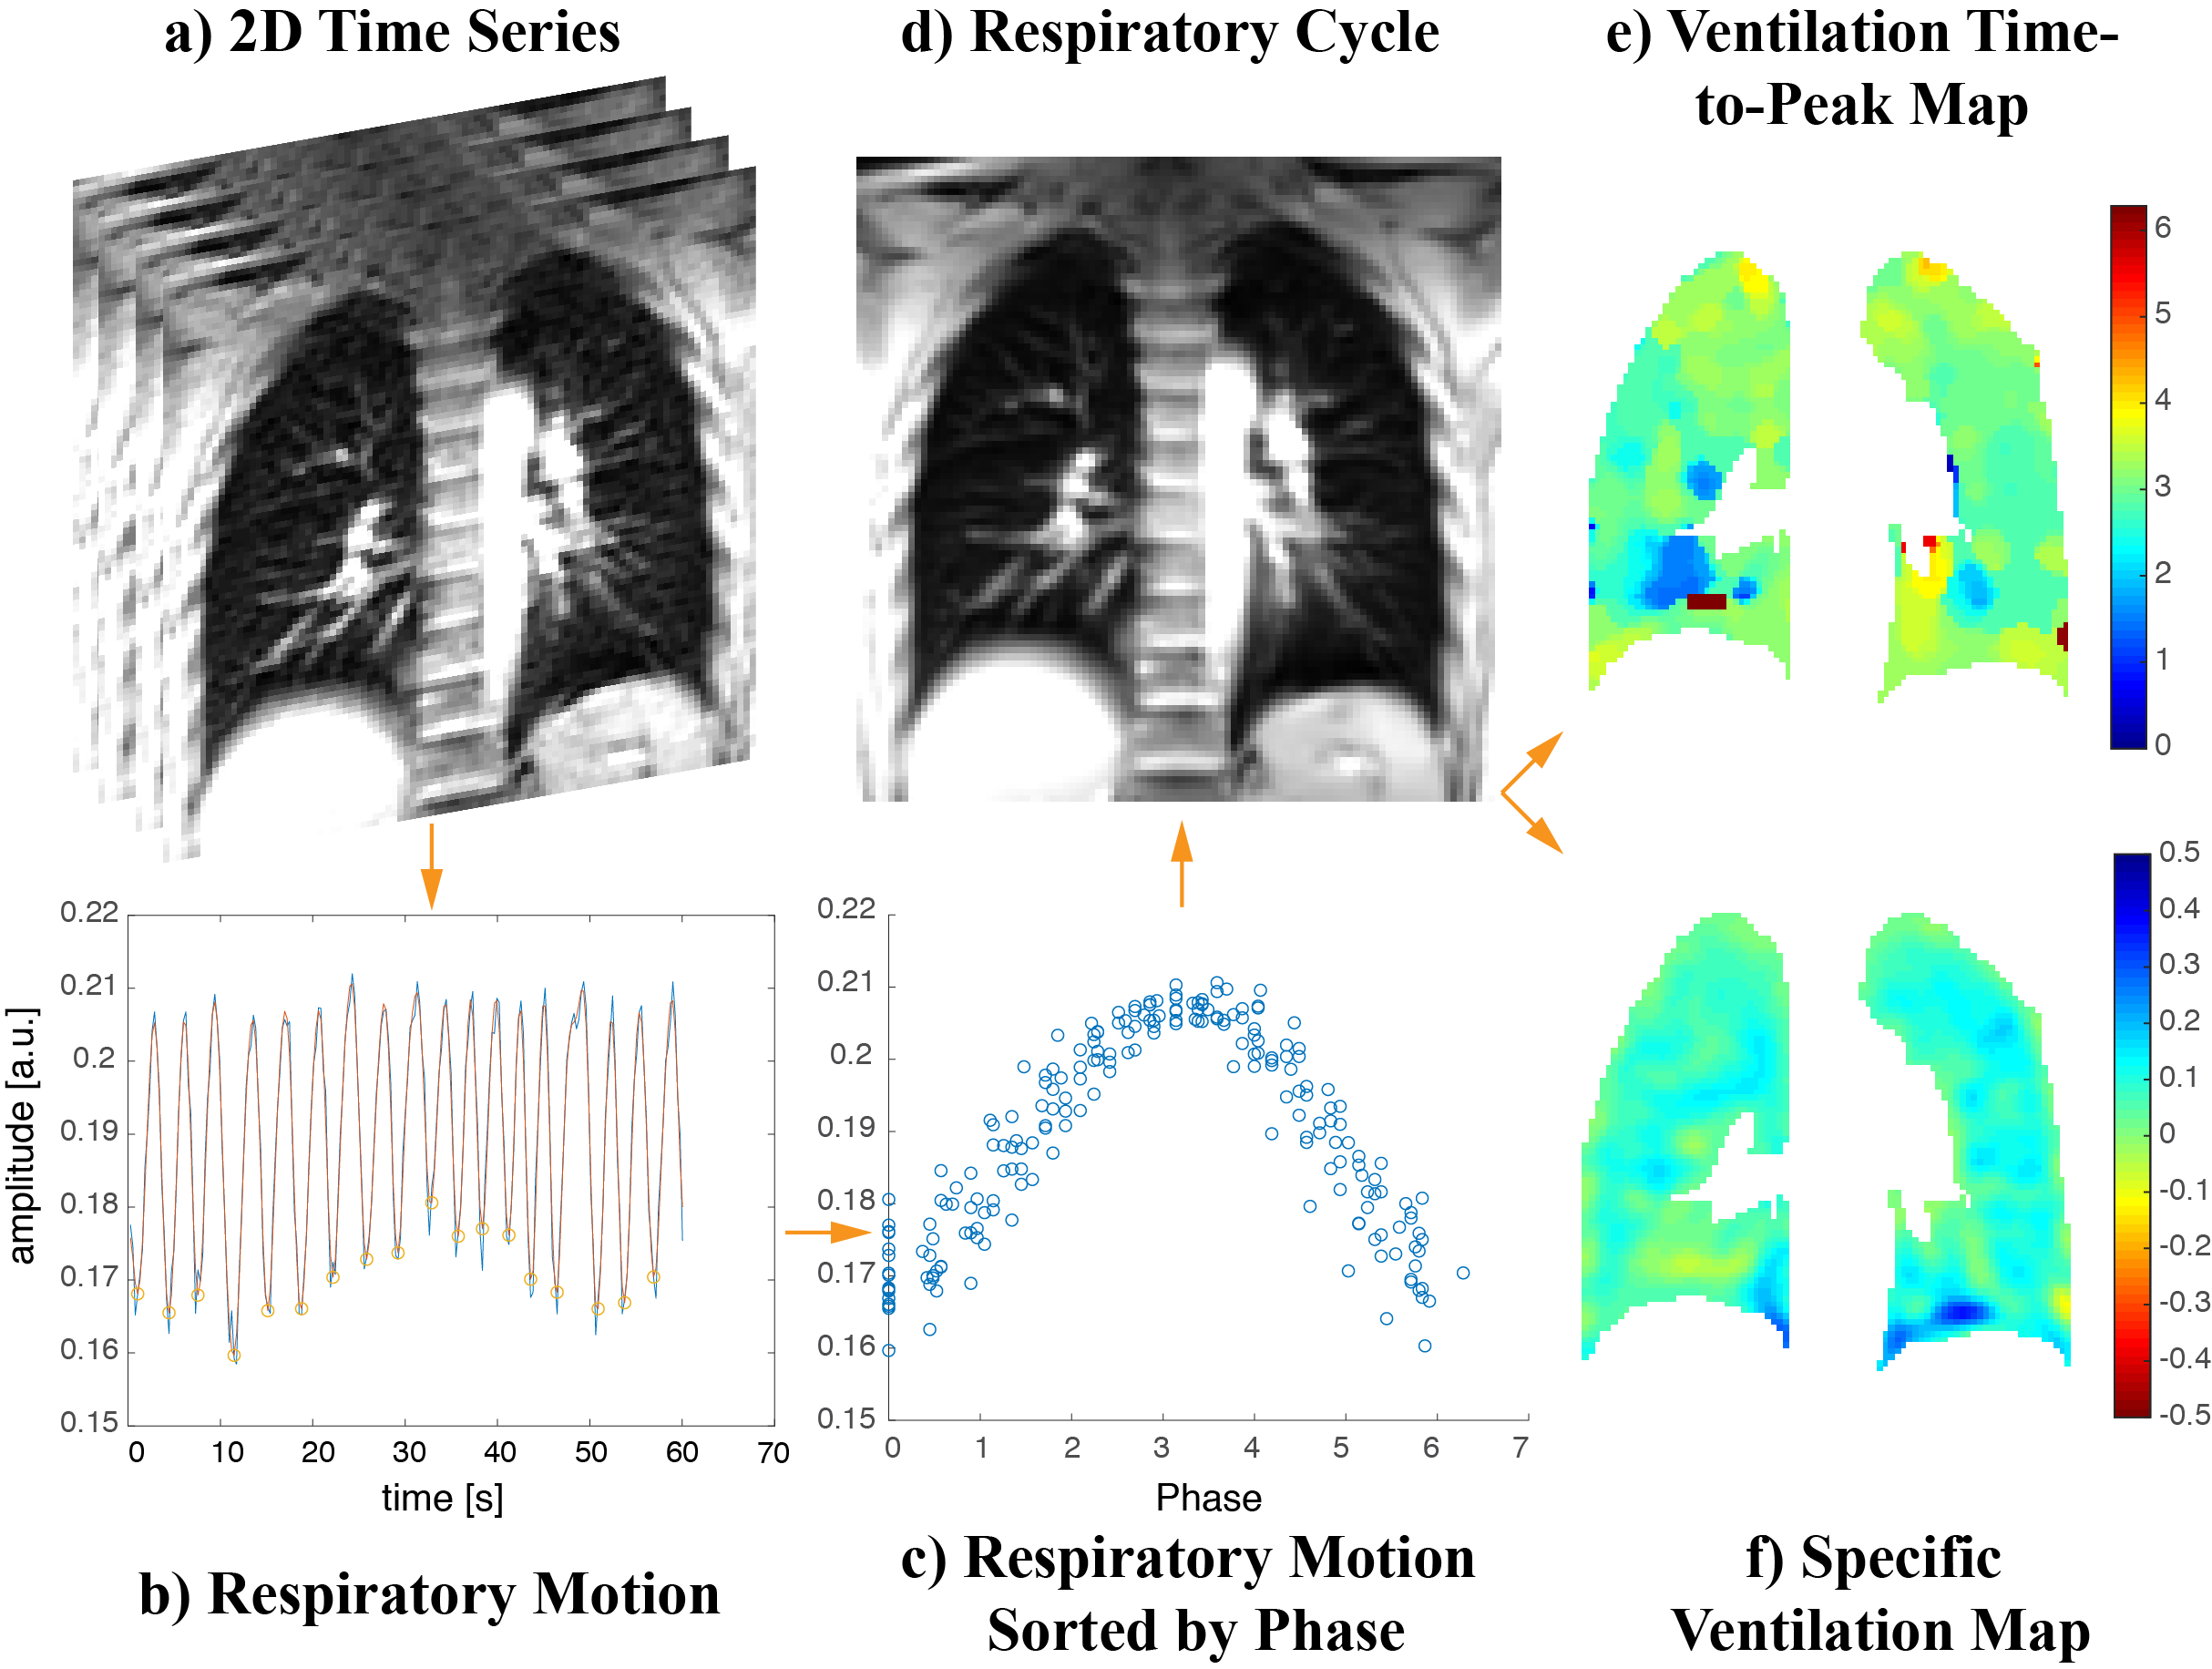
Figure 2. Pipeline for Modified Phase-Resolved Functional Lung (PREFUL) MRI Reconstruction with Ventilation Time-to-Peak and Specific Ventilation Maps.
a) 2D time-series images. b) The respiratory motion is extracted from the average intensity within a bounding box around the diaphragm. c) The curve is sliced by the valleys and assigned to phases between 0 - 2π. d) Time-series images sorted into a single respiratory cycle by the corresponding phase. e) Ventilation time-to-peak (V-TTP) map. f) Specific ventilation map calculated by the end-inspiration and end-expiration phases.
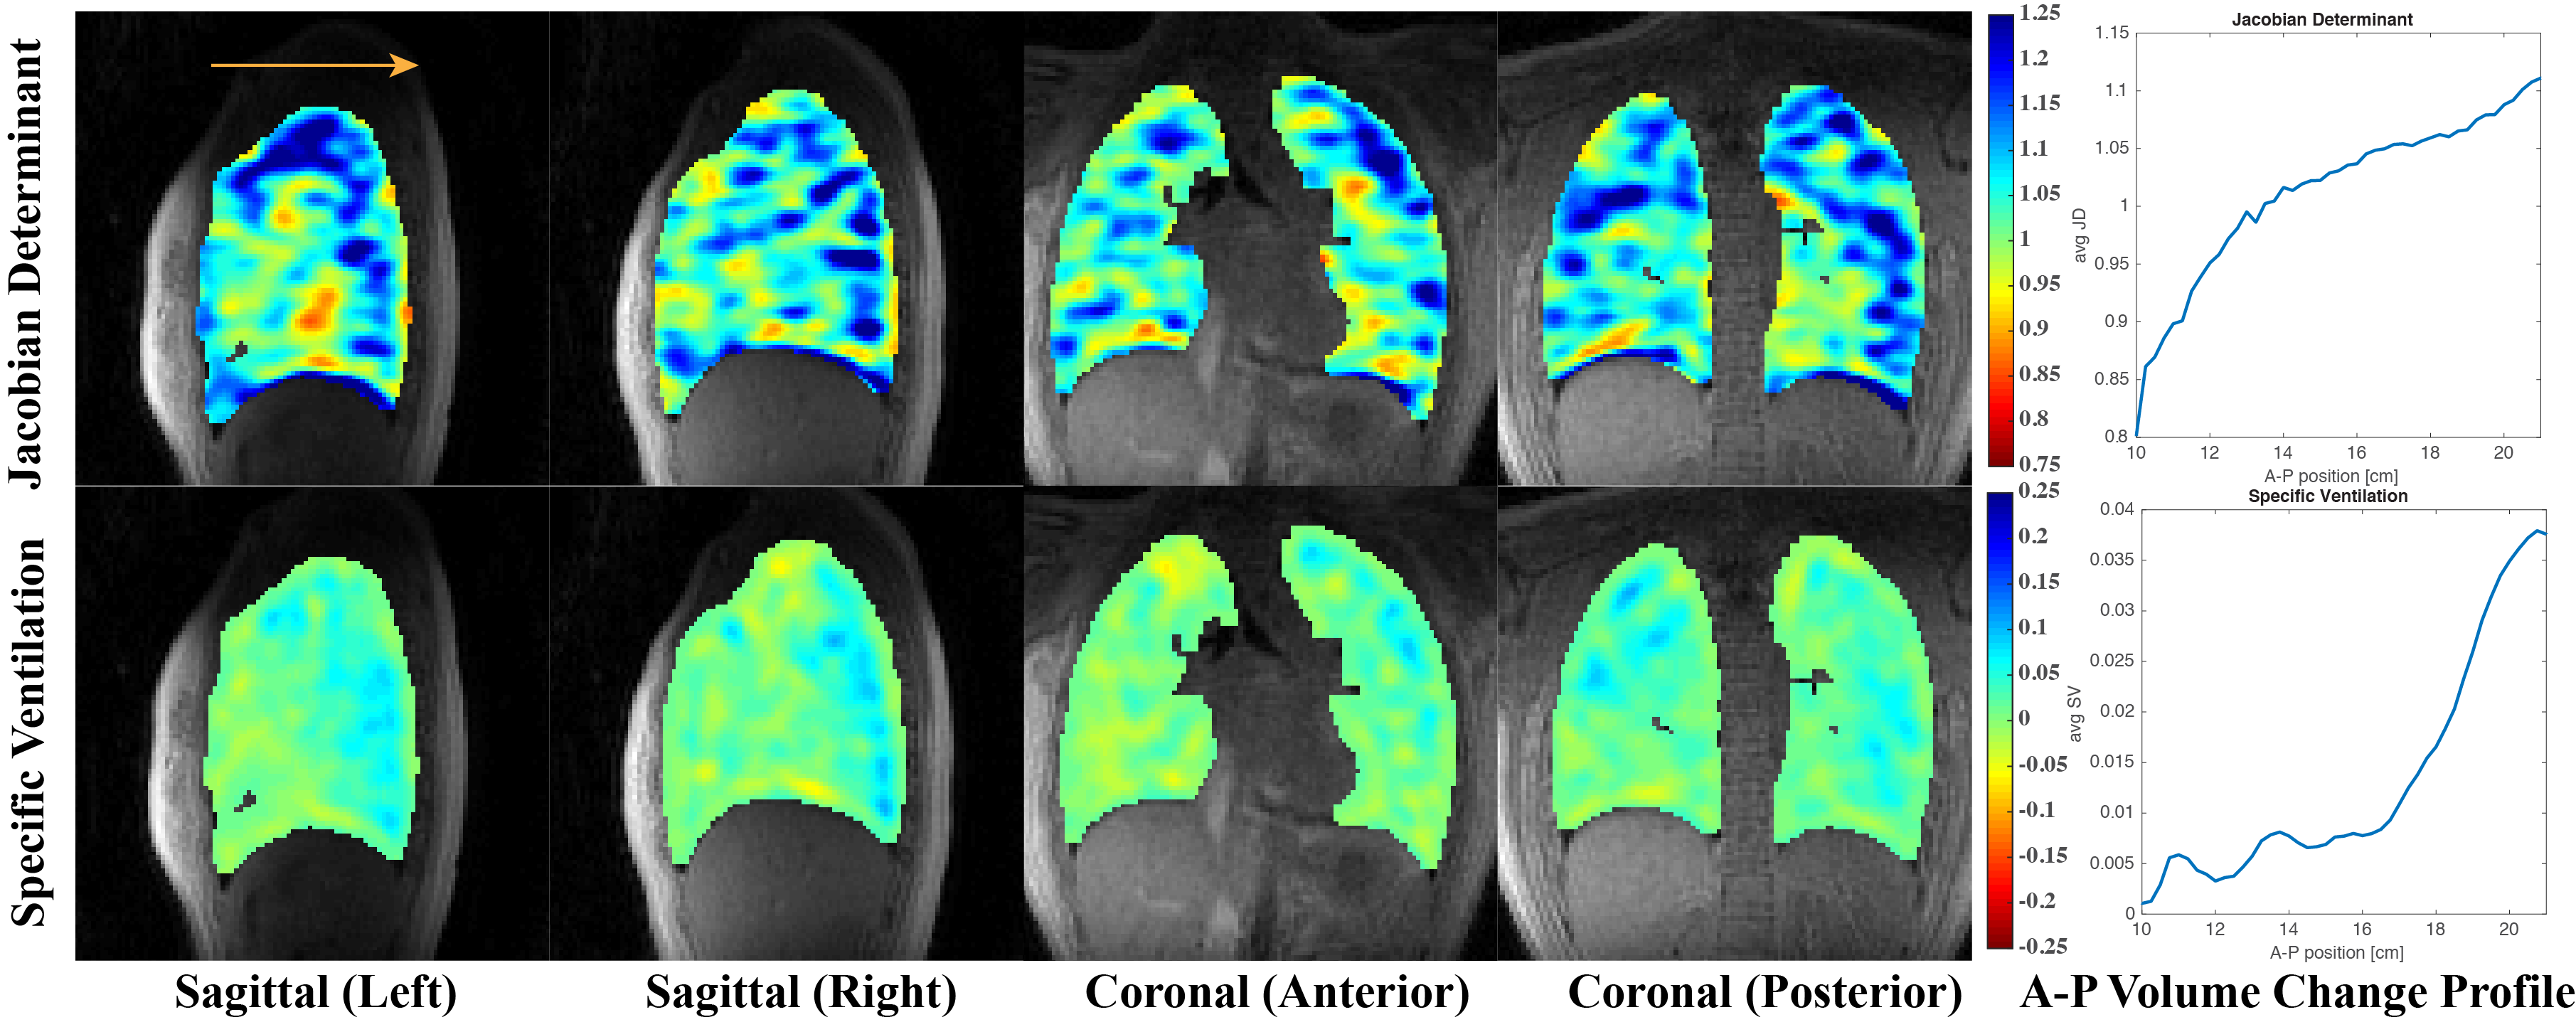
Figure 3. Demonstration of 3D UTE Ventilation Maps in a Healthy Volunteer.
The Jacobian determinant reflects the relative volume in inspiration compared to expiration. JD > 1 means expansion while JD < 1 means contraction. Specific ventilation is the percentage volume change across inhalation and exhalation. SV > 0 corresponds to expansion and SV < 0 corresponds to contraction. A ventilation gradient is observed in the anterior-posterior direction (arrow) for both methods.
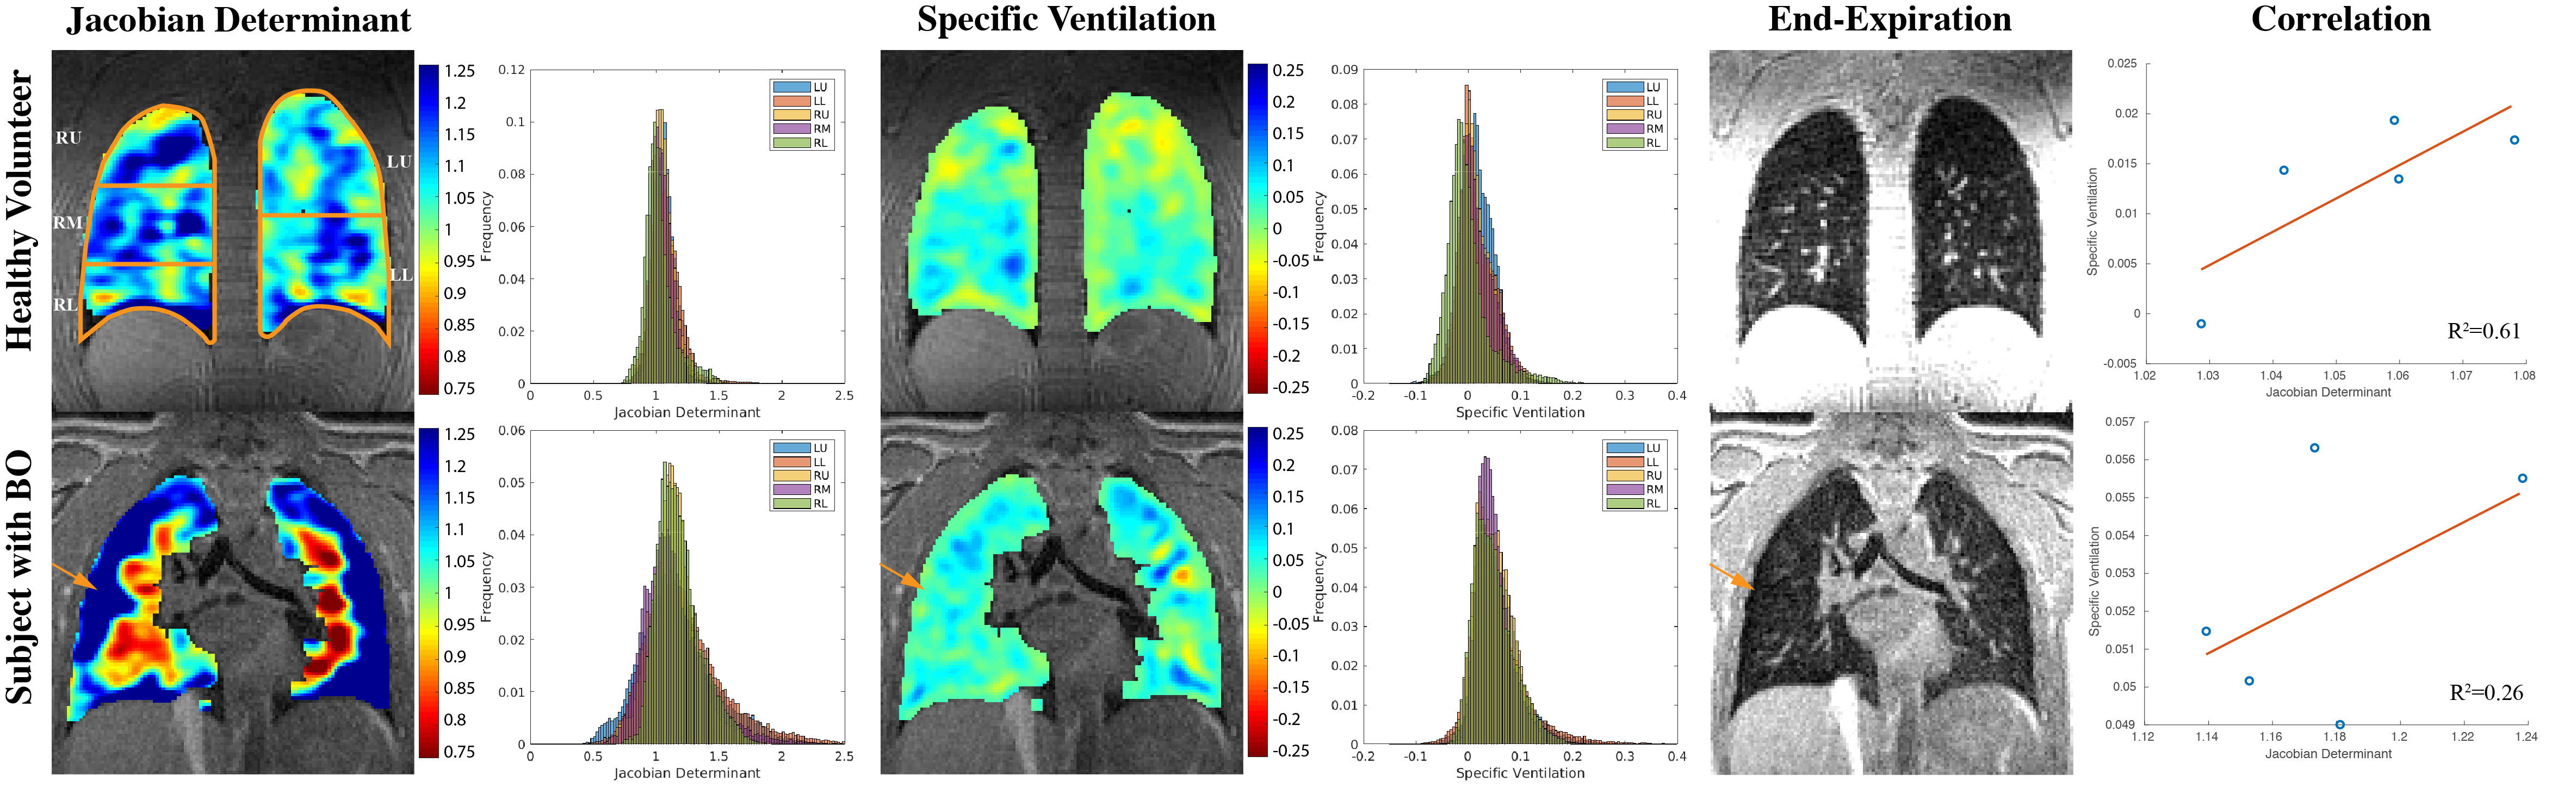
Figure 4. Motion-Resolved UTE Ventilation Maps of a Healthy Volunteer (26 yo) and a Pediatric Subject with Bronchiolitis Obliterans (11 yo).
The ventilation histograms are plotted lobe-wise. As for the subject with bronchiolitis obliterans, the lower values in both ventilation maps in the right lung where there was hypointensity on UTE (arrow, also observed on CT) indicate that it is less ventilated than the left lung. The two methods are strongly correlated in the healthy subject and weakly correlated in the subject with BO.

Figure 5. Motion-Resolved UTE and PREFUL Ventilation Maps of the Same Healthy Volunteer.
a) The motion-resolved Jacobian determinant ventilation map shows a 25% maximum volume expansion during tidal breathing. b) The motion-resolved specific ventilation map shows a 15% maximum volume change. c) V-TTP is the phase that the intensity of a voxel reaches climax in a respiratory cycle. d) Specific ventilation map using 2D time-series PREFUL MRI. e) Correlation between 3D UTE JD and SV. f) Correlation of specific ventilation between similar slices in 3D motion-resolved UTE and 2D PREFUL.