2295
Imaging Hyperpolarized Xe Changes in the Lung Over a Breathing Cycle Using a Dynamic CSI
Tahmina Achekzai1, Stephen J Kadlecek1, Kai Ruppert1, Luis Loza1, Faraz Amzajerdian 1,2, Yi Xin1,2, Ian Duncan1, and Rahim R. Rizi1
1Radiology, University of Pennsylvania, Philadelphia, PA, United States, 2Bioengineering, University of Pennsylvania, Philadelphia, PA, United States
1Radiology, University of Pennsylvania, Philadelphia, PA, United States, 2Bioengineering, University of Pennsylvania, Philadelphia, PA, United States
Synopsis
We demonstrated a new imaging technique capable of quantifying Xe gas uptake into airways and parenchyma over the course of a breathing cycle. Current imaging techniques acquire entire images at a single breathing point. These methods may not replicate organ function during tidal breathing, and could potentially miss diagnostically important dynamic information depending on the time of acquisition. This sequence traverses the k-space over a series of 576 breaths to produce 12 images at different time points. Three healthy rats were imaged, and Xe signal was found to fluctuate at different times and amplitudes depending on respective lung compartment.
Introduction
Current hyperpolarized gas imaging techniques rely on obtaining a static representation of the lung, typically by acquiring images of gas distribution at either end-expiration or end-inspiration, often requiring a breath-hold. While these techniques can provide valuable insight into ventilation, gas uptake and perfusion, they may not replicate organ function during tidal breathing, and could potentially miss diagnostically important dynamic information depending on when the images are acquired. Here, we introduce an imaging technique for visualizing gas uptake and dissolved-phase 129-Xe distribution over the course of a full breath-cycle and use it to track temporal dynamics of ventilation and pulmonary blood flow in a rodent model.Methods:
Imaging was performed in 3 healthy Sprague-Dawley rats (approx 400-500 g). Animals were intubated and ventilated at 47 breaths / min with a mixture of oxygen and nitrogen until imaging began, when the gas mixture was switched to 30% O2; 70% Xe. Ventilation was performed using a custom-made animal ventilator. Gas tidal volume was set equal to the Functional Residual Capacity as determined from end-exhale micro-CT images (Trifoil Imaging), as in 1.All studies were approved by the UPenn Institutional Animal Care and Use Committee. Images were acquired using a Siemens Avanto 1.5T MRI with a custom 14 cm ID transmit/receive birdcage coil (Stark Contrast, Erlangen, Germany) tuned to the 129Xe frequency of 17.60 MHz. Hyperpolarized xenon (86% 129Xe) was polarized using a commercial system (XeBox-E10, Xemed LLC, Durham, NH). At the beginning of each study, a 2D multi-slice GRE image was acquired (2 slices, 6° flip angle, matrix size 48x36, TR/TE 12/3.9 ms), applying 8 wash-in breaths of Xe/O2 and a breath-hold, to ensure sufficient signal.
A dynamic 2D projection CSI sequence was acquired over the course of 576 breaths; each breath, a single point in k-space was sampled 12 times at different phases of the respiratory cycle. A 2-ms Gaussian RF excitation pulse with flip angle 90° at the center frequency of +202 ppm was used to generate a free induction decay. The narrow bandwidth of the pulse ensured a small flip angle (< 2°) at the gas frequency (0 ppm). Other imaging parameters included: TR/TE, 106/1.8 ms; FOV 40 mm; matrix size 24x24, 512 sampling points, bandwidth 16.4 kHz.
Results
Figure 1 displays 129-Xe images of the lungs at 3 of the 12 time points acquired: at the start of inhalation, end-inhalation, and during exhalation. Spectral components were integrated at the respective chemical shifts to produce maps for each lung compartment: Xe in the gas phase, Xe dissolved in tissue/plasma, Xe bound to hemoglobin in red blood cells (RBC), and their ratios. These images show significant signal variation based on breathing stage, with the gas signal increasing until end-inhale and decreasing drastically thereafter, as expected. The signal of Xe dissolved in tissue/plasma and bound to red blood cells exhibit a smaller variation. Xe signal in RBC is lowest at end-inhale and highest close to end-exhale. Xe in tissue exhibits nearly opposite behavior, with signal lowest near end-exhale. The RBC:tissue ratio map shows that Xe signal in RBC is consistently higher than in tissue, but levels out at end-inhale due to the diminishing RBC Xe signal.Figure 2 shows the sum of global Xe signals in each compartment plotted over the breathing cycle for all three rats, showing clearly that maximum Xe signal intensity in each distinct lung compartment was reached at a different time point in the breathing cycle in each rat. A clear distinction is apparent between timepoints for peak Xe signal in tissue compared to RBC. Maximum tissue signal was reached 106ms, 212ms, and 106ms after maximum gas signal in respective rats; maximum RBC signal was reached 424 ms, 424 ms and 636 ms after end-exhale.
Discussion
These results show that HP Xe imaging is sensitive to both the time required for freshly-inhaled gas to dissolve and to fluctuations in pulmonary blood volume during the breathing cycle.The delay between the two dissolved components is likely due to the effect of intrapulmonary pressure on lung blood volume. At end-inhale, the lung is fully expanded by an external pressure source, compressing capillaries and restricting blood flow from the right heart. Closer to end-exhale, this restriction is removed allowing the capillaries to relax. Blood can flow back in, becoming available for Xe to bind to. This pattern contrasts with the well-established dynamics under free-breathing conditions;2 here, the negative pressure during inhale dilates the vessels of the lung and leads to increased blood volume.
The delay between gas signal and that of Xe dissolved in tissue/plasma is much shorter. Tissue signal is expected to increase with an influx of fresh gas, although some delay is also expected due to the finite time for gas/tissue equilibrium to be established. The observed delay of ~100ms is consistent with previously observed Xe saturation times in lung tissue3.
Conclusion
We demonstrated a new imaging technique capable of improving our understanding of the dynamics of gas uptake into the airways and parenchyma. Deviations from the control model can potentially be used to determine the cause of altered lung function in various disease models.Acknowledgements
References
1. Washko, et al., NEJM 2011 364(10):897-906.2. Dominelli, et al. Exp. Phys. 2017 102(11):1535:1547.3. Driehuys, et al. PNAS 2006 103(48) 18278-18283.Figures
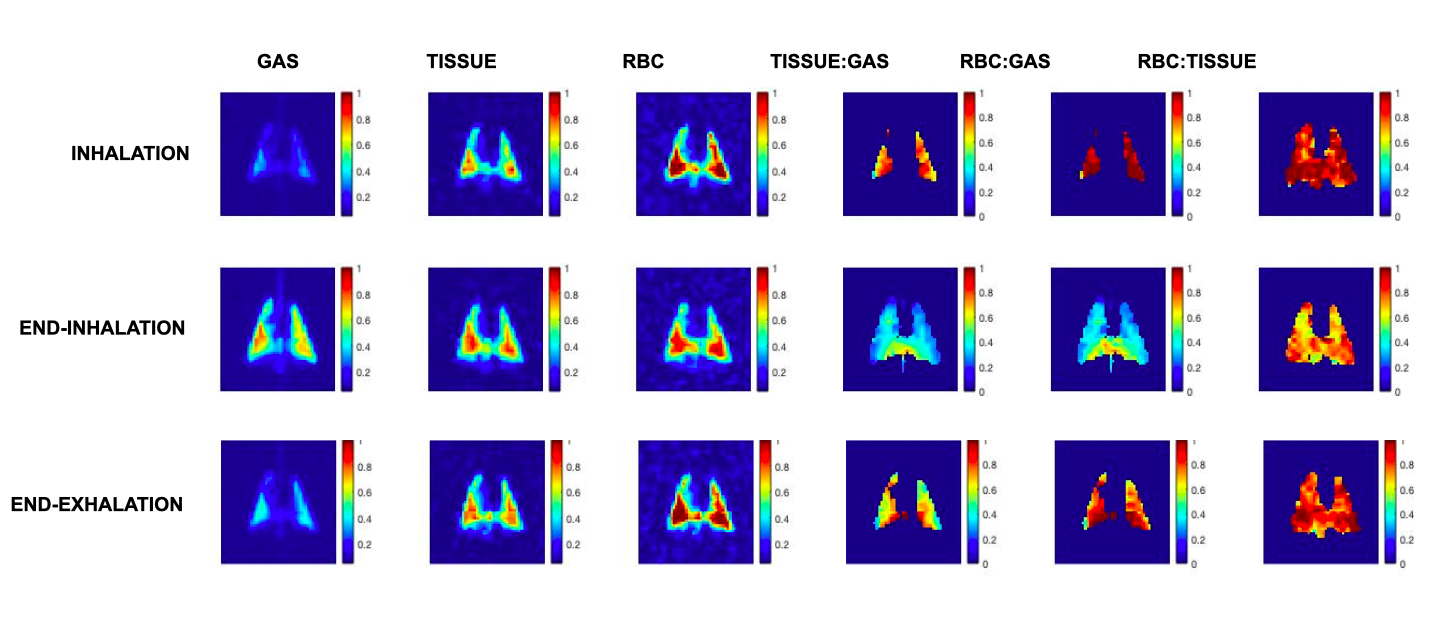
Maps of Xe in gas phase, dissolved in tissue, and bound to red blood cells, and their respective ratios at three of the 12 points acquired in the breathing cycle: during inhalation, at end-inhalation, and during exhalation (top to bottom).

Graphical representation of the total Xe signal in each compartment over time for three healthy rats. These plots demonstrate a visible difference in the time taken to reach maximum intensity for Xe dissolved in lung tissue and Xe bound to red blood cells, and demonstrates different fluctuations in signal intensity for each compartment of the lung.