2294
Quantitative Evaluation of Changes in Lung Compliance Caused by Fibrosis using Hyperpolarized Gas MRI1National Center for Magnetic Resonance in Wuhan, Wuhan Institute of Physics and Mathematics, Innovation Academy of Precision Measurement Science and Technology, Chinese Academy of Sciences-Wuhan National Laboratory for Optoelectronics, Wuhan, China
Synopsis
Pulmonary compliance is generally measured using pulmonary function tests (PFTs) in clinical practice. In this study, we proposed a strategy of quantifying pulmonary compliance (Cst-Xe) using hyperpolarized (HP) 129Xe MRI. The Cst-Xe reliably distinguishes the healthy and bleomycin rats, and was correlated well with pulmonary compliance via PFTs and microstructure parameters via HP 129Xe DWI, respectively. The results have demonstrated the feasibility of HP 129Xe MRI in quantitatively and non-invasively assessing the pulmonary compliance, and also have improved the understanding of the lung compliance changes in fibrosis.
Introduction
As an important monitoring indicator in lung diseases such as ARDS and IPF, pulmonary compliance is widely used to guide the setting of positive end-expiratory pressure of ventilator. Pulmonary compliance is defined as the lung volume change per unit pressure change and is generally measured by pulmonary function tests (PFTs). Hyperpolarized (HP) 129Xe ventilation imaging is a new technique used in pre-clinical research, and it can be utilized to obtain lung ventilated volume and ventilation defect percentage accurately1,2. In this study, a strategy for quantifying pulmonary compliance using HP 129Xe ventilation imaging was proposed and the feasibility of the strategy for distinguishing lung fibrosis in rats was also demonstrated.Methods
Ten Sprague Dawley rats were divided into two groups. The experimental group was intratracheally instilled with bleomycin solution (2.5U/kg body weight) to induce lung fibrosis while the control group was treated with an equivalent amount of normal saline (NS, 0.4 ml). PFTs and HP 129Xe MRI were performed on all rats on 21 ~ 24 days after instillation. For PFTs measurements, quasi-static pulmonary compliance (Cchord) was measured three times for each rat using a forced maneuvers system (CRFM 100, EMMS, UK). For HP 129Xe MRI experiments, pulmonary compliance was determined as the Cst-Xe = △V/△Pplat, where the V is the lung volume calculated from ventilation images and the Pplat is the breath-holding airway pressure recorded by a home-built 129Xe delivery system. To avoid the effect of T1 relaxation of 129Xe signal on volume calculation, each set of ventilation images was acquired in different breath-holding pressure after an appropriate number of xenon gas pre-breaths. The parameters of ventilation imaging were as follows: FOV = 5 cm, matrix=64×64, α=12°, TE=2.2 ms, slice thickness = 1.6 mm, number of slices = 24. The ventilation images were segmented using the Otsu algorithm to calculate the lung volume at different Pplat. Then the Cst-Xe was calculated using the slope of the Pressure-Volume curve. In addition, HP 129Xe diffusion-weighted imaging (DWI) was also performed on all rats to verify the bleomycin-induced fibrosis. The parameters of DWI were as follow: FOV = 6 cm, matrix=64×64, α=10°, TE=3.5 ms, ramp up/down time = 0.123 ms, constant time = 0.7 ms, diffusion time = 1.2 ms, five b values used were 0, 8, 16, 24 and 32 s/cm2. The DWI images were fitted to the cylinder model3 to obtain the microstructural parameters of the lung.Results
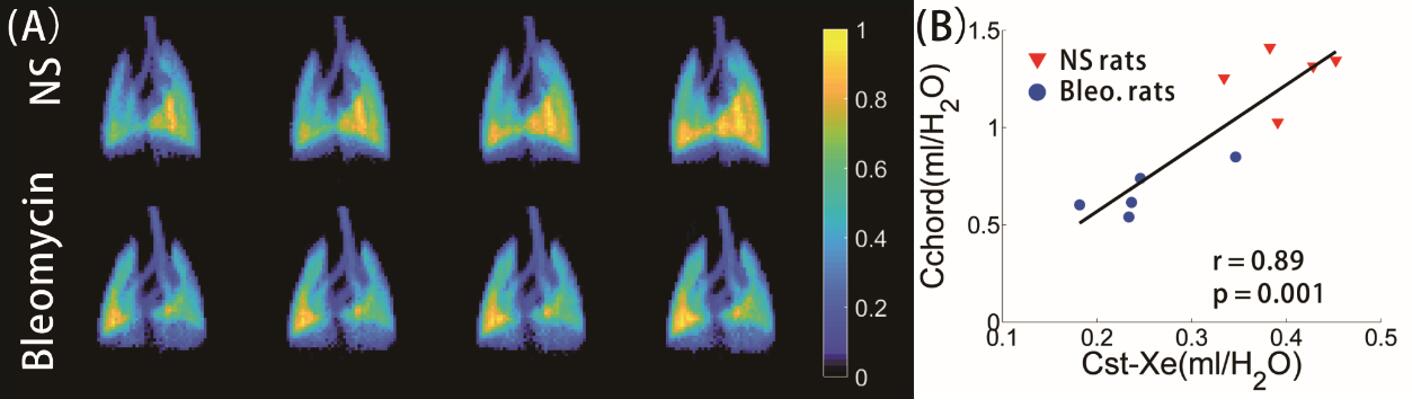
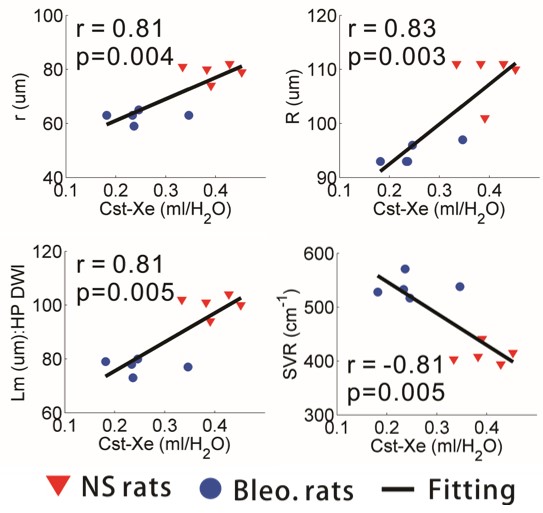
The measured Cchord using PFTs showed significant difference between bleomycin and NS rats (0.67 ± 0.12 ml/cm H2O vs. 1.27 ± 0.15 ml/cm H2O, p < 0.001). Similarly, the Cst-Xe driven from HP 129Xe ventilation imaging showed significant difference between the bleomycin and NS rats (0.25 ± 0.06 vs. 0.40 ± 0.05 ml/cm H2O, p = 0.003). The representative ventilation images were shown in figure 1 (A), and the bleomycin rat lung inflated with the increased of Pplat is clearly slower than that of NS rat. Figure 1 (B) showed that the Cst-Xe correlated well with Cchord (r = 0.89, p = 0.001). Moreover, as the verification of the lung fibrosis, the obtained microstructural parameters from DWI images including inner radius (r), outer radius (R), mean airspace chord length (Lm) and surface-to-volume ratio (SVR) also showed significant difference (p ≤ 0.001) between the groups, and also correlated well with Cst-Xe (|r| > 0.08, p<0.01), as shown in figure 2.Discussion and Conclusion
In this study, we proposed a strategy for measuring the pulmonary compliance using HP 129Xe MRI. Pulmonary compliance driven by 129Xe ventilation imaging showed significant difference between the bleomycin and NS rats, and correlated well with that measured using PFTs. In addition, strong correlation between Cst-Xe and the microstructural parameters from DWI was consistent with the histological results reported previously4,5. These results demonstrated the feasibility of the proposed strategy in quantifying pulmonary compliance, which would improve our understanding of pulmonary compliance changes in lung diseases such as fibrosis.Acknowledgements
This work was supported by National Key R&D Program of China (2018YFA0704000), National Natural Science Foundation of China (81625011, 91859206, 21921004, 81601491), Key Research Program of Frontier Sciences, CAS (QYZDY-SSW-SLH018) and Hubei Provincial Natural Science Foundation of China (2017CFA013, 2018ACA143).References
1. He M, Driehuys B, Que L G, et al. Using hyperpolarized 129Xe MRI to quantify the pulmonary ventilation distribution. Acad Radiol, 2016, 23(12): 1521-1531.
2. Virgincar R S, Cleveland Z I, Sivaram Kaushik S, et al. Quantitative analysis of hyperpolarized 129Xe ventilation imaging in healthy volunteers and subjects with chronic obstructive pulmonary disease. NMR in Biomed, 2013, 26(4): 424-435.
3. Sukstanskii AL, Yablonskiy DA. Lung morphometry with hyperpolarized Xe-129: theoretical background. Magn Reson Med 2012; 67: 856-866.
4. Haber P S, Colebatch H J, Ng C K, et al. Alveolar size as a determinant of pulmonary distensibility in mammalian lungs. J Appl Physiol, 1983, 54(3): 837-845.
5. Goldstein R H, Lucey E C, Franzblau C, et al. Failure of mechanical properties to parallel changes in lung connective tissue composition in bleomycin-induced pulmonary fibrosis in hamsters. Am Rev Respir Dis, 1979, 120(1): 67-73.
Figures