2292
Optimizing Hyperpolarized 129Xe Production under Practical Cryogenic Accumulation Conditions1Center for Pulmonary Imaging, Cincinnati Children's Hospital Medical Center, Cincinnati, OH, United States, 2Polarean Imaging PLC, Durham, NC, United States
Synopsis
Following improvements in continuous-flow hyperpolarization technology, 129Xe has shown ever-increasing utility as a pulmonary contrast agent. However, polarization remains constrained by conflicting demands of spin-exchange efficiency and T1 relaxation during cryogenic collection. By collecting 129Xe across a range of practical conditions, we developed model to predict conditions for optimal 129Xe polarization. In many regimes, the benefits of optimal spin exchange efficiency were outweighed by polarization lost to rapid relaxation in polycrystalline 129Xe snow (T1snow = 84 minutes). For 1-L, clinical 129Xe doses, our model suggests optimal polarizations are obtained using accumulation times <30 minutes and relatively rich (2–2.3%) xenon mixtures.
Introduction
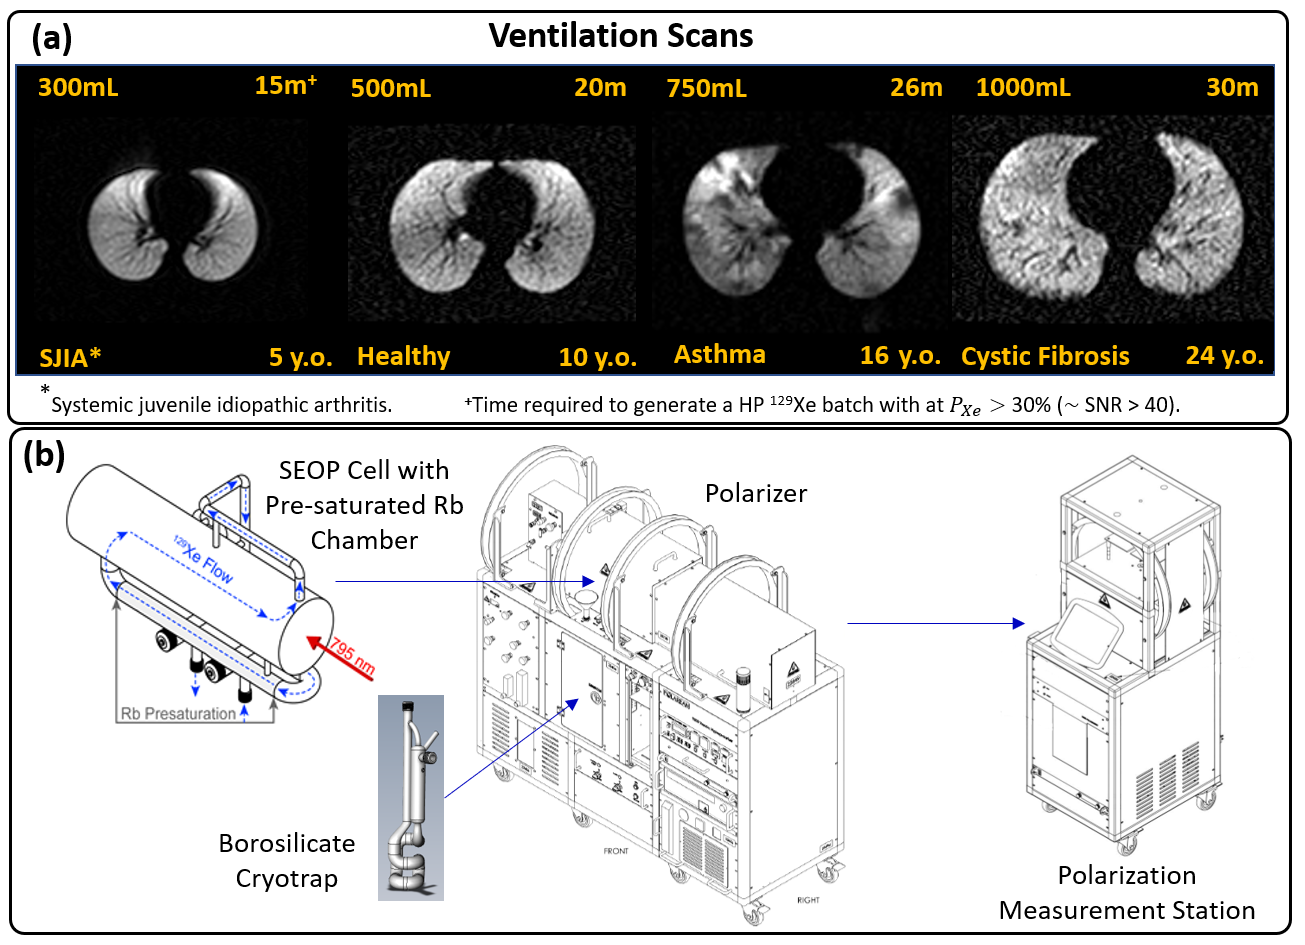
Steady improvements to continuous-flow spin exchange optical pumping (SEOP) have accelerated the application of hyperpolarized 129Xe as a lung MRI contrast agent. The polarization of 129Xe, PXe , routinely meets 30% for 1-L volumes, enabling clinical MRI studies of lung ventilation, microstructure, and pulmonary gas-exchange1. However, PXe remains constrained by experimental continuous-flow parameters including spin-exchange efficiency, T1 decay prior to use, and practical matters including varying volume and time demands (overview in Figure 1a). Not only does PXe face losses (>10%) during long storage times before patient inhalation, but long cryogenic accumulation times are required for large gas volumes, which further induces polarization losses due to T1, relaxation within the polycrystalline ‘snow’ form of 129Xe.Unfortunately, continuous-flow SEOP suffers from conflicting demands, as polarization generated within the SEOP cell is maximized in lean gas mixtures (typically 1% or 3% xenon)1-4 and slow gas flow rates, whereas T1-induced polarization losses during accumulation are minimized at high flow rates. However, the relevant experimental parameter-space (gas composition, flow, and accumulation volume) has never been rigorously investigated. Here we combine first-principles spin-exchange-physics with empirical 129Xe polarization data acquired over a wide range of accumulation conditions to optimize 129Xe SEOP for clinical applications.
Methods
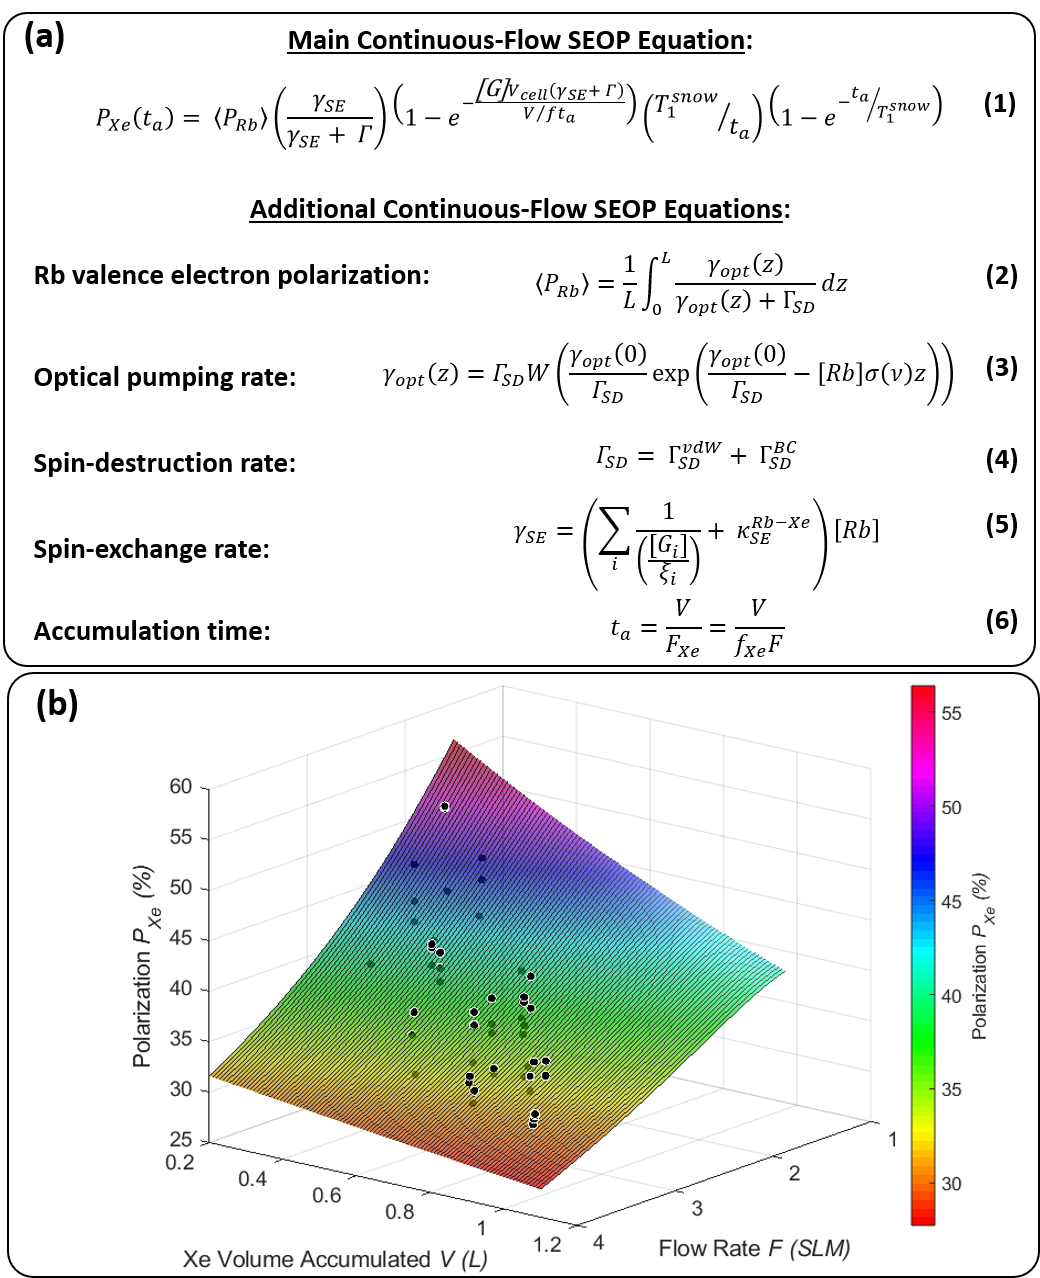
Experiments were performed using a continuous-flow polarizer (Polarean 9820A) and cryogenic (77K) xenon collection (795nm-laser power=169W, cell temperature =120°C) and isotopically-enriched (85%) 129Xe mixed with 10% N2 and balanced with He. This system employs a pre-saturated Rb region (180°C) before the SEOP cell (Figure 1b). Polarization was measured (Polarean 2881 Station) across ~110 different combinations of flow (1.5-4SLM), dispensed Xe volumes (200-1000mL), accumulation times (10-60min.), and 129Xe fraction, f (1% and 2%). Modeling and data fitting were performed in MATLAB.Model: The polarization, PXe, immediately after cryogenic accumulation and dispense is given by Eq. 1 of Figure 2,2-4,6,9,10 where ta =V/fF is the time, ta, needed to accumulate a volume, V, of 129Xe at total gas flow, F. Additionally, γSE is the spin-exchange rate, Γ the 129Xe gaseous relaxation rate, [Gi] total gas density, and Vcell SEOP cell volume. The optical-pumping and spin-exchange terms in Eq. 1 depend on the [Rb] concentration (Figure 2, Eq (2-5)) and T1snow, which were used as free-fitting parameters.
Results
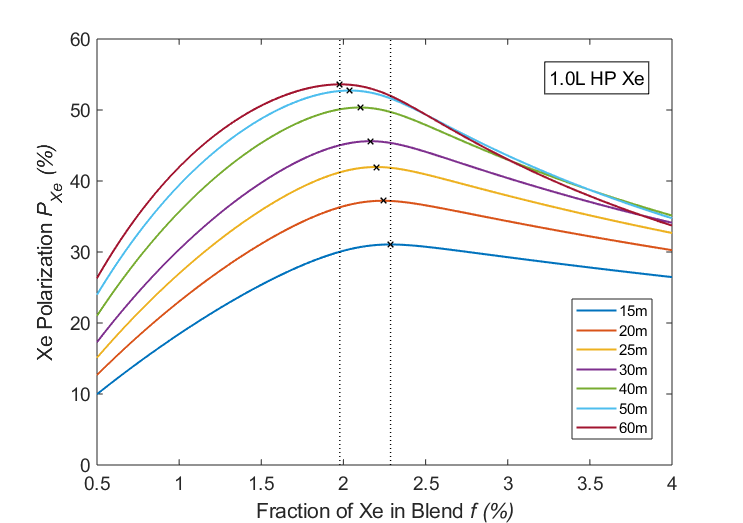
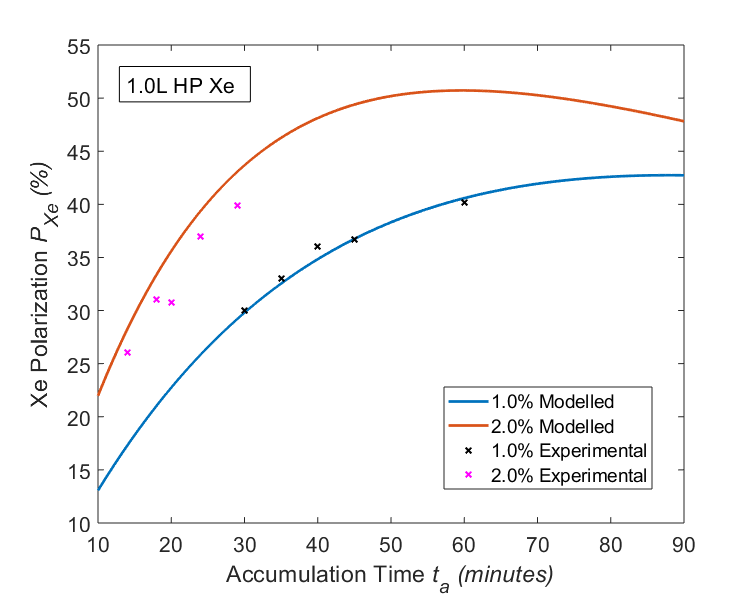
Figure 2 shows the polarization following 129Xe accumulations as a function of dispensed volume and gas flow fit to Eq. 1 (R2 = 0.7). The free-fitting parameters, [Rb] and T1snow, were found to be 1.55 ± 0.1 x1013 cm-3 and 84 ± 2.5 minutes, respectively. Previously, M.E. Limes et. al. 5 reported an 80% longer T1snow of 150 minutes in 77K at 2.08T, indicating T1-induced losses of PXe could be more significant for our conditions. This is shown in Figure 3, which displays model-based simulations of for 1-L batches, as a function of accumulation time for various xenon gas mixtures, using T1snow = 150 and 84 minutes. As expected, using the shorter T1snow measured here predicts reduced polarization at extended accumulation times.Additionally, the analytical form of Eq. 1 indicates that, for a given accumulation volume and time, there is an optimal 129Xe concentration that maximizes PXe. As shown in Figure 4, this optimal f is in the range of 2-2.3% for 1-L volumes. To test these predictions, 1-L batches were accumulated using f =1% and 2% mixtures (Figure 5), with the latter showing a 50% reduction in ta could be achieved with equivalent or higher PXe.
Discussion and Conclusion
The T1 of 129Xe snow is known to be shorter than that of crystalline 129Xe ice. However, we found that T1snow is reduced even further during cryogenic collection. Our value of T1snow = 84 min. is similar to the 87 minutes reported by Norquay et. al.3,4 using a similar cryotrap design, the same nominal temperature (77K) and magnet field (0.3T) but without active, hot-gas-flow accumulation conditions. Together, these results suggest the lower magnetic field (0.3 vs 2T) used to accumulate 129Xe snow accelerates T1snow relaxation. Thus, if a stronger storage field were applied, or the cryotrap redesigned to favor crystalline 129Xe deposition, T1-induced losses could be reduced, and continuous-flow polarizers would see significant polarization improvements.Even with current 129Xe-snow accumulation technology4,11, PXe can be improved by avoiding prolonged accumulation times. Specifically, empirical data from the f = 2% 129Xe mixture (Figure 5) demonstrate >10% PXe increases for a given ta can be achieved, relative to a 1% mixture for fixed xenon volume. That is, at f = 2%, spin-exchange efficiency is reduced, but accumulation times are shortened to the point that T1-induced losses in xenon snow are mitigated.
While minor deviations from predicted PXe are observed for the f = 2% mixture—possibly due to subtly different freezing or thawing dynamics—these data demonstrate that short T1snow is a key limitation when generating the highest 129Xe polarizations. Optimal polarizations are obtained for conventional clinical 129Xe doses (i.e., 1-L) using short accumulation times (<30 minutes) and relatively rich (2–2.3%) xenon mixtures. Finally, these gains in polarization and accumulation rate require only a trivial change in experimental design—the input gas composition—meaning they can be attained without additional experimental expense or specialized equipment.
Acknowledgements
I would like to thank Neil Stewart for his assistance with the relaxation rate derivations, and the members of Center for Pulmonary Imaging Research for their proof reading of this abstract.
Grants: Funding provided by the Cincinnati Children's Research Foundation and NIH (K99HL138255, R01HL131012, R01HL143011, and R44HL123299)
References
[1] Walkup, L. L., & Woods, J. C. (2014). Translational applications of hyperpolarized 3 He and 129 Xe. NMR in Biomedicine, 27(12), 1429–1438. https://doi.org/10.1002/nbm.3151
[2] Driehuys, B., Cates, G. D., Miron, E., Sauer, K., Walter, D. K., & Happer, W. (1996). High-volume production of laser-polarized 129Xe Applied Physics Letter, 69, 1668. https://doi.org/10.1063/1.117022
[3] Norquay, G., Collier, G. J., Rao, M., Stewart, N. J., & Wild, J. M. (2019). Xe129-Rb Spin-Exchange Optical Pumping with High Photon Efficiency. Physical Review Letters, 121. https://doi.org/10.1103/PhysRevLett.121.153201
[4] Norquay, G., Parnell, S. R., Xu, X., Parra-Robles, J., & Wild, J. M. (2013). Optimized production of hyperpolarized 129Xe at 2 bars for in vivo lung magnetic resonance imaging. Journal of Applied Physics, 113, 44908. https://doi.org/10.1063/1.4776763
[5] Limes, M. E., Ma, Z. L., Sorte, E. G., & Saam, B. (2016). Robust solid 129Xe longitudinal relaxation times. https://arxiv.org/pdf/1607.01072.pdf
[6] Cates, G. D., Fitzgerald, R. J., Barton, A. S., Bogorad, P., Gatzke, M., Newbury, N. R., & Saam, B. (1992). Rb-129Xe spin-exchange rates due to binary and three-body collisions at high Xe pressures. Physical Review A (Vol. 45).
[7] Freeman, M. S., Emami, K., & Driehuys, B. (2014). Characterizing and modeling the efficiency limits in large-scale production of hyperpolarized 129Xe. Physical Review A (90) 023406
[8] Gatzke, M., Cates, G. D., Driehuys, B., Fox, D., Happer, W., & Saam, B. (1993). Extraordinarily Slow Nuclear Spin Relaxation in Frozen Laser-Polarized 129Xe. Physical Review Letters, (Vol. 70).
[9] Appelt, S., Ünlü, T., Zilles, K., Shah, N. J., Baer-Lang, S., & Halling, H. (1999). Applied Physics Letters, 75, 427. https://doi.org/10.1063/1.124397
[10] Polarean 9820 Model A – Operating Manual Rev. A 001
Figures