2289
Quantifying Gas Exchange Rates Between Red Blood Cells and Airways Using Hyperpolarized Xenon-129
Faraz Amzajerdian 1,2, Stephen J Kadlecek1, Hooman Hamedani1,2, Yi Xin1,2, Ryan Baron1, Ian Duncan1, Maurizio Cereda1,3, Kai Ruppert1, and Rahim R. Rizi1
1Radiology, University of Pennsylvania, Philadelphia, PA, United States, 2Bioengineering, University of Pennsylvania, Philadelphia, PA, United States, 3Anesthesiology and Critical Care, University of Pennsylvania, Philadelphia, PA, United States
1Radiology, University of Pennsylvania, Philadelphia, PA, United States, 2Bioengineering, University of Pennsylvania, Philadelphia, PA, United States, 3Anesthesiology and Critical Care, University of Pennsylvania, Philadelphia, PA, United States
Synopsis
Xenon Polarization Transfer Contrast (XTC) imaging is useful for quantifying the exchange rates between gas-phase and dissolved-phase xenon, particularly in emphysematic lungs which experience reduced local tissue and blood volumes. However, this technique does not account for local gas volumes, which can provide important context for interpreting these exchange rates. In this work, a method of incorporating both gas exchange rates and local gas volumes is described.
Introduction
Hyperpolarized xenon-129 (HXe) is a powerful agent for evaluating lung function due to its solubility in lung parenchyma and affinity for hemoglobin in red blood cells (RBCs), analogous to trans-membrane oxygen exchange. While measurements of HXe RBC binding are often acquired by imaging the dissolved-phase components of HXe and normalizing to the gas-phase signal, such a scheme is unable to determine the rate of exchange between the two compartments. Alternatively, gas exchange can be imaged directly by observing the loss of gas phase signal after selective saturation of the dissolved components; however, this approach yields only a fractional exchange rate that fails to account for local gas volumes. However, by combining a measure of gas exchange per time per unit gas volume with voxel-wise measurements of gas volume, a robust, bidirectional airspace-RBC exchange rate, q̇ (units of volume per time), can be defined.Methods
Imaging was performed, with Institutional Review Board (IRB) approval, on one healthy volunteer and three COPD subjects, including one bilateral lung transplant recipient. A 1.5T scanner (Magnetom Avanto, Siemens) with a flexible 8-channel xenon-129 chest coil (Stark Contrast, Germany) was used for all studies, and a prototype commercial system (XeBox-E10, Xemed LLC, NH) was used to polarize 87% enriched xenon-129.A map of the exchange from gas to RBC (per time per unit gas volume) was generated using the Xenon Polarization Transfer Contrast (XTC) technique1. Three gas-phase images were acquired via a 2D multi-slice GRE during a single 12 s breath-hold after inhalation of pure HXe at a prescribed tidal volume (TV) of 15% of total lung capacity (TLC). Imaging parameters included: flip angles of 4°, 9° and 13°, respectively, TR/TE = 5.1/2.4 ms, matrix size = 36x48x6, 25 mm slice thickness (20% inter-slice gap), and FOV of 300-340 mm. 100 frequency-selective inversion pulses (Gaussian) with pulse width of 8 ms and TR = 30 ms were centered at 217 ppm (RBC resonance) for contrast preparation and repeated at -217 ppm to correct for T1 decay and off-resonance excitation effects. In order to maximize SNR, the contrast preparation scheme was applied between the second pair of images, S2 and S3, while the first pair of images, S1 and S2, were used for the T1 correction. Images were normalized by their respective flip angles prior to analysis.
The voxel-wise gas volumes (GV) at end-inspiration were derived from fractional ventilation (FV) maps acquired from a multi-breath imaging protocol2. This imaging was performed in the same session and with the same slice positioning, resolution, and orientation as the XTC imaging. The FV imaging series consisted of 6 breaths at TV composed of 35% HXe diluted with nitrogen and 21% oxygen. Additional parameters included a flip angle of 6°, TR/TE = 7.0/3.3 ms. A global measure of GV, which was defined as TV plus the functional residual capacity (FRC), was estimated from the calculated FV and the volume of delivered gas. A compartment model was then used to iteratively divide the GV measurement down to voxel scale.
$$q̇ = \frac{1}{TR}(1-(\frac{S_3S_1}{S_2^2})^\frac{1}{N}) *(GV)$$
Finally, q̇ was calculated by multiplying the GV by the fraction of HXe depolarized per inversion pulse divided by the time allowed for exchange. This is shown in the equation above, where N and TR are the number and repetition time of the inversion pulses, respectively.
Results
Figure 1 shows the q̇ maps for a healthy subject, two COPD III subjects (A, B), and one bilateral lung transplant recipient with COPD (C). The healthy subject has a more homogenous distribution of exchange compared to the patchy, heterogenous distribution in the COPD patients. This finding is further supported by the histograms in figure 2, which illustrate these different distributions of gas exchange. The skewness for the healthy subject as well as subjects A, B, and C were 1.5, 3.5, 2.5, and 2.8, respectively. Table 1 lists the percent predicted FEV1, along with the DLCO and DLCO/VA, for each subject. Decreases in these PFT values compared to the healthy control indicate increased disease severity, which is mirrored by decreases in whole-lung q̇ measurements. The gas exchange rate for the entire lungs of the healthy subject (1107.72 mL/s) was ~2.5 fold higher than in COPD subject A (451.83 mL/s) and ~8.5 fold higher than subjects B (131.08 mL/s) and C (125.01 mL/s). We note that ‘gas exchange’ in this context refers to the rate at which inhaled gas traverses the alveolar membrane and binds to hemoglobin, and vice versa; because it describes an exchange process, this rate greatly exceeds that of gas uptake. For this reason, and because of differing solubility and diffusion rates, these values are not directly comparable to DLCO, VO2, or other standard metrics. Nonetheless, we expect similar trends with loss of function and disease.Conclusion
By incorporating ventilation in the form of gas volumes, the proposed quantification method provides a more robust measure of gas exchange rates.Acknowledgements
No acknowledgement found.References
[1] Ruppert, Kai, et al (2000). Probing lung physiology with xenon polarization transfer contrast (XTC). MRM 44(3), 349-357.
[2] Hamedani, Hooman, et al (2016). Regional fractional ventilation by using multibreath wash-in 3He MR imaging. Radiology 279(3), 917-924.
Figures
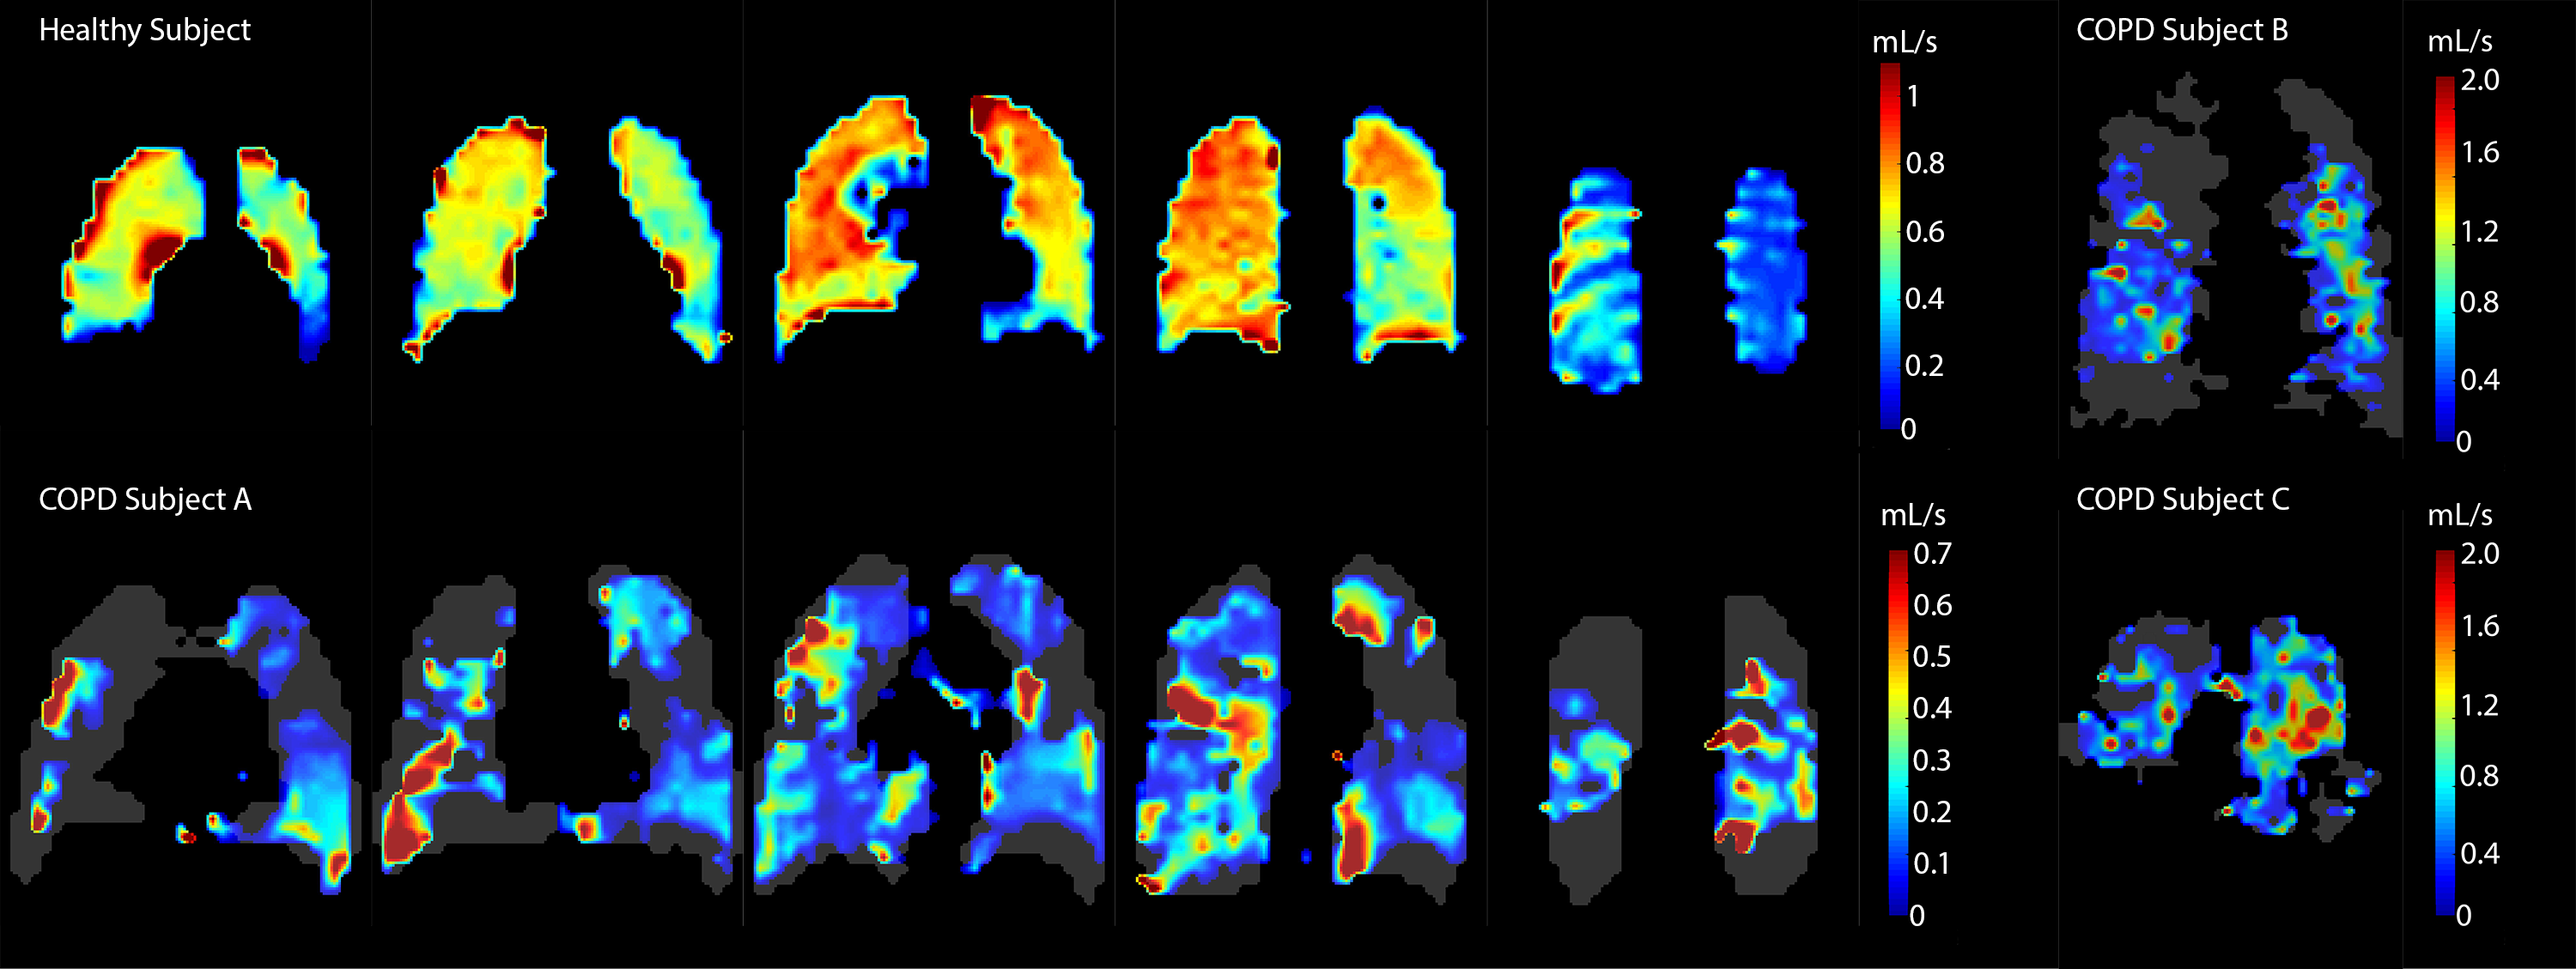
Figure
1: Q̇ maps of one healthy subject, two COPD III
subjects (A, B), and one bilateral lung transplant recipient (C), illustrating
significant differences in both the rate and distribution of RBC-airspace
exchange. For subjects B and C, the summation of their coronal slices are
shown.
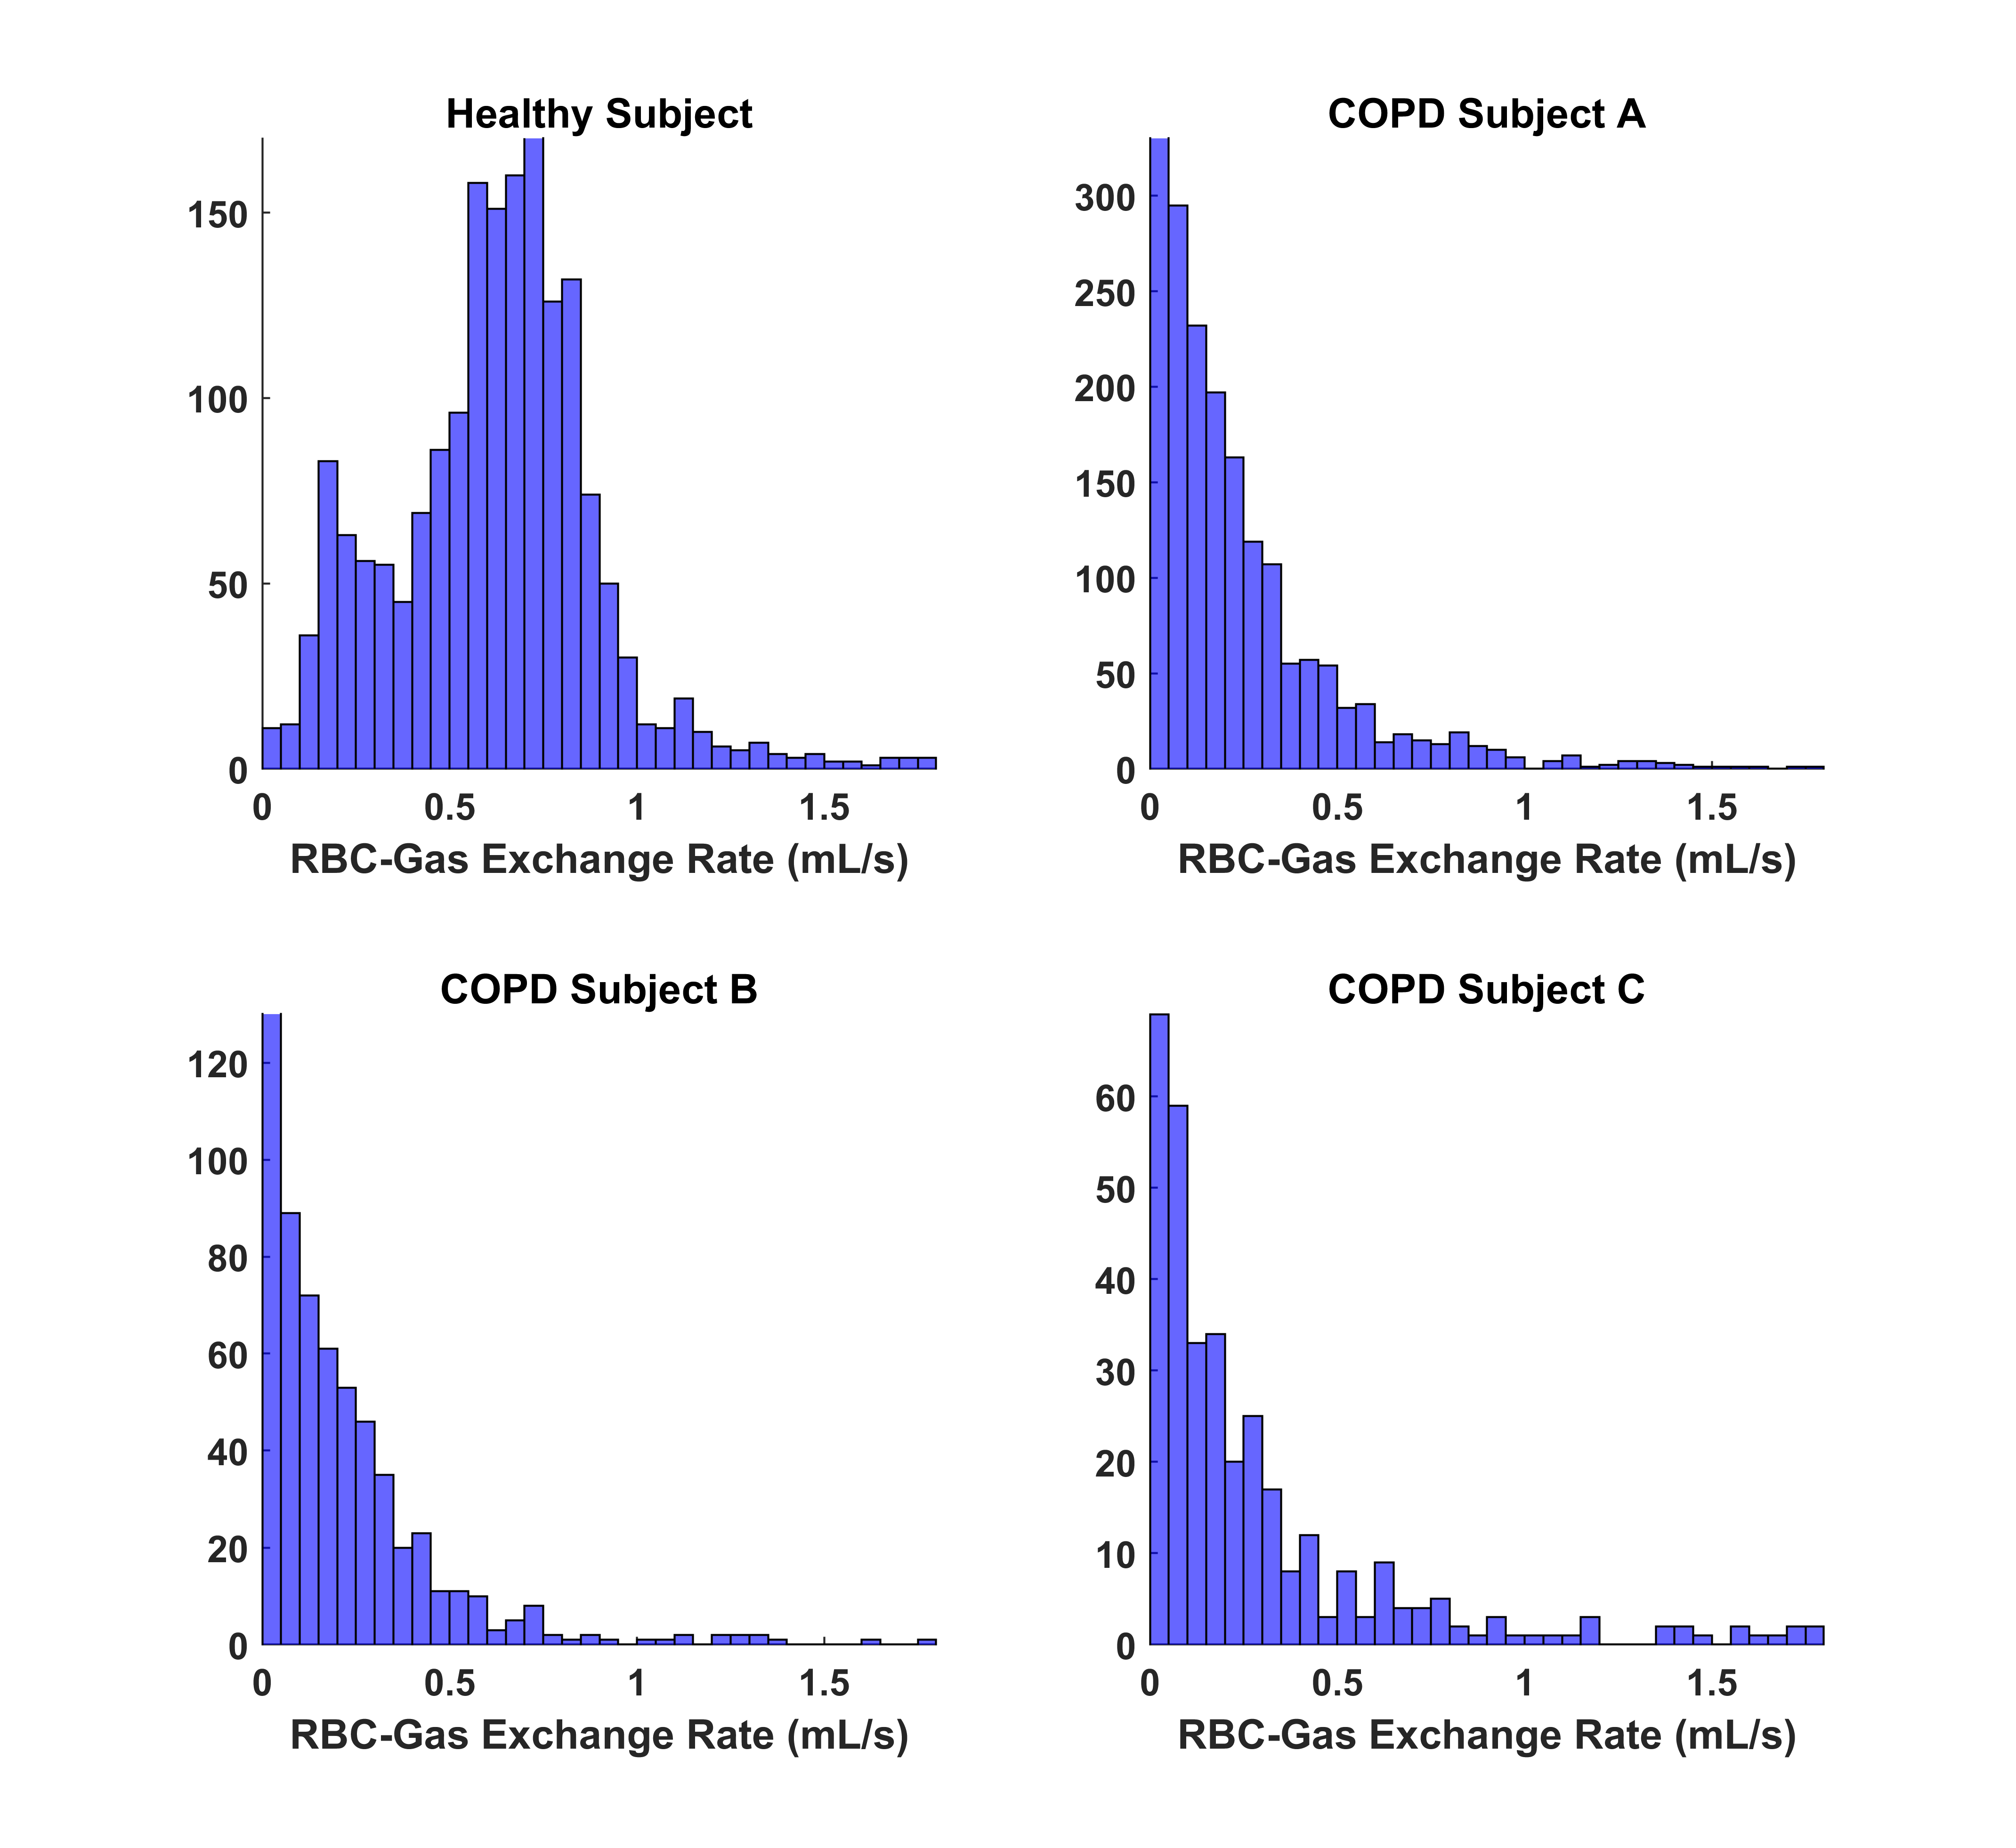
Figure 2: Histograms of the q̇ for the healthy and COPD
subjects, illustrating differences in their gas exchange distributions.
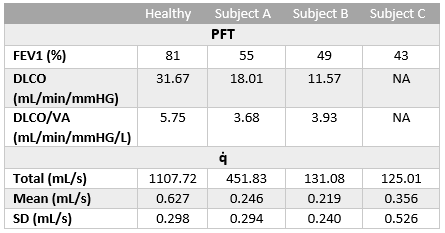
Table
1: PFT and q̇ measurements for each subject.