2287
Can Hyperpolarized Gas MRI and Machine Learning Predict Longitudinal Changes in Airflow Limitation in Ex-smokers?1Department of Medical Biophysics, Western University, London, ON, Canada, 2Department of Medicine, Western University, London, ON, Canada, 3Department of Medical Biophysics, Department of Medicine, Western University, London, ON, Canada
Synopsis
Hyperpolarized-gas-MRI provides a way to measure lung ventilation in patients with chronic obstructive pulmonary disease (COPD) in whom progressive worsening of expiratory airflow occurs over time. Progression of COPD is believed to stem from airway wall and lumen changes, airway remodeling or obliteration and emphysema. Our objective was to test machine-learning algorithms trained on hyperpolarized 3He MRI for predicting clinically-relevant FEV1 changes. Novel 3-dimensional adaptations of gray-level run-length-matrices, gap-length-matrices, zone-size-matrices and co-occurrence-matrices were used for feature extraction which lead to the identification of features that predicted changes in airflow limitation (∆FEV1%pred>5%) over a 2.5-year time-period in at-risk and COPD ex-smokers.
INTRODUCTION:
Hyperpolarized gas magnetic-resonance-imaging (MRI) provides a way to measure ventilation and perfusion abnormalities that stem from abnormalities in the large and small airways and emphysema.1 In patients with chronic obstructive pulmonary disease (COPD), progressively worse expiratory airflow occurs over time and is believed to stem from progressively worse airway wall and lumen microstructure, or airway remodeling and emphysematous abnormalities in the lung parenchyma.2 While the forced expiratory flow in 1s (FEV1) is easily measured, it cannot provide spatial nor functional information about the small airways, which are believed to drive COPD pathogenesis. Predictive models of COPD progression are usually based on clinical characteristics or quantitative information from computed tomography (CT)3 and to-date none include MRI-derived measurements.4 To address this gap, we aimed to evaluate progressive airflow limitation in at-risk and COPD ex-smokers based on their minimal clinically important difference (MCID) for FEV1 using MRI texture features and machine-learning. The generalizability of the extracted features was tested by comparing the accuracy of single and ensemble classifiers. We hypothesized that hyperpolarized gas MRI measurements, machine-learning and multivariate modelling could be combined to sensitively and specifically predict changes in airflow limitations over ~2.5 years.METHODS:
Data Acquisition:In this retrospective study, at-risk and COPD ex-smokers provided written-informed-consent to an approved research protocol and underwent hyperpolarized 3He MRI and spirometry measurements. MRI was performed on a whole body 3.0 Tesla Discovery MR750 (GE Health Care, Milwaukee, WI) with broadband imaging capability at baseline and 2.5 years later, as previously described.5 Ground-truth change in airflow limitation was defined as a change in FEV1%pred greater than 5% at follow-up. 3He gas was polarized to 30–40% (HeliSpin) and doses (5 ml/kg body weight) were administered in 1.0 L Tedlar bags diluted with medical grade nitrogen. 3He MRI, ventilation images were acquired using FGRE sequence with a partial echo (10 s data acquisition, TR/TE/flip angle = 3.8 ms/1.0 ms/7°, [FOV] = 40 × 40 cm, matrix 128 × 128, slices 15-17, slice thickness 15 mm, with 0 gap) with and without additional diffusion sensitization with b=1.6 s/cm2 (gradient amplitude (G)=1.94 G/cm, rise and fall time=0.5 ms, gradient duration=0.46 ms, diffusion time=1.46 ms) during inspiratory breath-hold of a 1 L volume of 3He/N2 mixture.6
Data Analysis:
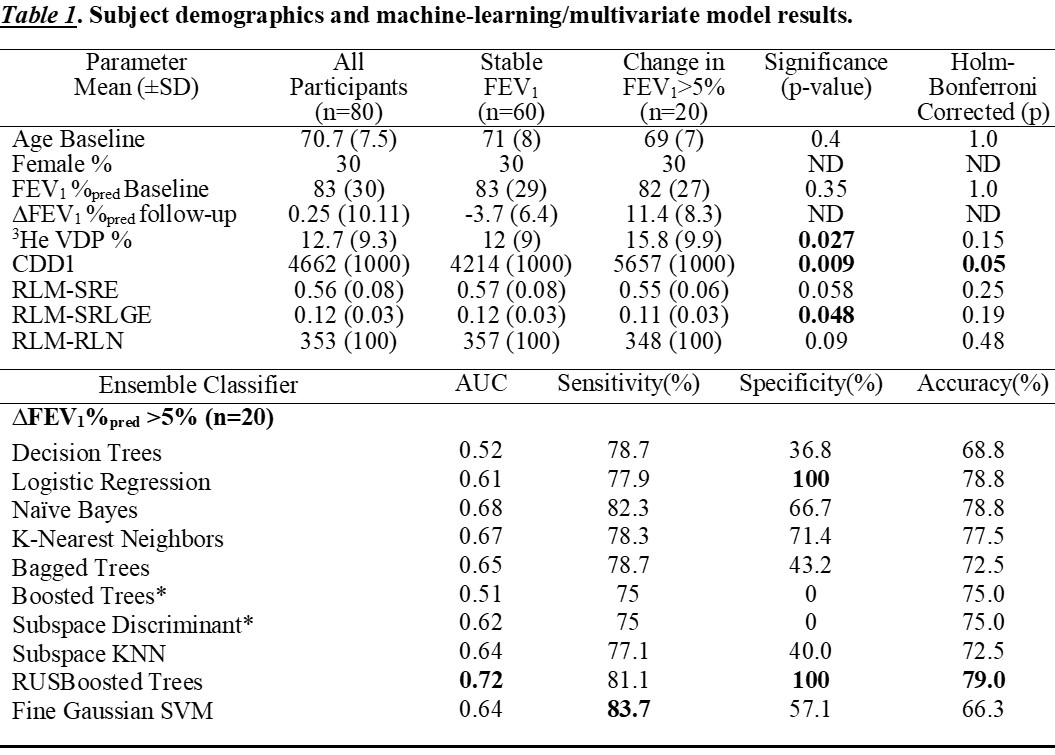
We evaluated first-order texture features including mean, standard deviation, and skewness; ventilation-defect-percent (VDP) measurements were generated as previously described.7 A custom-built algorithm was used to extract ventilation-defect-cluster-percent (VDCP), low ventilation clusters (LVC) and cluster defect diameter voxel size one (CDD1) measurements. Other algorithm inputs were extracted from novel 3-dimensional extensions of gray-level run-length-matrices (RLM), gap-length-matrices (GLM), zone-size-matrices (ZSM) and co-occurrence-matrices (GLCM).8 Eleven features were extracted from each of RLM, GLM and ZSM. These account for most of the grey-level information provided by extracting all the gaps and runs with same directionality and angles. Extracted GLCM features were contrast, entropy and homogeneity. Participant demographics and features were evaluated using parametric and non-parametric t-tests with Holm-Bonferroni correction. The performance of specific models was evaluated using area-under-the-receiver-operator-curve (AUC), sensitivity and specificity values. Participants were dichotomized as stable or > 5% change in FEV1 at follow-up and then randomly assigned to a 70% training and a 30% testing data-set with five-fold cross validation.
RESULTS:
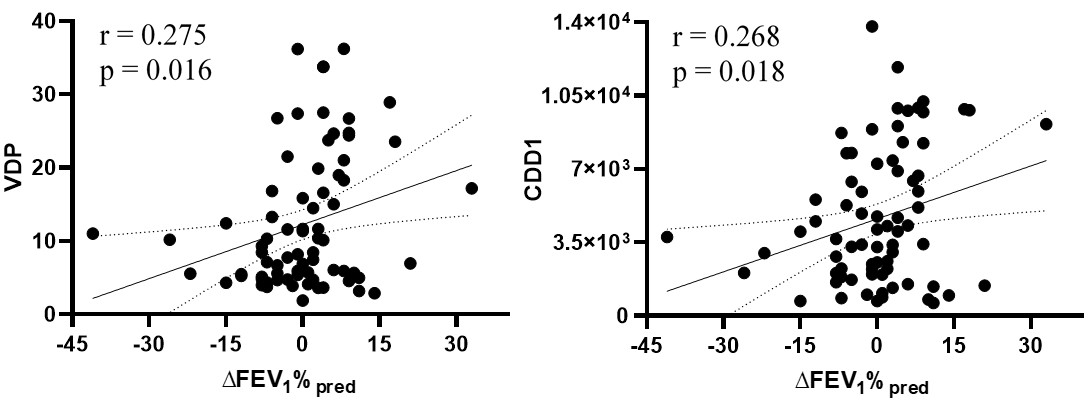
We evaluated 80 ex-smokers including 50 participants with and 30 participants without COPD at baseline and at 30±8-months later. Fourteen participants with COPD and 6 participants without COPD reported a change in FEV1 that exceeded the minimal clinically important difference at follow-up. Table 1 provides the features and accuracies of the machine-learning algorithms. Ensemble outperformed single classifiers, with RUSBoosted trees algorithm providing 79% accuracy and 100% specificity. Multi-variate modelling revealed that CDD1, SRE, SRLGE and RLN texture features significantly predicted a clinically-relevant change in FEV1. Figure 1 shows the relationship of the strongest predictor (CDD1) and VDP with the change in FEV1 that was measured at follow-up.DISCUSSION:
We evaluated 42 texture features derived from hyperpolarized 3He MRI using machine-learning algorithms to predict changes in FEV1 at follow-up. The test accuracy of the models was moderate, but the specificity remained high, which highlights the potential of extracting strong predictors from hyperpolarized gas MRI. CDD1 reflects the cumulative number of defect clusters of one voxel (5x5x5mm3) and this extracted feature significantly correlated with changes in FEV1 at follow-up. While SRE, SRLGE and RLN measure the overall texture and distribution of various runs, SRLGE (p=0.048) captures short-runs of low gray-levels and significantly correlated with the changes in FEV1 measurements. A quarter of ex-smokers had significant changes in airflow limitations with ∆FEV1%pred >5% within ~2.5 years’ time period, and this was detected using machine-learning and texture analysis. Few classifiers had high-test accuracy but the results were biased towards favouring the larger class because all the test subjects were classified as stable.CONCLUSION:
Hyperpolarized 3He MRI measurements, supervised machine-learning and multivariate modelling can be used together to reveal the determinants of significant changes in airflow limitation after 2.5 years. Yes! Hyperpolarized gas MRI and machine learning does predict clinically-relevant changes in FEV1 in ex-smokers with and without COPD.Acknowledgements
No acknowledgement found.References
1) Saam, B T et al. Magnetic Resonance in Medicine (2000).
2) Hogg, J C et al. New England Journal of Medicine (2004).
3) González, G et al. Am J Respir Crit Care Med (2018).
4) Kirby, M et al. Radiology (2014).
5) Kirby, M et al. Radiology (2010).
6) Parraga, G et al. Invest Radiol (2007).
7) Kirby, M et al. Acad Radiol (2012).
8) Depeursinge, A et al. Biomedical texture analysis. Acad Press (2017).
Figures