2286
Dissolved 129Xe lung MRI with 4-echo IDEAL 3D radial CSI: quantification of regional gas transfer in idiopathic pulmonary fibrosis1Department of Infection, Immunity & Cardiovascular Disease, University of Sheffield, Sheffield, United Kingdom, 2Academic directorate of respiratory medicine, Sheffield Teaching Hospitals NHS Foundation Trust, Sheffield, United Kingdom, 3GE Healthcare, Munich, Germany
Synopsis
Imaging of the different resonances of dissolved hyperpolarized xenon in the lung is performed using a 4-echo flyback 3D radial implementation of the IDEAL technique and is evaluated in subjects with idiopathic pulmonary fibrosis. Results show:
- excellent chemical shift separation of the dissolved peaks and gas contamination removal,
- agreement with global spectroscopic and pulmonary function measurements of gas transfer,
- reduced imaging gas transfer, especially in the basal lung, when compared to healthy volunteers,
- increased cardiogenic modulation of dissolved xenon signal in the blood.
Clinical results are in line with previously-published data.
Introduction
Hyperpolarized (HP) 129Xe allows functional imaging of ventilation and gas exchange in the lung. It is soluble in biological tissues and blood, and exhibits two distinct resonance peaks corresponding to 129Xe dissolved in lung tissue/plasma (TP, ~197ppm relative to 129Xe gas) and red blood cells (RBC, ~217ppm). Spectroscopic measurements of 129Xe dissolved phase uptake such as the RBC/TP ratio have been shown to be sensitive to diffusion limiting lung diseases1; eg idiopathic pulmonary fibrosis (IPF) where septal thickening results in reduced gas transfer. Imaging dissolved-phase 129Xe is challenging as it represents only 1-2% of the total magnetization and has short T2* (~2ms). Short TE sequences combined with Dixon/IDEAL chemical shift (CS) separation techniques can overcome this limitation, enabling simultaneous imaging of 129Xe in its gas and dissolved phase compartments2,3. However, residual gas contamination and image blurring due to incomplete CS separation (usually performed in image space) pose technical challenges. In this work, a 4-point IDEAL technique with k-space decomposition of GAS, TP and RBC signals combined with a 3D radial trajectory, was developed to obtain maps of each compartment. The method was evaluated in healthy volunteers (HV) and patients with IPF.Methods
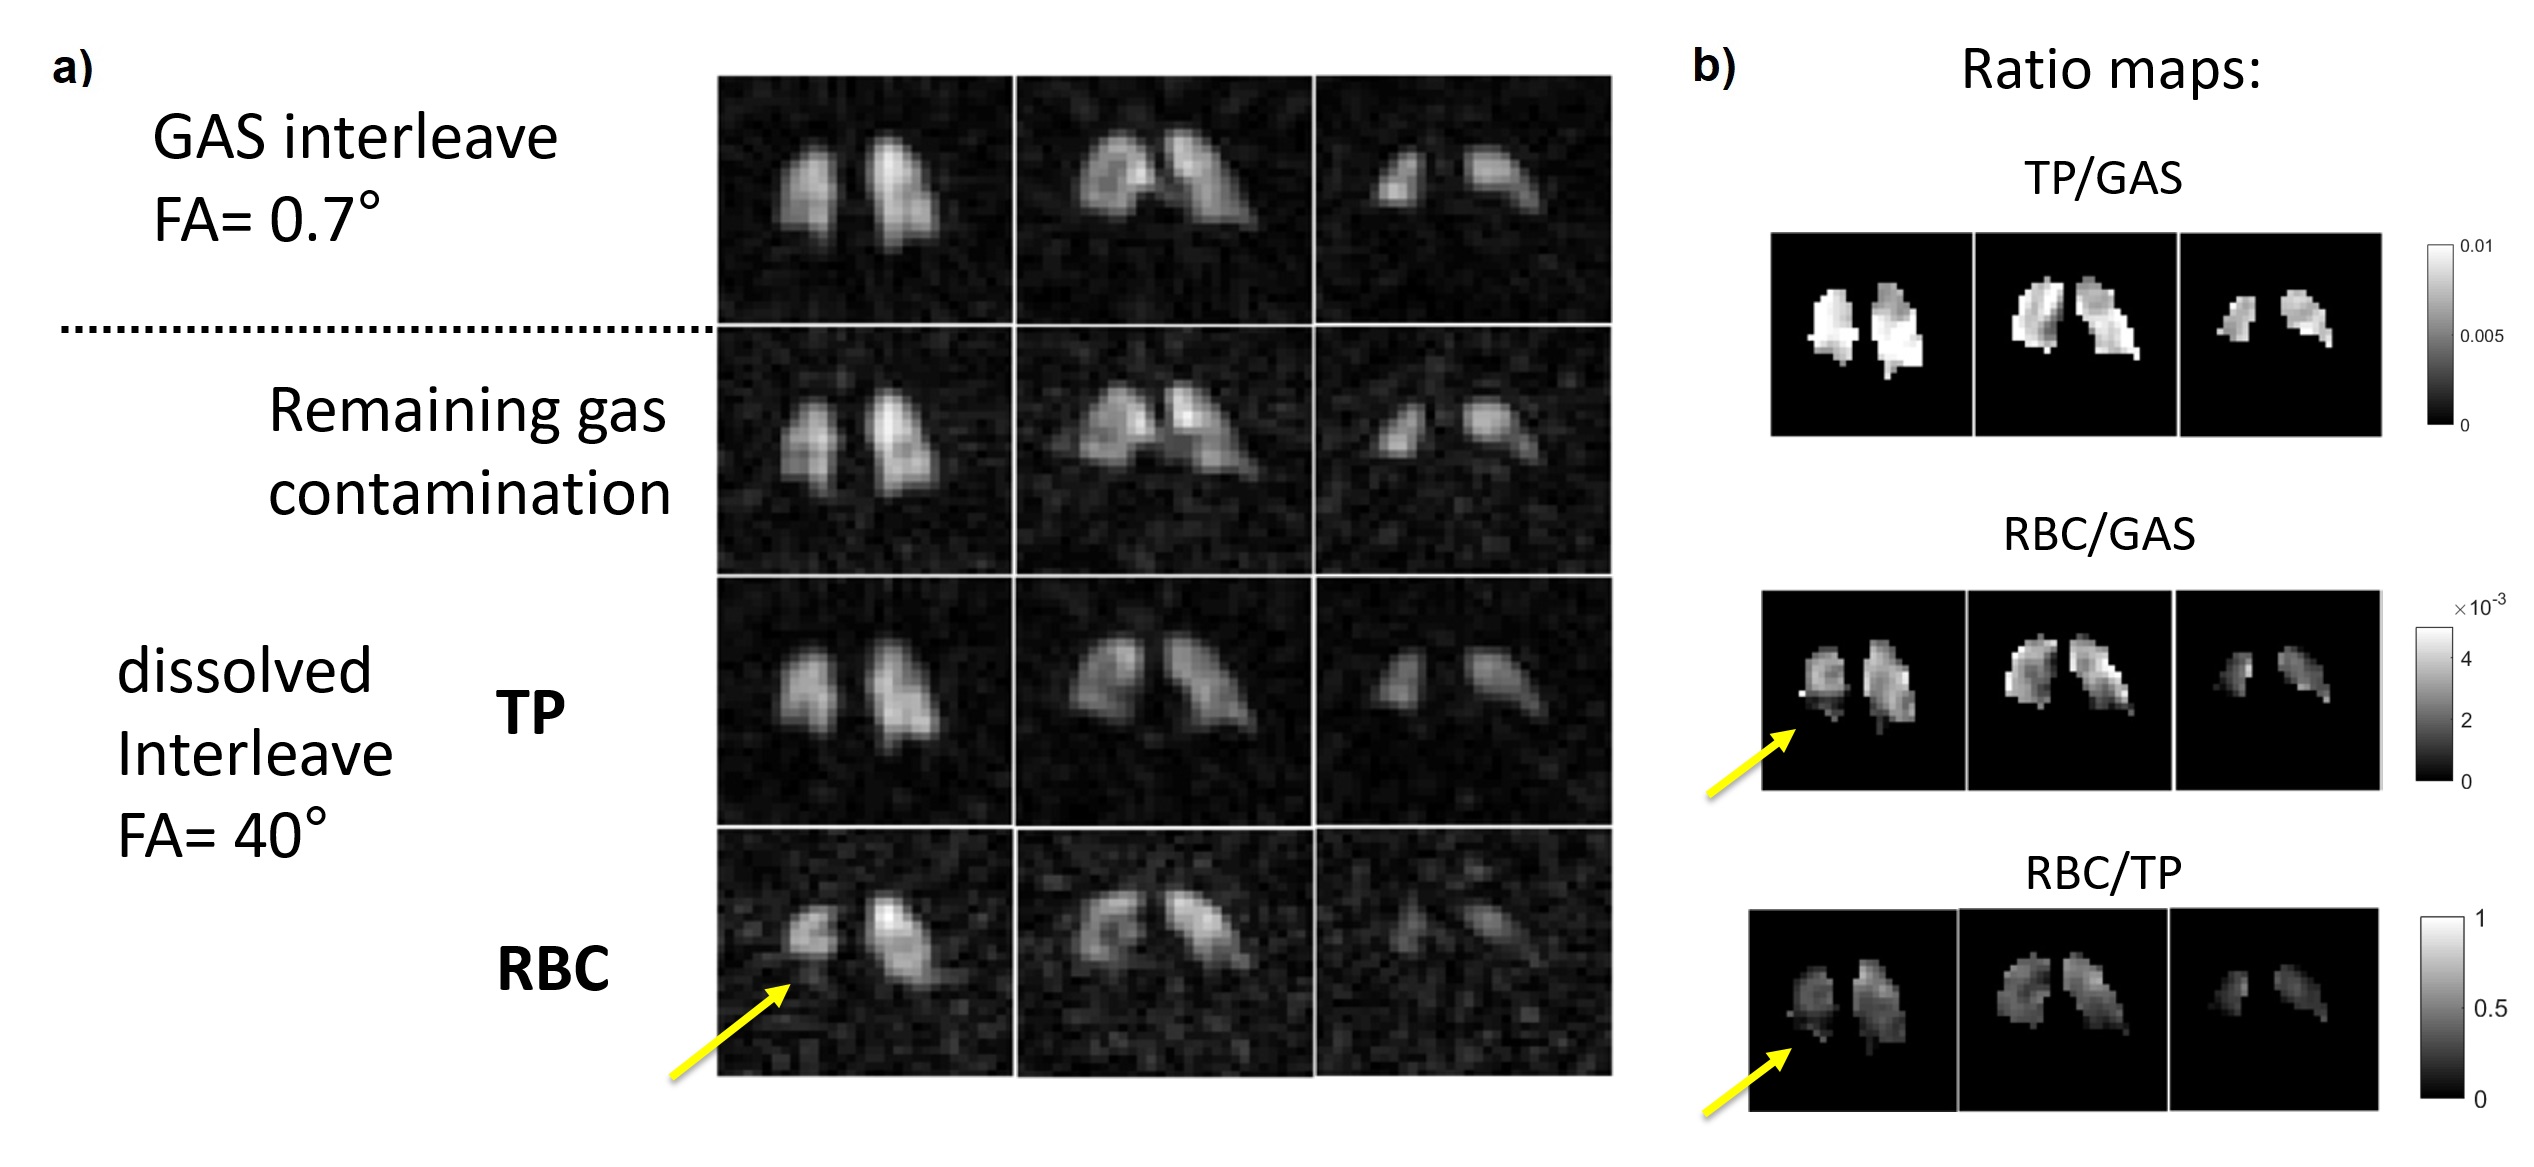
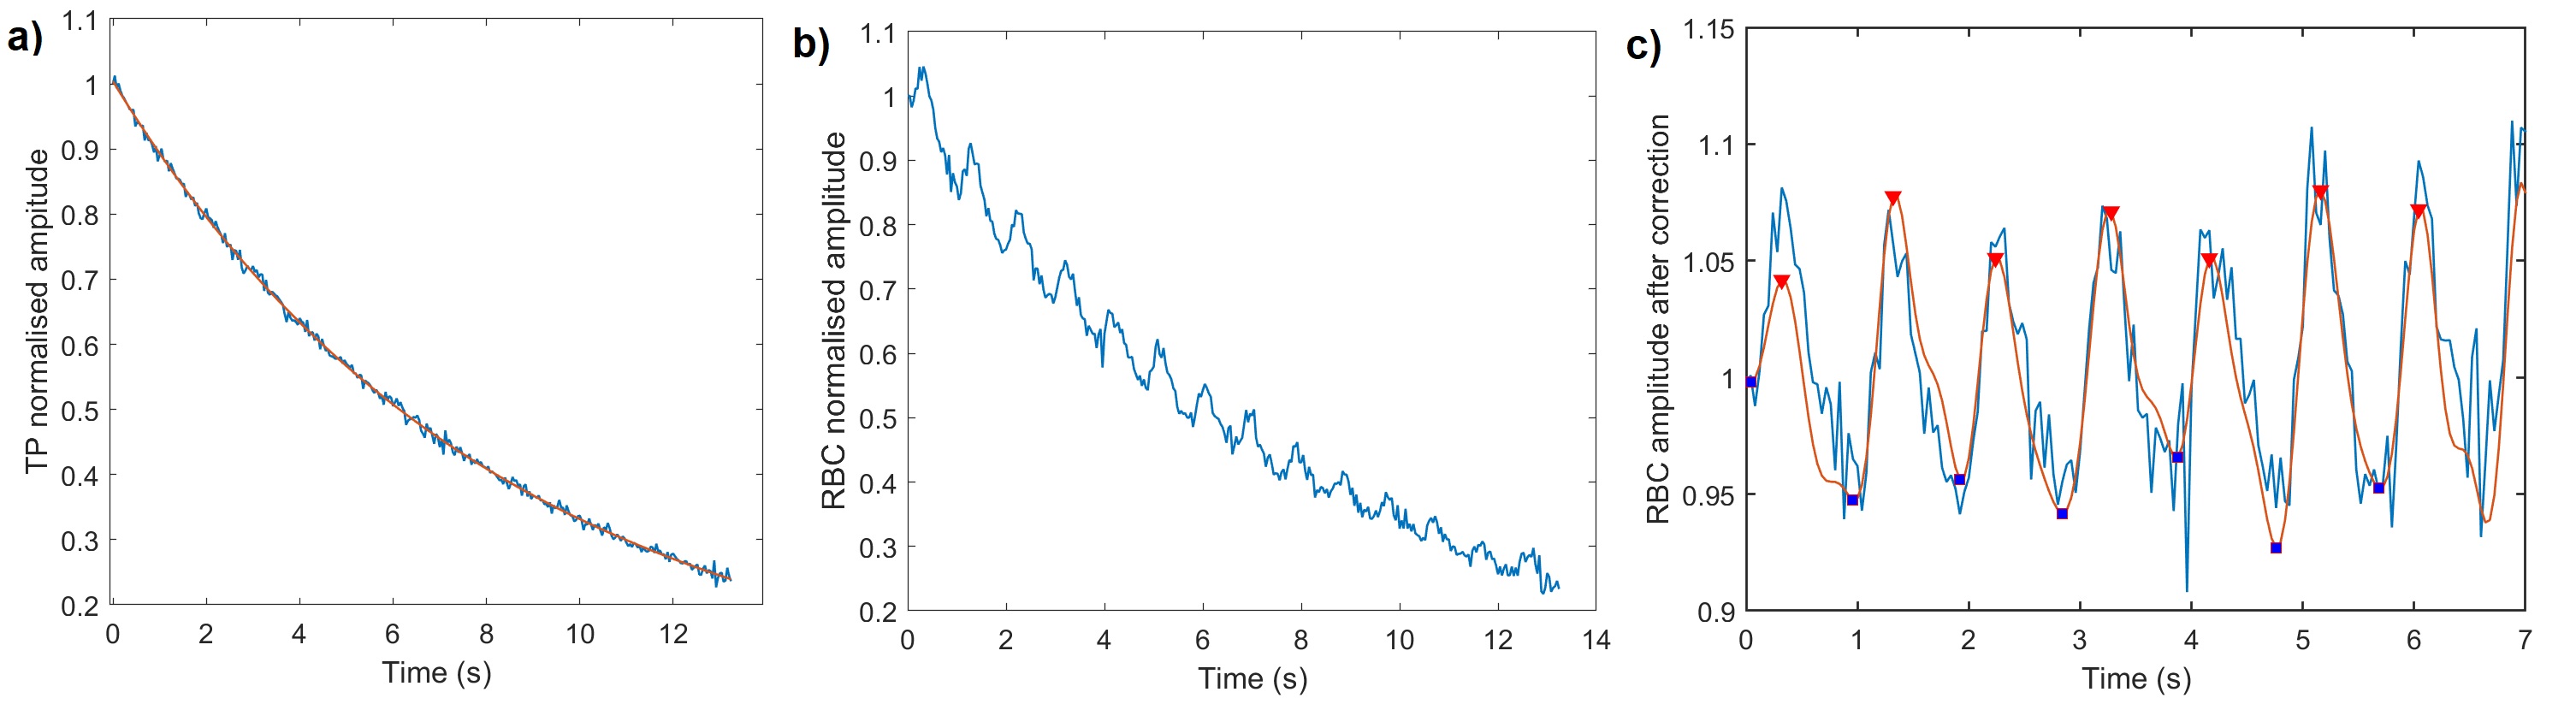
The methodology for spectroscopic imaging of 129Xe gas/dissolved compartments follows the IDEAL type of water-fat separation applied previously to 13C metabolic imaging4. In this work, a multiple TE (4 TEs per TR) flyback radial SPGR sequence with interleaved RF excitations of gaseous and dissolved-phase 129Xe (FA= 0.7/40°, respectively) was implemented. A 0.8ms composite RF pulse with amplitude modulation - optimised previously for minimising off resonance excitation5, and an optimal TE spacing of 0.7ms calculated using the effective number of signal averages approach4 were used. The 2cm isotropic 3D half-echo radial pattern had 332 projections (FOV=40cm, BW=31.25kHz, TR=20ms, 14s breath-hold acquisition, 1L of HP 129Xe at ~30% polarisation6). A whole-lung spectrum (BW=8kHz, 512pts, 200 averages, TR=74ms, 22˚ flip angle) was acquired with a 600mL dose of 129Xe prior to imaging to improve reconstruction by providing accurate determination of the respective 129Xe resonance frequencies. After performing decomposition and correction for the additional phase accumulated by off-resonant spins at each point in the k-space, images and ratio maps of RBC/TP, TP/GAS and RBC/GAS were produced (Fig. 1). Global and regional averages (inferior, middle and superior parts of the lungs) were derived for each subject. With the chosen radial encoding scheme, the centre of k-space for each compartment was sampled every 40ms, enabling the observation of the dissolved 129Xe signal decay during breath-hold and also the cardiogenic oscillations of the RBC signal7. The peak-to-peak amplitude of the RBC signal oscillations was calculated (Fig. 2). IPF subjects underwent spirometry to measure forced vital capacity (FVC%) and the diffusing capacity of the lung for carbon monoxide (DLCO%). Unpaired t-test statistics was used to test for significant differences in RBC amplitude oscillations, global and regional dissolved imaging ratios between HV and IPF subjects.Results
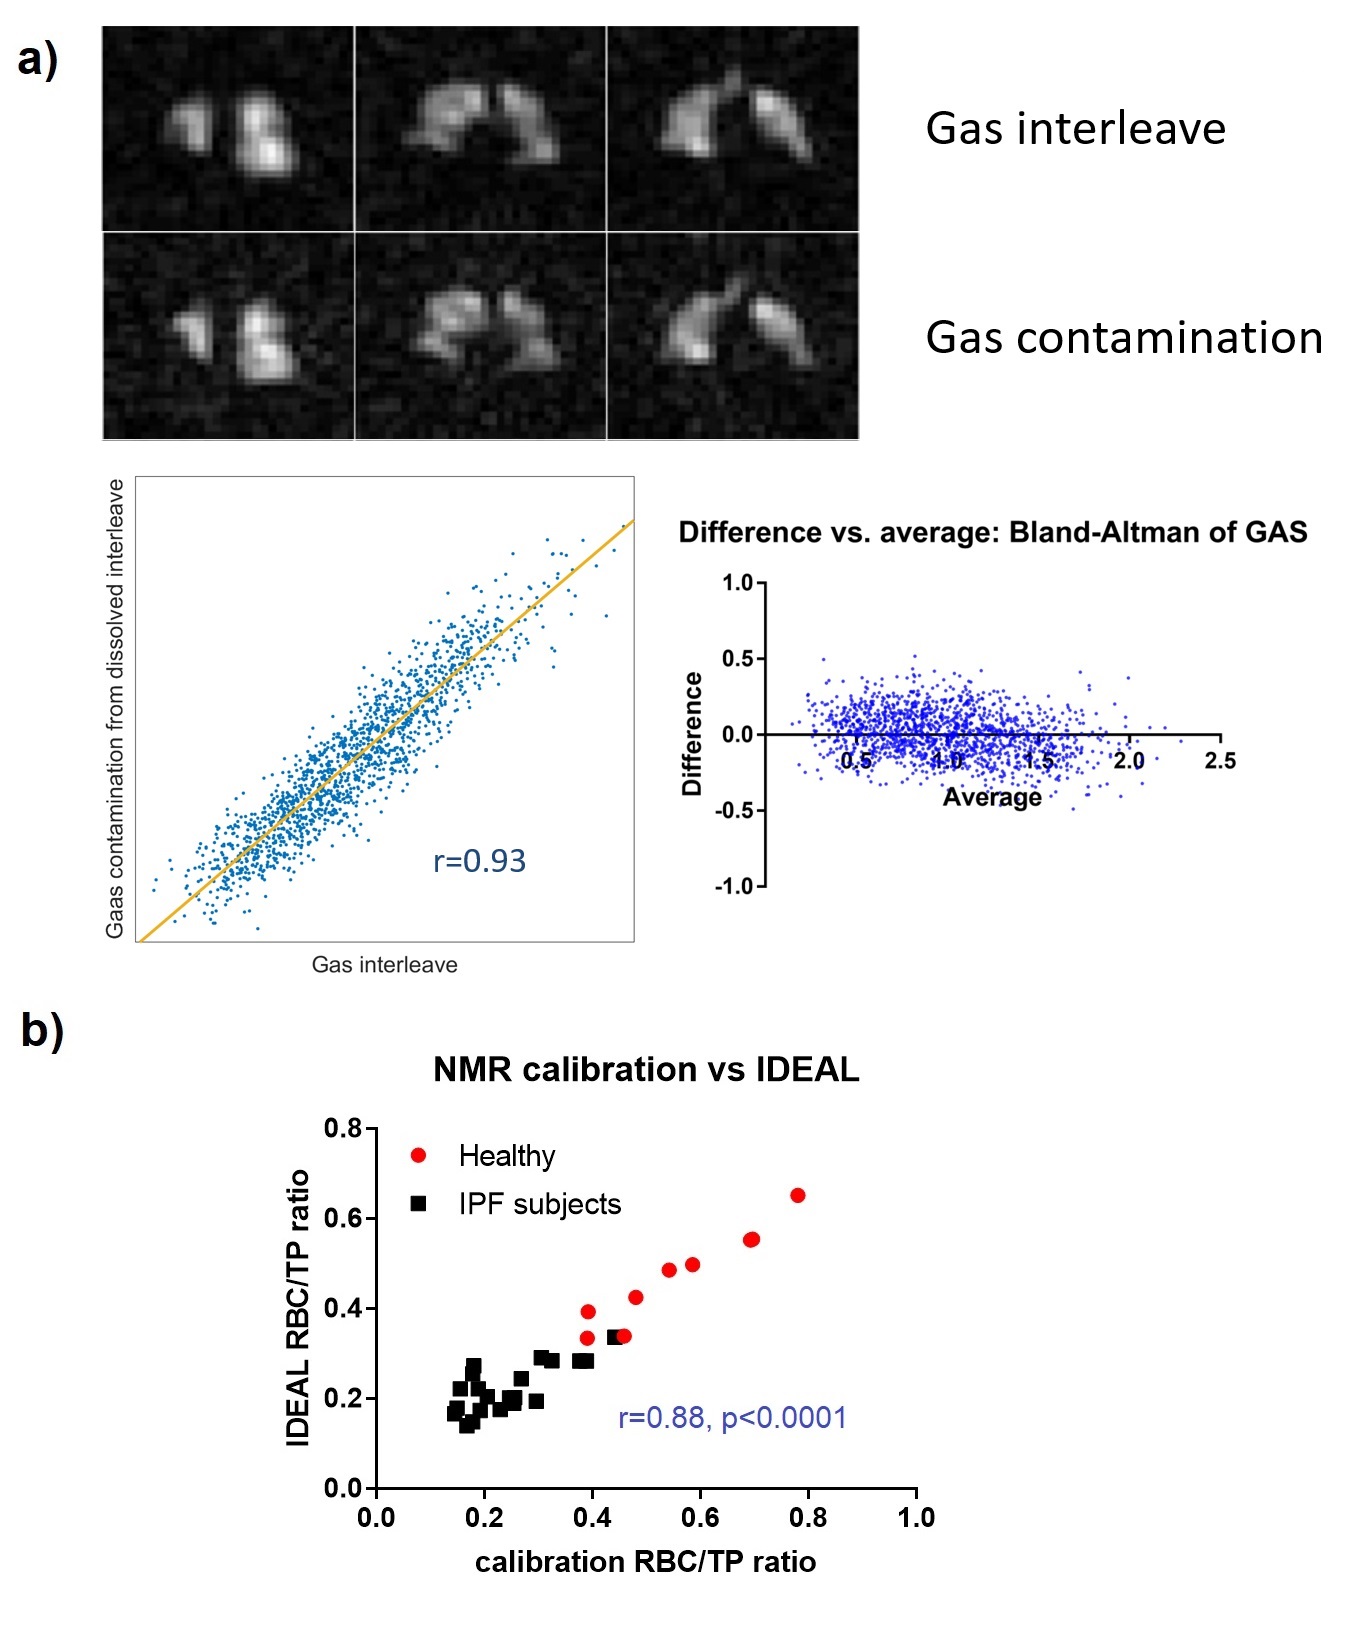
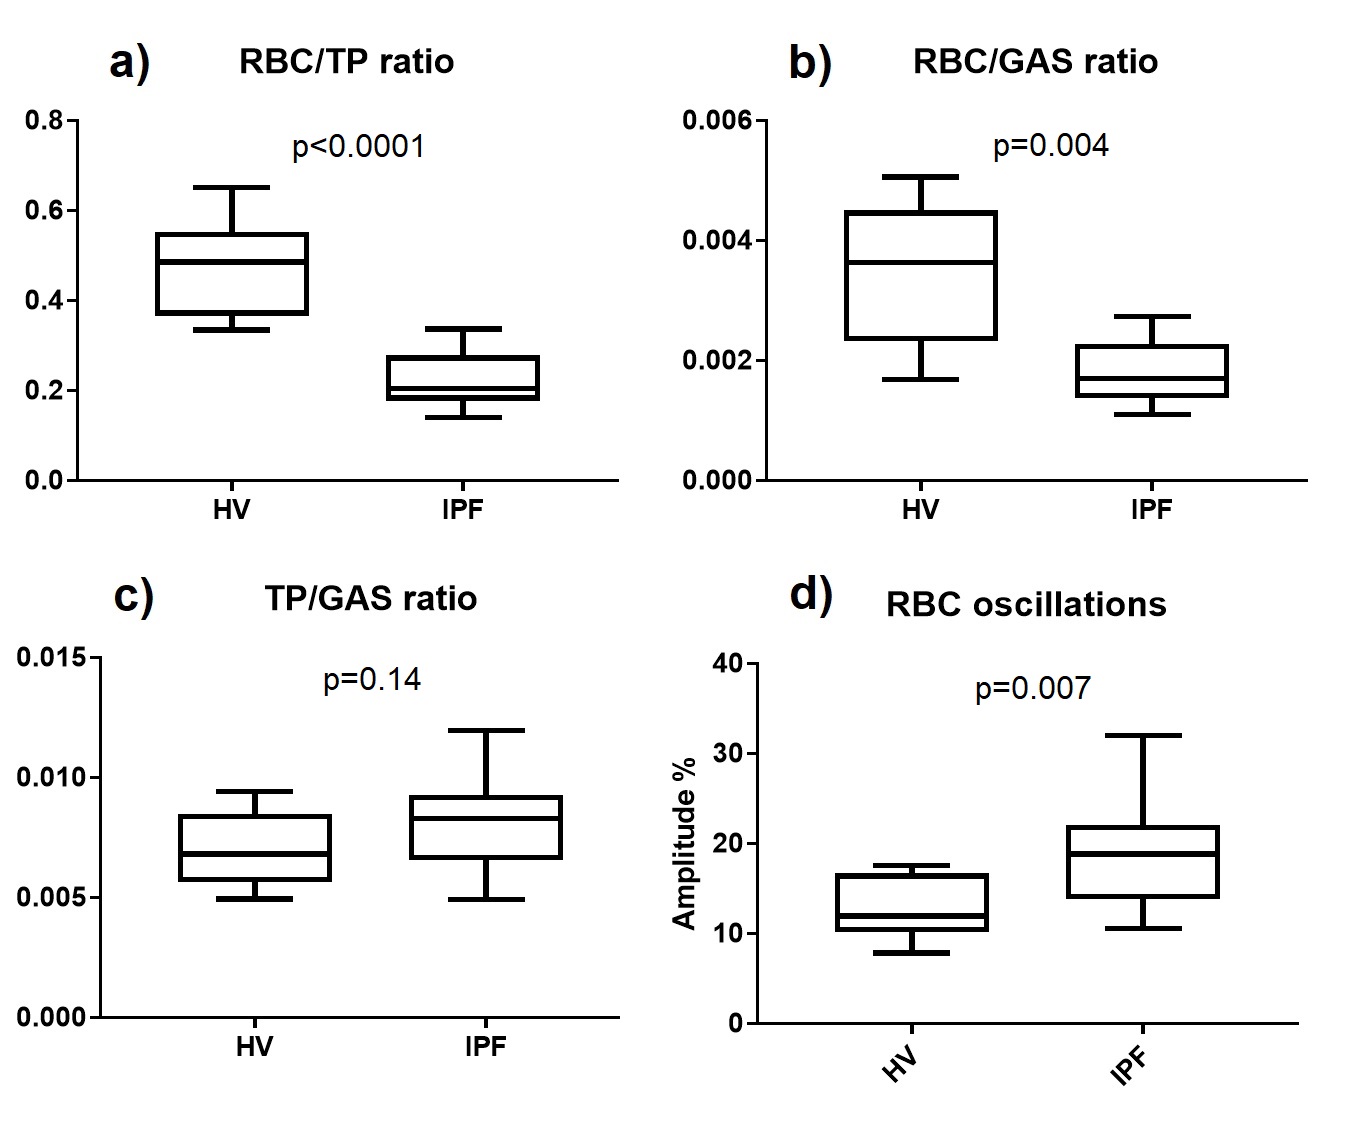
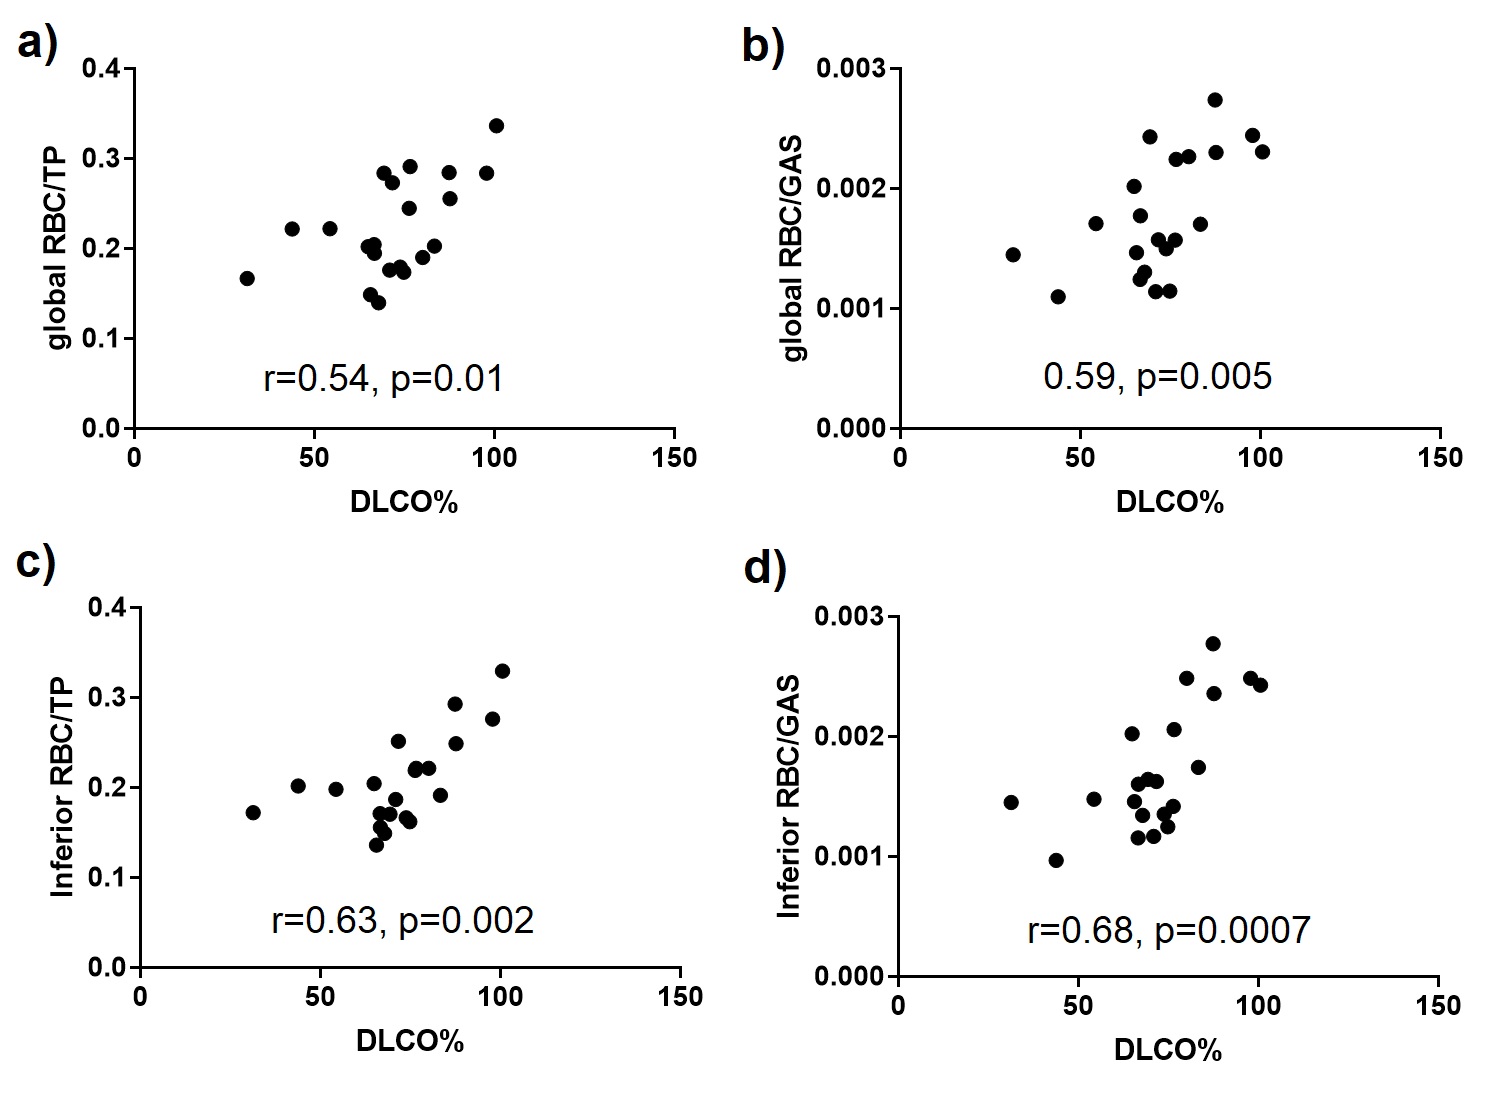
9 HV (8M/1F, 37yrs [25, 65], median [min, max]) and 21 subjects with IPF (17M/4F, 73yrs [53, 80], DLCO%: 72% [31%, 101%], FVC%: 93% [67%, 122%]) were scanned. The IDEAL reconstruction was successful at removing 129Xe gas contamination from dissolved 129Xe data (Fig. 3.a) and producing 3D maps of TP and RBC uptake in the lung. A high correlation was found between the global RBC/TP imaging ratio and the ratio derived from the whole-lung spectrum (Fig 3.b). Cardiogenic oscillations were observed only on the RBC signal and the amplitude of the oscillations was significantly higher in subjects with IPF when compared to healthy controls (Fig 4.d, p=0.007). The average imaging RBC/TP and RBC/GAS ratios were significantly lower in subjects with IPF (p<0.0001 and p=0.004 respectively, Welch’s t-test) but no significant difference was observed in TP/GAS ratio (p=0.14, Fig. 4.c). For IPF subjects, RBC/TP and RBC/GAS ratios were significantly correlated with DLCO% and the correlations were stronger in the inferior part of the lung (Fig. 5). No correlation was observed with TP/GAS ratio or with FVC%. In IPF subjects, RBC/TP and RBC/GAS ratios were significantly lower in the inferior part of the lung (1-way ANOVA, p=0.0009).Discussion
The average 129Xe imaging ratios, ratio differences and correlations with DLCO% observed in this study are in agreement with previously published data for HV and IPF patients, apart from a non-significant increase in TP/GAS ratio. The reduced imaging gas transfer in the inferior part of the lung can be explained by the predominantly basal and peripheral presentation of fibrosis in IPF. The main advantage of the presented technique is the implementation of the phase shift correction and CS separation in k-space. When performed in image space, the reconstruction assumes a singular echo time that may result in severe image blurring, especially when using a 1-point Dixon separation technique3. Acquiring a higher number of echoes than the number of compartments also significantly improves peak separation, allowing better gas phase contamination removal from the dissolved data.Conclusions
A novel 4-echo IDEAL CSI technique for dissolved xenon imaging has been implemented and successfully validated against global spectroscopy measurements. Reduced imaging gas transfer and higher cardiogenic oscillations were observed in patients with IPF when compared to HV.Acknowledgements
This work was supported by NIHR grant NIHR-RP-R3-12-027 and MRC grant MR/M008894/1. The views expressed in this work are those of the author(s) and not necessarily those of the NHS, the National Institute for Health Research or the Department of Health.References
1: Stewart, N., et al. Magn Reson Med 74: 196-207 (2015).
2: Qing, K., et al. JMRI 39: 346-359 (2014).
3: Kaushik, S., et al. Magn Reson Med 75: 1434-1443 (2016).
4: Wiesinger, F., et al. Magn Reson Med 68: 8-16 (2012).
5: Leung, G., et al. Magn Reson Med 73: 21-30 (2015).
6: Norquay, G., et al. Phys Rev Let 121: 21-30 (2018).
7: Bier, E., et al. NMR Biomed 32, 10.1002/nbm.4029 (2019)
Figures