2282
Simple Method for Off-Resonance Gas Artifact Removal in 129Xe Gas-Transfer MRI1Cincinnati Children's Hospital Medical Center, Cincinnati, OH, United States, 2University of Cincinnati, Cincinnati, OH, United States
Synopsis
Hyperpolarized dissolved-phase 129Xe imaging allows pulmonary gas transfer processes to be quantified at multiple stages and physical abnormalities in gas-exchange to be identified in subjects with pulmonary disease. However, the technique is hindered by gas-phase contamination due to imperfect frequency-selective excitation of the 50-fold larger pool of gaseous 129Xe. The previous method to remove this contamination required additional echoes. We present a simple post-acquisition method to remove gas-phase contamination with >90% efficiency. This method can be applied to the standard gas-transfer MRI sequence, thus permitting contamination removal for existing data, facilitating more accurate and consistent hyperpolarized 129Xe gas-transfer imaging.
Introduction
Hyperpolarized 129Xe dissolved-phase MRI allows pulmonary gas-transfer to be quantified, permitting lung regions with impaired gas exchange to be identified in pulmonary diseases[1, 2]. Within a ~16s breath hold, the imaging sequence provides gas-phase images showing regional lung ventilation, barrier-uptake images that quantify the amount of xenon dissolved in interstitial lung tissue and blood plasma, and RBC-transfer images that depict the amount of Xe dissolved in the red-blood cells. However, the barrier-uptake and RBC-transfer images can be contaminated with highly-off-resonant (>200 ppm) gas-phase signal from imperfectly selective excitation, hindering accurate quantification. The previous contamination removal method required a second echo where the dissolved Xe signals are no longer present, limiting its usage[3]. We propose an effective method to remove gas-phase contamination using only data collected as part of the more common, single-echo gas-transfer sequence.Methods
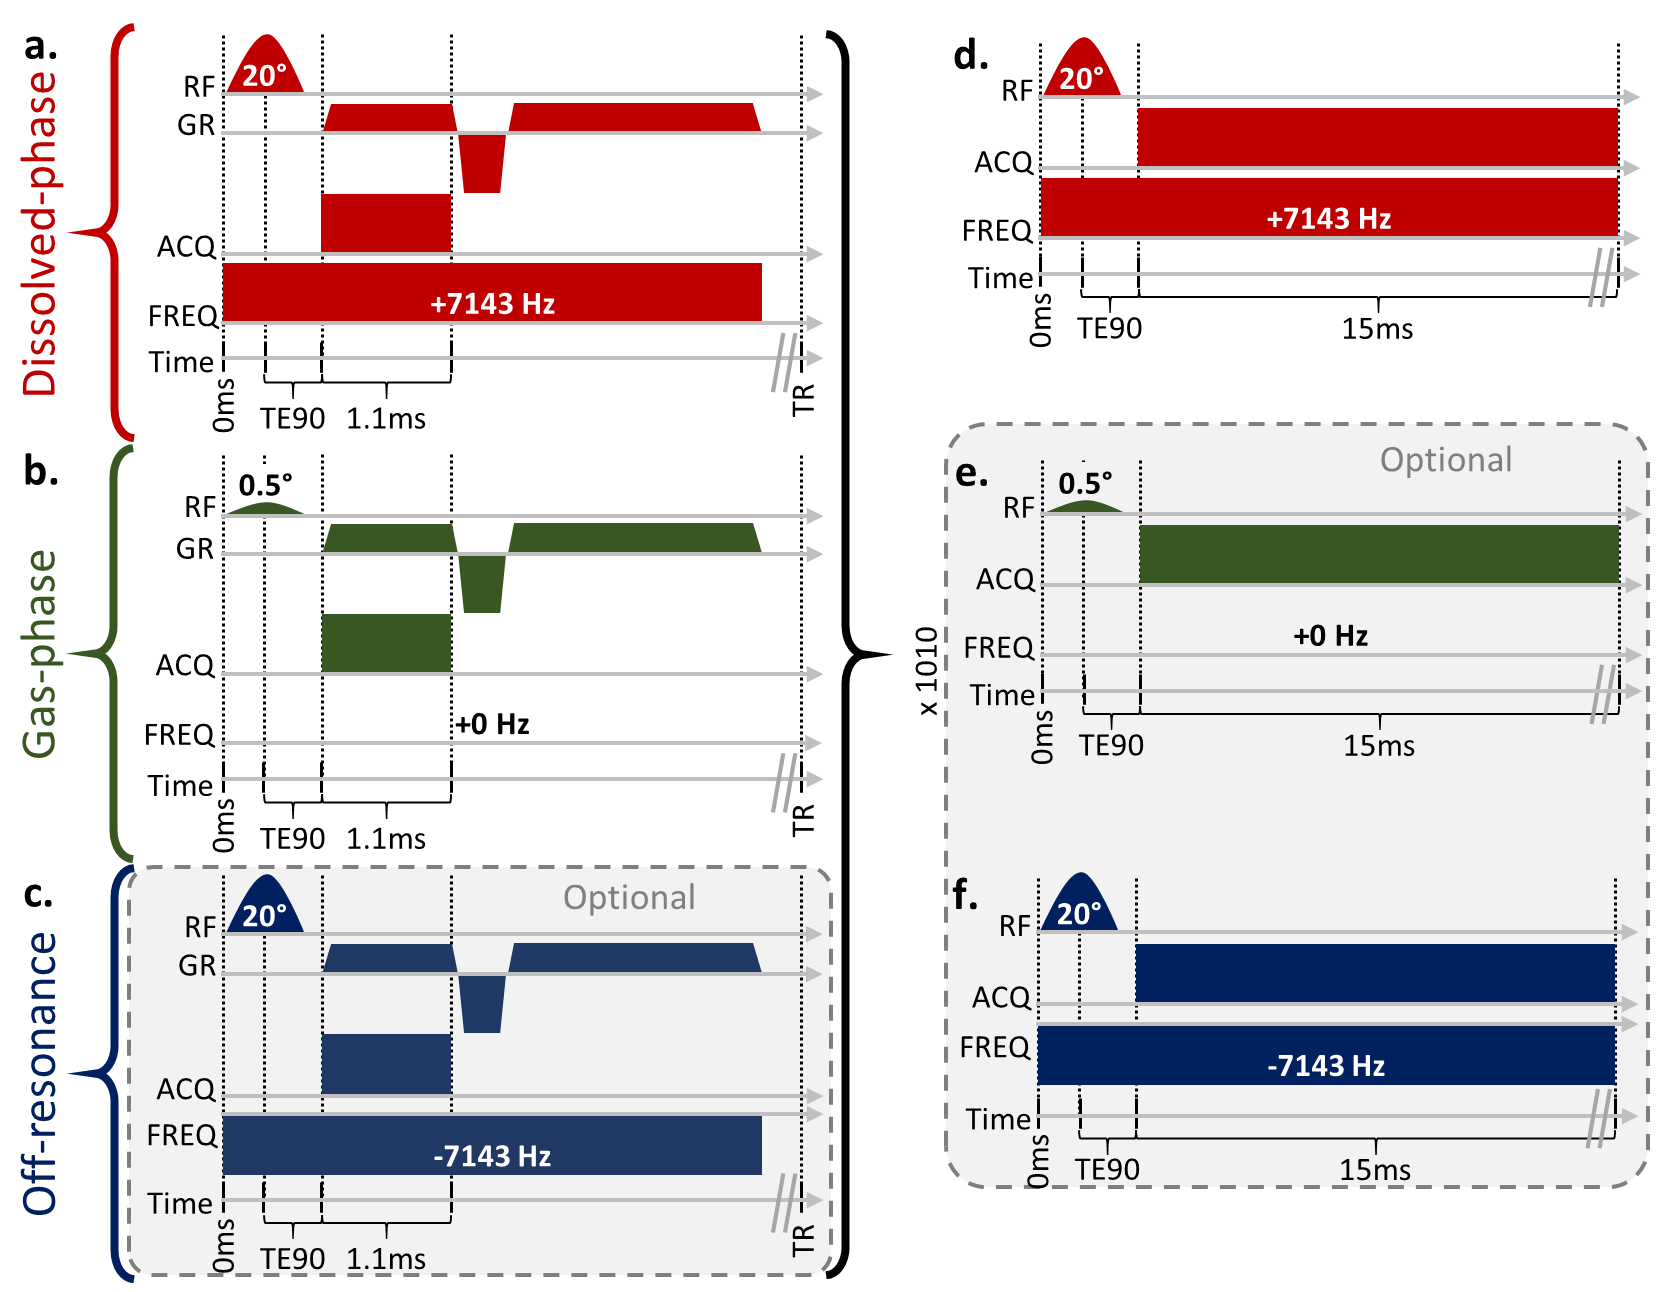
Two phantoms and one healthy subject were imaged according to a protocol approved by our local Institutional Review Board (with FDA IND 123,577). 129Xe (83% enriched) was polarized to ~30% via a 129Xe hyperpolarizer (Polarean 9820). Phantoms consisted of 300mL Xe with 700mL of N2, while the subject inhaled 1L Xe. 129Xe gas-transfer MRI was acquired using a 3.0T Philips Achieva scanner and custom-built 129Xe dual-loop coil[4].129Xe gas-transfer MRI was implemented similarly to the more common 1-point Dixon technique proposed by Wang et al.[2]. Slight modifications were made to illustrate the contamination-removal technique, including a third frequency acquisition measuring the shape and intensity of the contamination, but are optional (Figure 1). Briefly, three interleaved 3D-radial views with identical trajectories but with excitation frequencies corresponding to dissolved-phase (202 ppm, barrier plus RBC), gas-phase, and off-resonance gas contamination (-202 ppm) were acquired. Spectra were obtained for each imaging frequency before and after the imaging. Imaging parameters were: FOV = 325×325×325 mm3, matrix = 563, TR = 5ms (effectively 15ms between same-frequency pulses), dwell time = 19.1µs, 950 radial projections, and 58 readout points. Spectral parameters were: dwell time = 19.1µs, and 789 points.
Images were reconstructed in MATLAB using open-source reconstruction software[5] utilizing iterative density compensation[6] and a kernel sharpness value (σ) of 0.14 and extent of 9σ. Removal of the gas-phase contamination uses the gas-phase k-space data, sg(k), as the initial estimate of contamination and requires four steps (Figure 2): 1) first-order phase correction, 2) zeroth-order phase correction, 3) intensity scaling and 4) subtraction of contamination.
First-order phase correction used the spectra acquired at the end of the breath hold to calculate the frequency difference, (Δf), between the gas-phase signal and the dissolved-phase receiver frequency and modulating the data according to sg(k)e2πiΔft, where t is the dwell time multiplied by n-1, where n is the number of the k-space point on the FID.
Zeroth-order phase correction accounted for the accumulation of phase before acquisition and was determined by the phase difference (Δφ) of the spectroscopic gas peak and the mean phase of the k0 points. This fixed phase difference can be accounted for similarly to the first-order phase correction via sg(k)eiΔφ.
Scaling of the k-space intensity was determined from spectral and imaging data. Xe signal intensity in the gas-phase (Igas) imaging data was determined from the intensity of the final k0 point. The dissolved-phase spectrum was used to determine the intensity of the barrier, RBC, and gas components, the last of which was the gas contamination intensity in the dissolved-phase (Idissolved,gas) imaging data. Thus, the scale factor (β) can be determined by β=Idissolved,gas/Igas.
Subtraction of the contamination occurred in k-space and modified the gas-phase k-space data according to these equations. Comparisons between pre- and post-removal were completed by generating a lung mask from the ventilation images and noise masks containing all voxels > 7 voxels away from the lung mask. For the phantom, which doesn’t contain dissolved Xe signal, all voxels were taken as noise in the dissolved-phase images.
Results
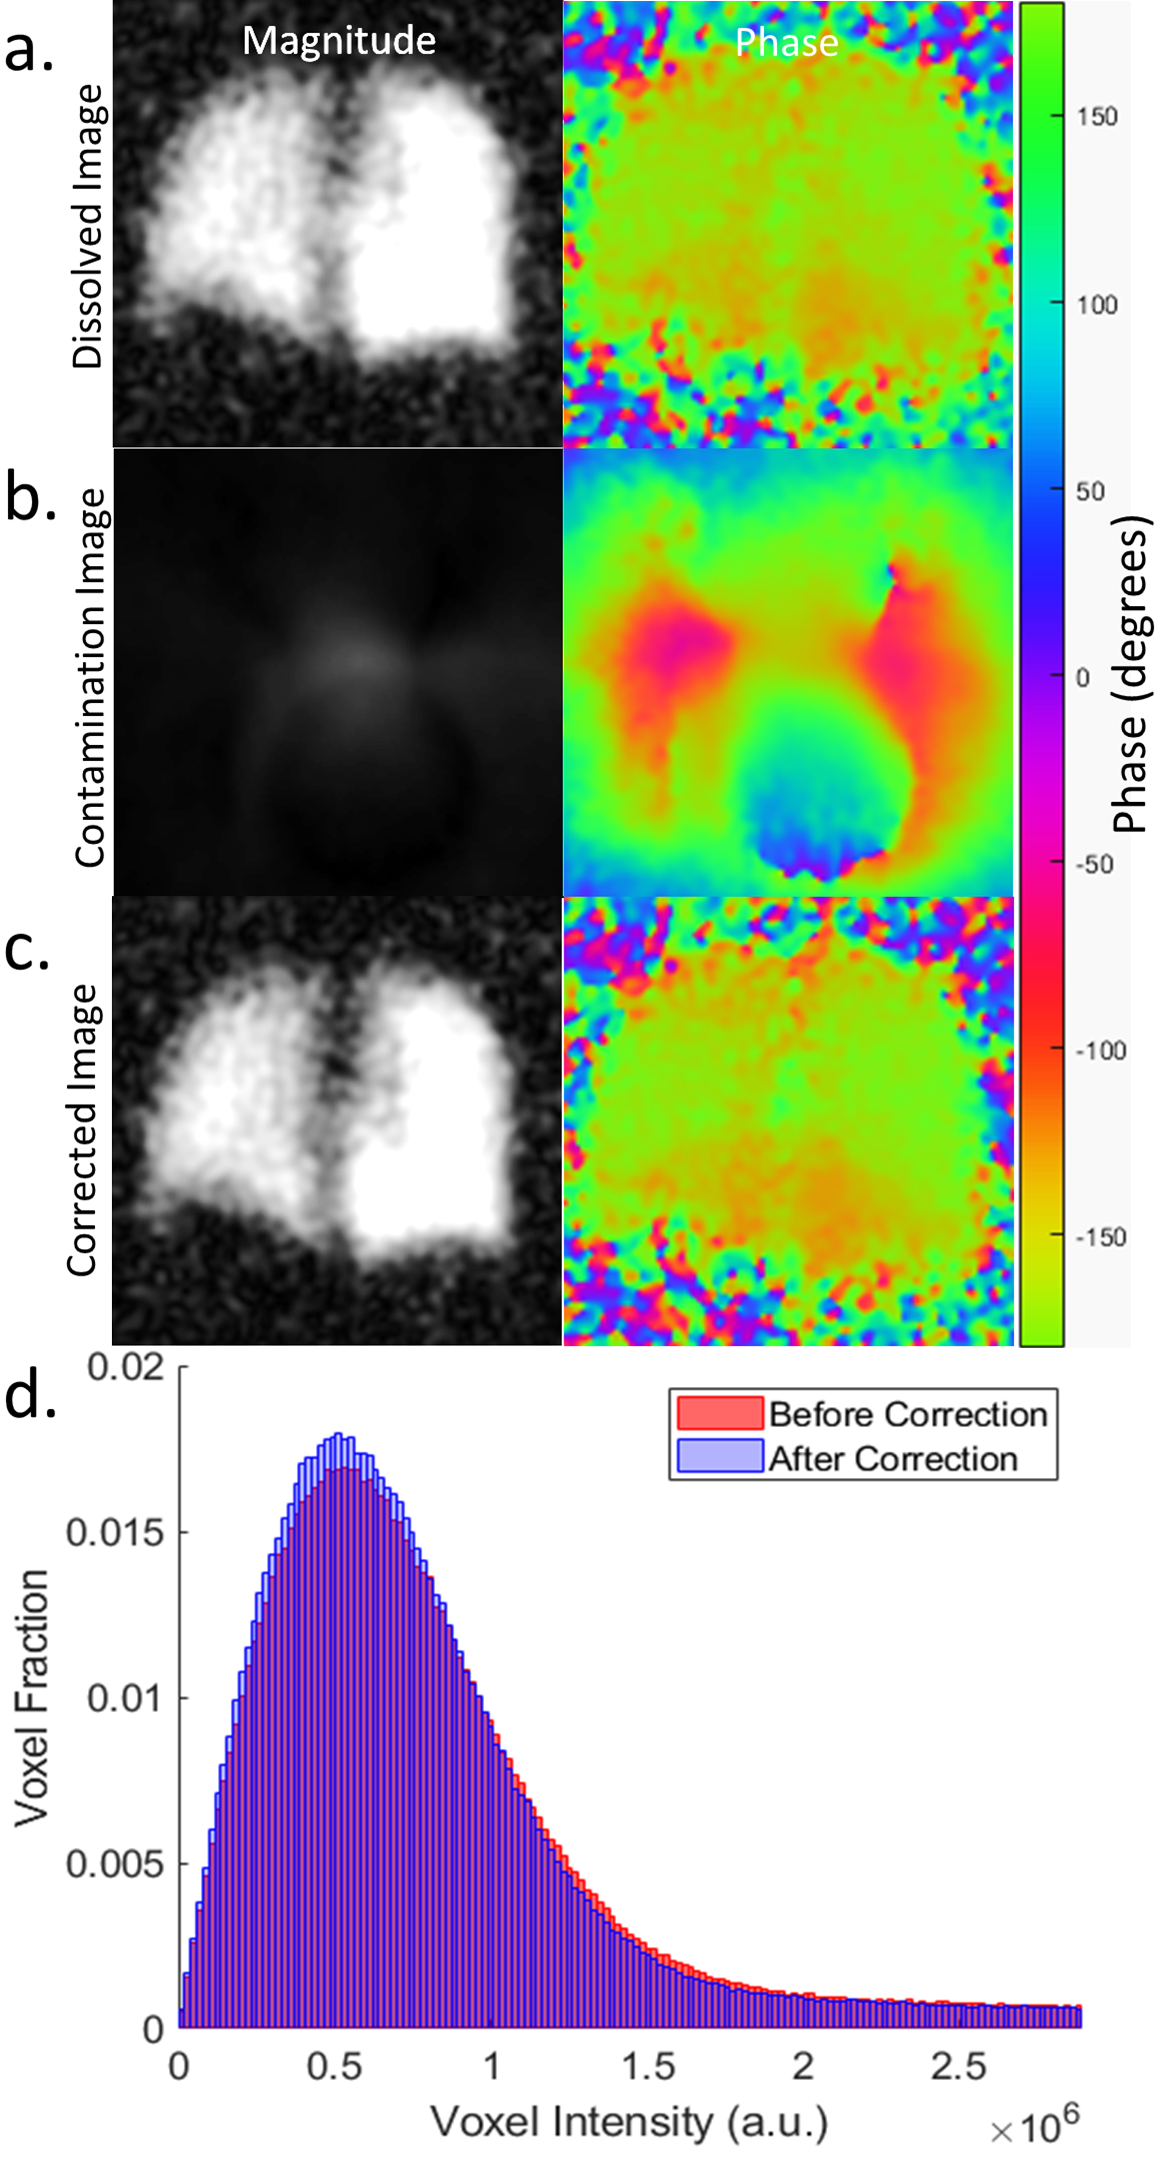
In phantoms (Figure 3), mean noise and standard deviation decreased by 74% and 83%, respectively. The skew of the noise decrease from 1.65 to 0.79 (expected 0.63 for the Rayleigh distribution of MRI noise[7]) while kurtosis decreased from 6.9 to 3.7 (expected 3.3). Since no dissolved components were present, the remaining gas contamination was 6.4%, a 93.6% efficiency for both phantoms. For the healthy subject (Figure 4), mean noise and standard deviation decreased by 5% and 10%, respectively. The skew of the noise decrease from 2.3 to 2.1 while kurtosis decreased from 13.3 to 11.8. Contamination removal resulted in an 8% SNR increase.Discussion
Phantom results illustrate >90% effectiveness of removing the contamination using the commonly acquired spectral and imaging data. Human subject results show increased SNR with a smaller reduction in noise, likely due to the blurring of the dissolved-phase image intensity, physiological noise, and the minor levels and disperse nature of the contamination at 3.0T.Conclusion
Accurate and effective gas-phase contamination removal from dissolved 129Xe gas-transfer images is possible without sequence modifications, permitting application to previously-acquired and future data. Contamination removal allows more accurate quantification of gas exchange and more consistent/reliable results which could permit multi-site investigations implementing 129Xe gas-transfer imaging.Acknowledgements
The authors thank the following sources for research funding and support: NIH R01 HL131012, NIH R01 HL143011, NIH R44 HL123299, NIH K99 HL138255, and NIH T32 HL007752.References
[1] Wang Z, Robertson SH, Wang J, et al.: Quantitative analysis of hyperpolarized 129 Xe gas transfer MRI. Med Phys 2017; 44:2415–2428.
[2] Wang Z, He M, Bier E, et al.: Hyperpolarized 129 Xe gas transfer MRI: the transition from 1.5T to 3T. Magn Reson Med 2018; 80:2374–2383.
[3] Hahn AD, Kammerman J, Fain SB: Removal of hyperpolarized 129 Xe gas-phase contamination in spectroscopic imaging of the lungs. Magn Reson Med 2018; 80:2586–2597.
[4] Loew W, Thomen RP, Giaquinto R, et al.: A dual loop T/R‐xenon coil for homogenous excitation with improved comfort and size. In Proc 24th Annu Meet ISMRM, Singapore; 2016.
[5] Robertson SH, Virgincar RS, He M, Freeman MS, Kaushik SS, Driehuys B: Optimizing 3D Noncartesian Gridding 129Xe MRI—Focus on Hyperpolarized Reconstruction for Preclinical Applications. Concepts Magn Reson Part A 2015; 44A:190–202.
[6] Pipe JG, Menon P: Sampling density compensation in MRI: Rationale and an iterative numerical solution. Magn Reson Med 1999; 41:179–186.
[7] Gudbjartsson H, Patz S: The Rician distribution of noisy MRI data. Magn Reson Med 1995; 34:910–4.
Figures