2280
Impact of Vessel Wall Characteristics on Quantitative 4D-Flow Dynamics in Compliant 3D-Printed Thoracic Aorta Models.1Radiology, Stanford University, Stanford, CA, United States, 2Computer Science, Technical University of Munich, Munich, Germany, 3Radiology, Veterans Administration Health Care System, Palo Alto, CA, United States, 4Pediatrics, Stanford University, Stanford, CA, United States, 5Cardiovascular Institute, Stanford, CA, United States
Synopsis
A detailed understanding of flow dynamics in the aorta is of clinical interest and enabled by 4D-flow MRI. This work presents an in vitro flow circuit that embeds a subject-specific 3D-printed compliant aorta model to demonstrate feasibility while also exploring the impact of vessel wall characteristics (thickness, stiffness) and heart rate on quantitative flow dynamics. The experimental setup will be a valuable tool for assessing 4D flow MRI sampling requirements, generating high-quality ground truth data for CFD and FSI validation, as well as studying flow dynamics in different vascular pathologies.
Introduction
Pulse wave velocity (PWV) is recognized as a metric of aortic wall stiffness and may inform the diagnosis and disease management of several vascular pathologies.1-3 4D-flow MRI outputs velocity maps from which PWV can be estimated.4,5 The sensitivity of PWV to true changes in stiffness and wall thickening, however, remains uncertain and is impacted by the 4D-flow image quality which – in the clinical setting – has modest spatiotemporal resolution and signal-to-noise-ratio (SNR). This work utilizes a novel approach to subject-specific 3D-printing of compliant thoracic aorta models. The objectives of this work were: (1) to demonstrate feasibility of an in vitro flow circuit setup using a subject specific healthy thoracic aorta model; and (2) to analyze the impact of vessel wall characteristics (thickness, stiffness) and heart rate (HR) variability on quantitative flow dynamics.Methods
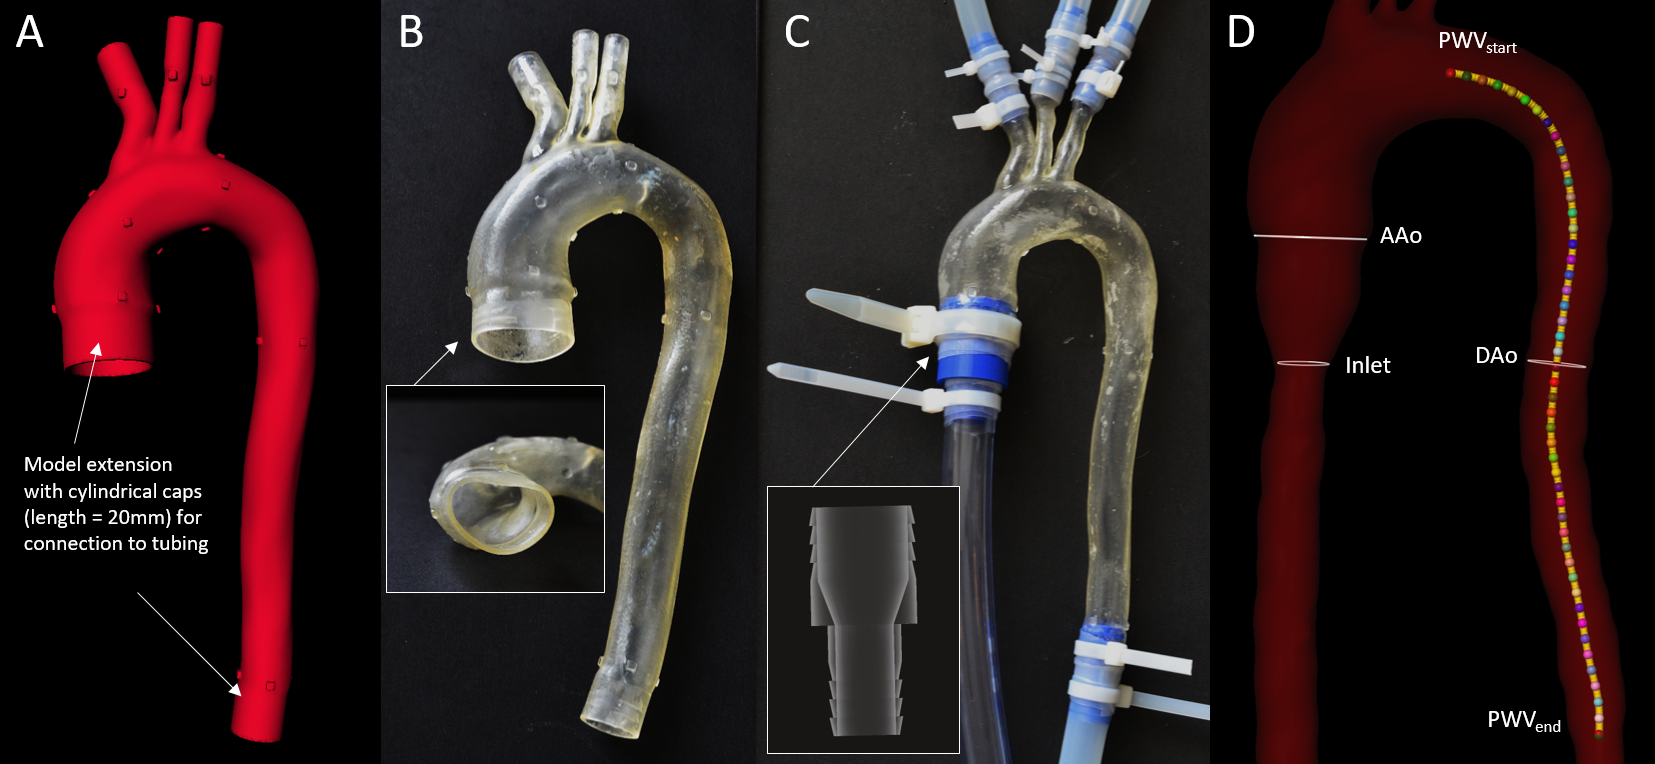
Thoracic aorta models: A 4D-flow MRI dataset of a healthy subject was used to generate a polygon mesh model of the thoracic aorta wall (Fig. 1A). The model was printed (scale 1:1) using 3D additive manufacturing (J735 PolyJet, Stratasys) and a compliant photopolymer material (Agilus, Stratasys) in three configurations (Fig. 1B):- M1_1.6_soft with 1.6 mm wall thickness and Young’s modulus = 0.7 MPa (Agilus30);
- M2_2.0_soft with 2 mm wall thickness and Young’s modulus = 0.7 MPa (Agilus30);
- M3_2.0_hardened with 2 mm wall thickness and Young’s modulus = 3.5 MPa (Agilus60).
4D-flow: Each model was embedded into a pulsatile flow circuit (Fig. 2, animated) that includes an MRI-compatible and programmable pump system (CardioFlow 5000, Shelley Medical). Six liters of glycerol-water fluid (ratio = 2/3) infused with T1-shortening contrast agent (Ferumoxytol, 0.75 ml per liter of fluid) was used to mimic blood viscosity with increased SNR. Six 4D-flow MRI datasets were acquired with: TE/TR [ms] = 2.6/5.2; flip angle [degree] = 12; spatial resolution [mm3] = 2.5x2.5x2.5; FOV [mm2] = 320x320; matrix = 128x128; num. slices = 36; temporal resolution [ms] = 20.6; averages = 1; VENC [cm/s] = 150; 2x GRAPPA (ref. lines = 24); and prospective external triggering. For each model, we applied the subject-specific flow rate waveform - derived from in vivo 4D-flow MRI data, scaled to meet 300ml/s peak flow rate pump limit -, and acquired data with two heart rates (both settings a total flow volume of 4.38l/min):
- HR=60/min (RR=1008ms, frames=48);
- HR=100/min (RR=594ms, frames=28).
- image background noise filtering to improve performance of automated analysis;
- fully-automated phase unwrapping based on PRELUDE;6
- 3D watershed segmentation of the aortic lumen;
- lumen centerline detection.7
- definition of descending aorta (DAo) centerline (distal to left subclavian artery to end of model, length=240mm);
- computation of flow rate curves at equidistant cross-sectional DAo planes (N=48, spacing=5 mm);
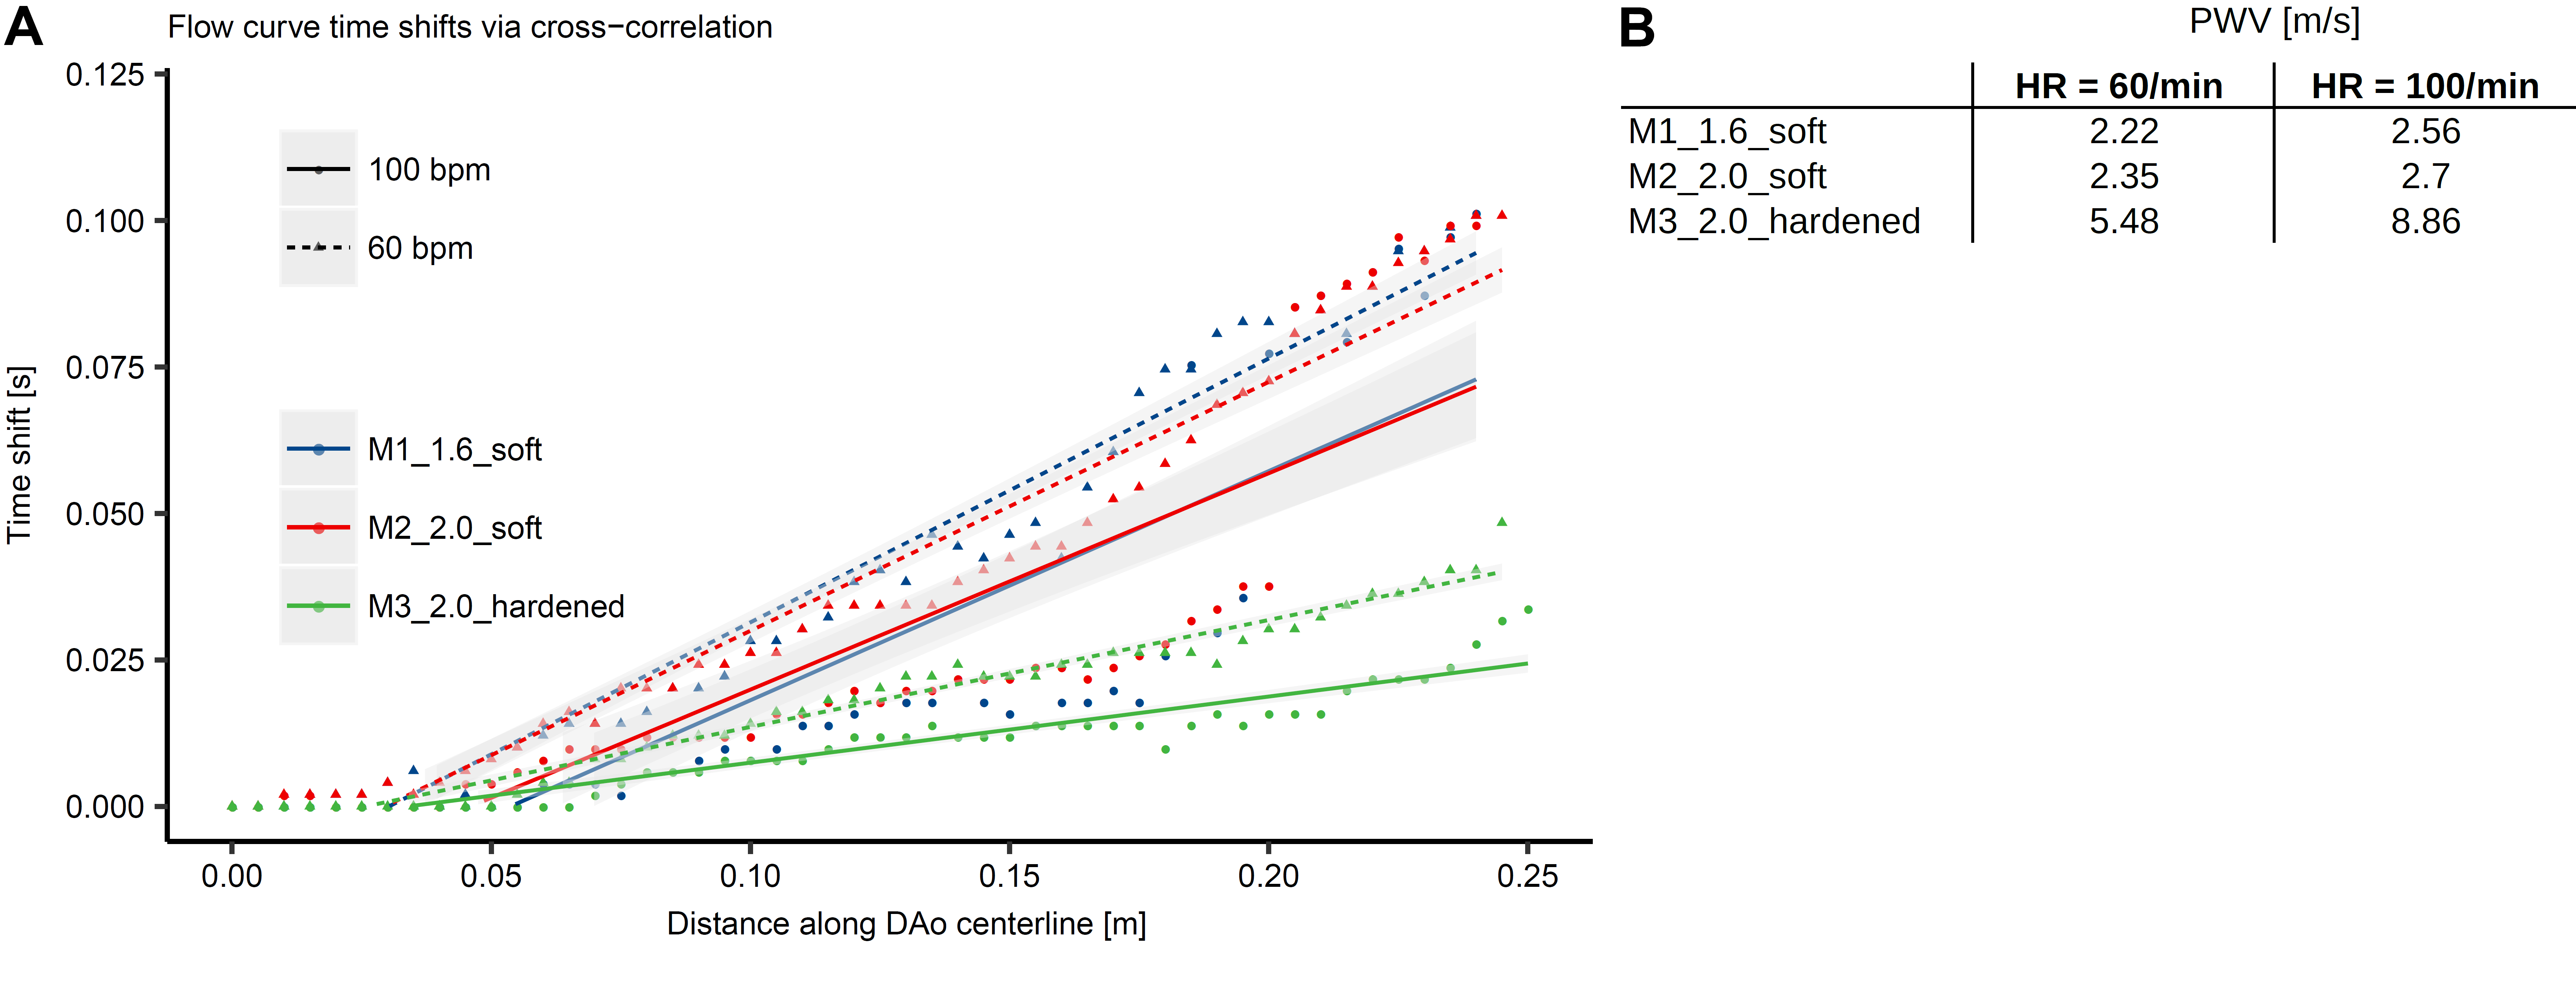
- computation of temporal shifts for each flow curve via cross-correlation (travelling-time-for-fixed-distance approach);
- PWV was defined as the slope of the fitted linear regression line.
Results
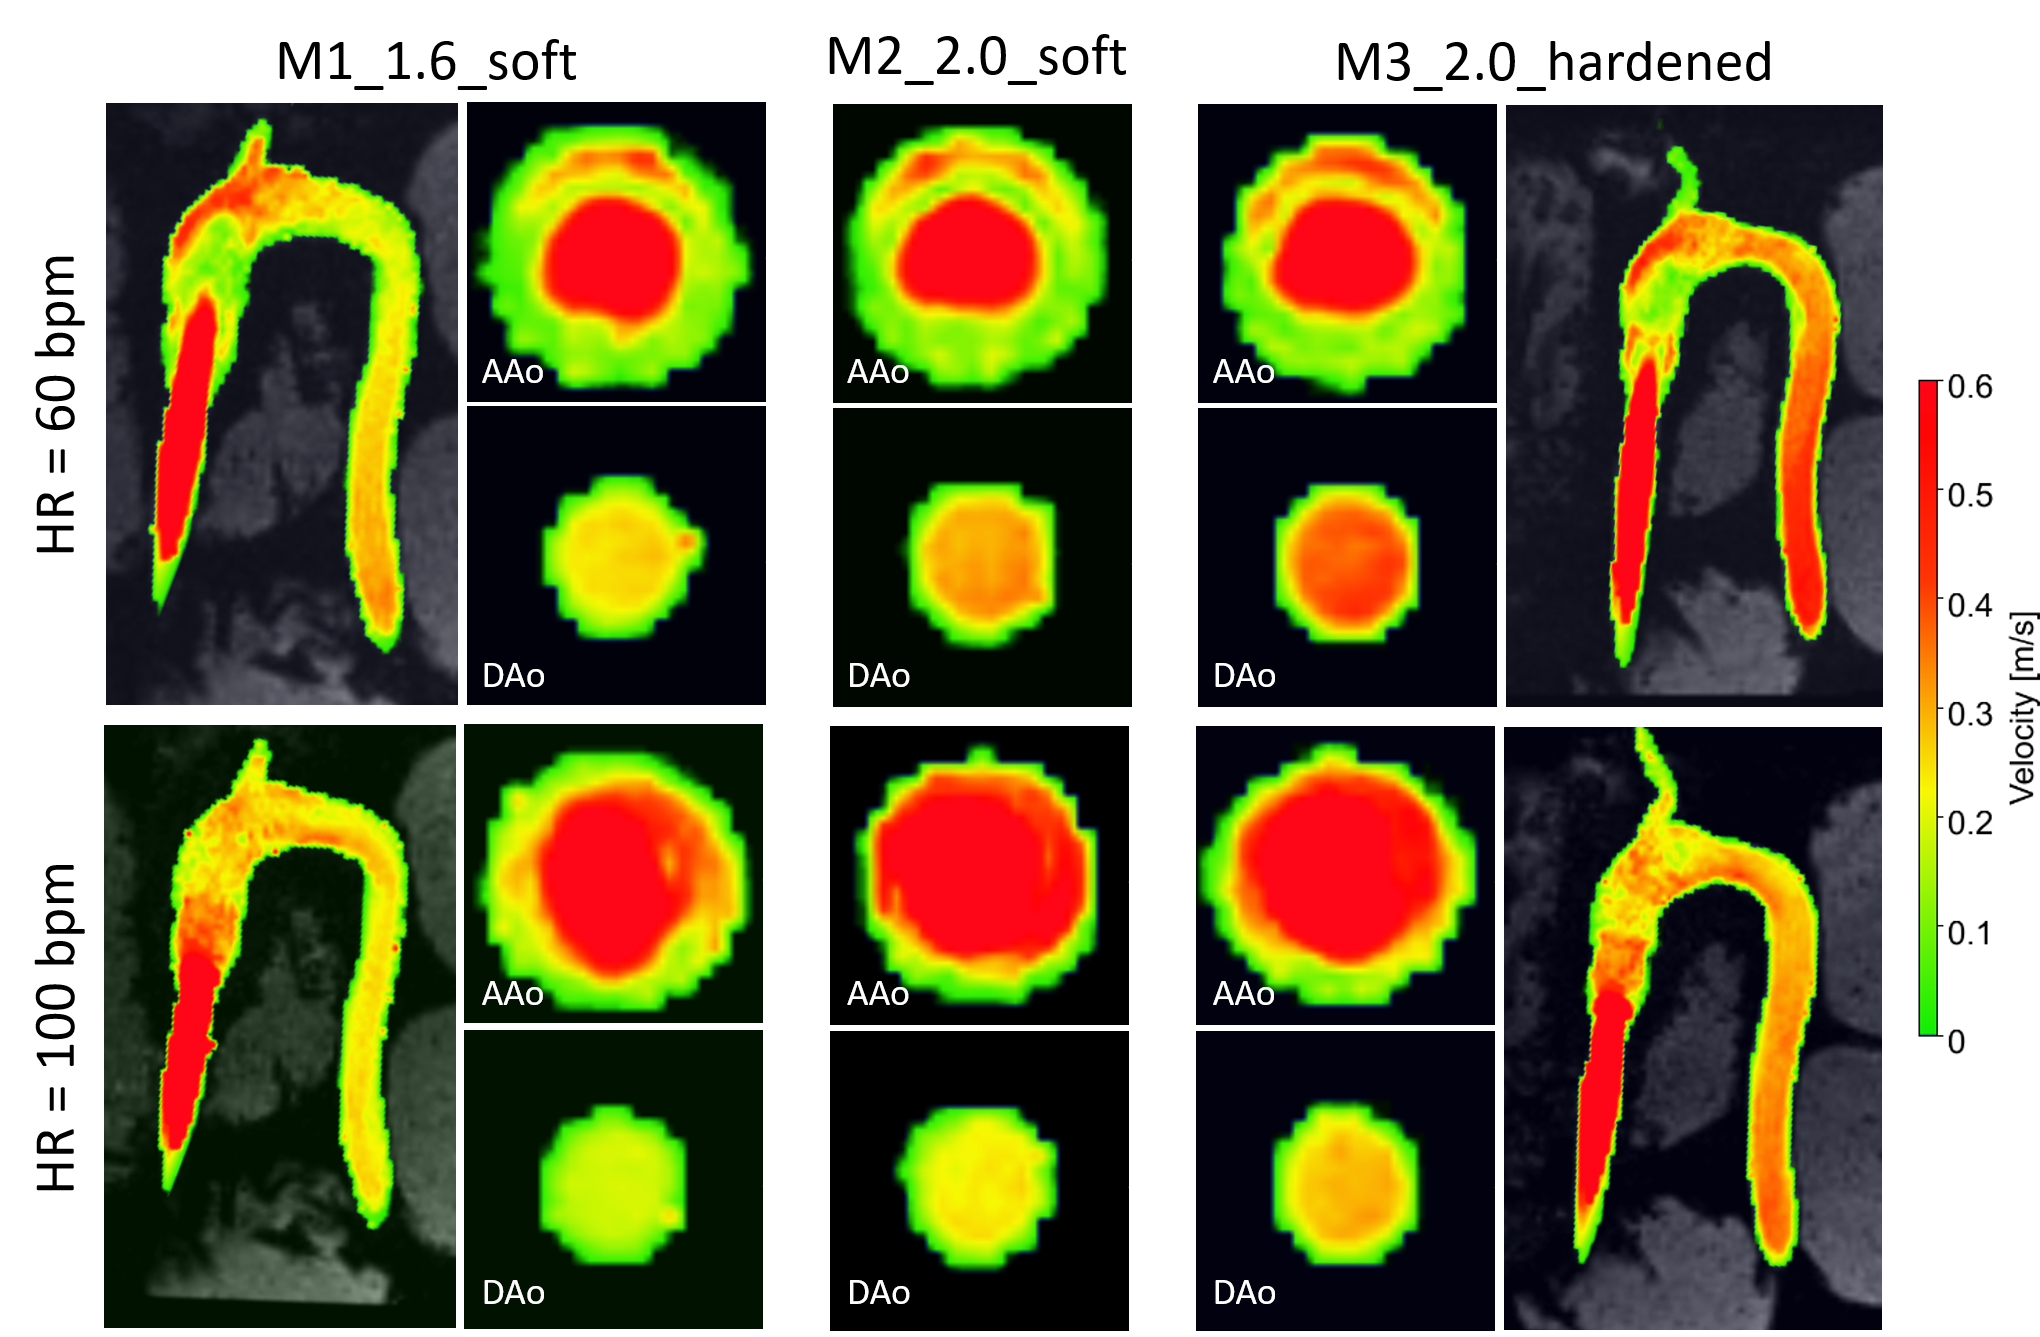
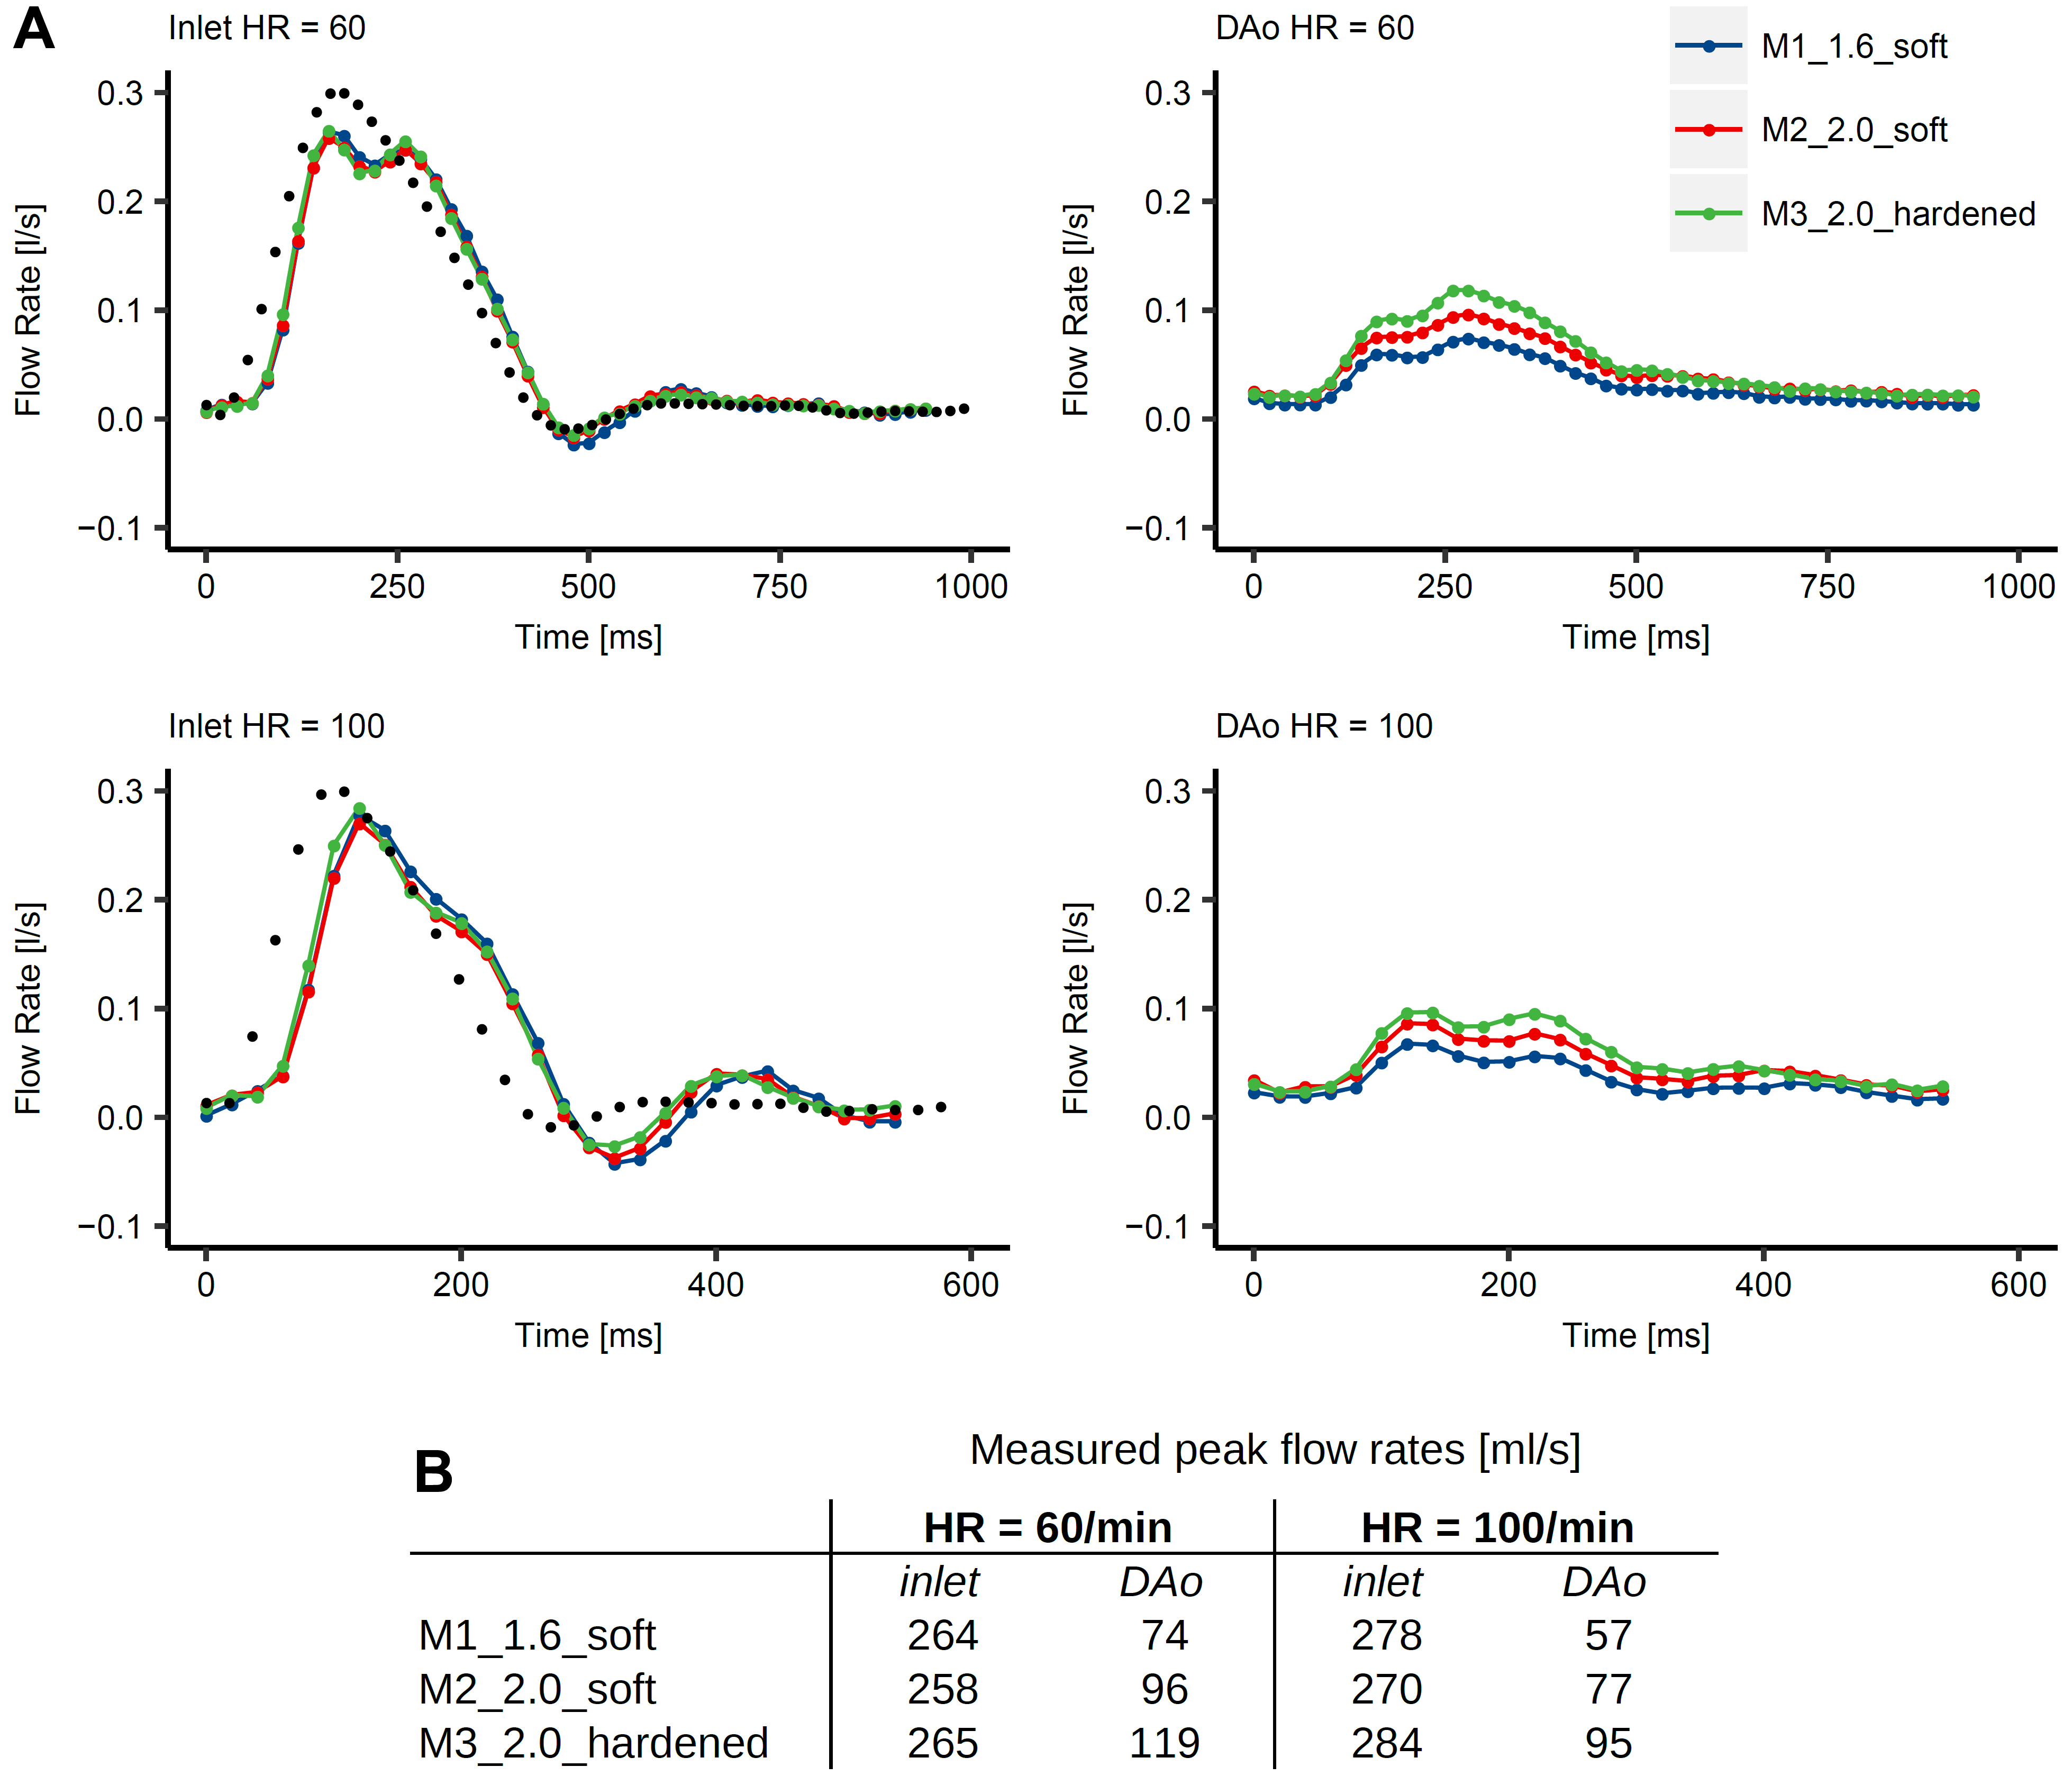
Absolute velocity maps qualitatively demonstrated the impact of varying wall characteristics. Compliant wall recoiling effect was present in all models and overall higher velocities were measured in the hardened model (Fig. 3). Measured inlet flow curves were consistent with the programmed flow curve (though dampened) and in good agreement between all models (Fig. 4A). For all models, peak flow rate was dampened through the inflow tubing (firm, length=3m) from 300ml/s (programmed) to 258-265 ml/s (HR=60) and 278-284 ml/s (HR=100) at the inlet landmark (Fig. 4B). Measured peak flow rate through the models was further dampened at the DAo landmark, with the strongest dampening effect in the most compliant model. PWV (Fig. 5) was lowest in M1_1.6_soft (2.22/2.56 m/s for HR=60/100) and increased by a factor of 2.5 (HR=60) and 3.5 (HR=100) for the hardened model.Discussion
Embedding compliant aorta models into the described experimental setup is technically feasible and allows acquiring high-quality 4D-flow MRI data. Measured PWV numbers are within a plausible range when compared to prior in vivo studies.5 Results suggest that waveform dampening and PWV in the 3D-printed thoracic aorta model are influenced by both vessel wall thickness and stiffness. Therefore, choosing a model that best resembles in vivo aortic wall characteristics is important, since it directly impacts both flow dynamics and flow quantitation. In addition, changes in HR influence the quantitation of flow dynamics. Therefore, HR variations need to be considered for large-scale clinical studies, especially of PWV. The presented experimental setup is also valuable for assessing 4D-flow MRI sampling requirements, generating high-quality ground truth data for CFD/FSI validation, and for studying flow dynamics in different vascular pathologies under controlled conditions (e.g. atherosclerosis, dissections, aneurysms). This work is limited by not incorporating pressure measurements to tune the setup toward optimal boundary conditions, which will be approached next.Conclusion
This work demonstrates the feasibility of in vitro flow measurements in subject-specific and compliant 3D-printed aorta models and emphasizes the importance of choosing compliant materials of appropriate stiffness and thickness for quantitative 4D-flow studies.Acknowledgements
We thank Frandics Chan and Dominik Fleischmann for providing the volunteer dataset, Kyle Gifford for manufacturing the models, and Tabitha Bandy-Vizcaino for technical support with the experimental setup. JZ receives financial support from DAAD Germany. This project was supported, in part, by NIH R01 HL131975 to DBE.References
1. Kolipaka A, Illapani VSP, Kenyhercz W, et al. Quantification of abdominal aortic aneurysm stiffness using magnetic resonance elastography and its comparison to aneurysm diameter. J Vasc Surg 2016;64:966-974.
2. Woodrum DA, Herrmann J, Lerman A, Romano AJ, Lerman LO, Ehman RL. Phase-contrast MRI-based elastography technique detects early hypertensive changes in Ex vivo porcine aortic wall. J Magn Reson Imaging 2009;29:583-587.
3. Jarvis KB, Vali A, Syed AA, et al. Longitudinal Study of Aortic Stiffness and Flow Reversal in Patients with Cryptogenic Stroke. In: ISMRM Annual Meeting. ; 2019:P450.
4. Damughatla AR, Raterman B, Sharkey-Toppen T, et al. Quantification of aortic stiffness using MR Elastography and its comparison to MRI-based pulse wave velocity. J Magn Reson Imaging 2015;41:44-51.
5. Markl M, Wallis W, Strecker C, Gladstone BP, Vach W, Harloff A. Analysis of pulse wave velocity in the thoracic aorta by flow-sensitive four-dimensional MRI: Reproducibility and correlation with characteristics in patients with aortic atherosclerosis. J Magn Reson Imaging 2012;35:1162-1168.
6. Jenkinson M. Fast, automated, N-dimensional phase-unwrapping algorithm. Magn Reson Med 2003;49:193-197.
7. Selle D, Preim B, Schenk A, Peitgen H-O. Analysis of vasculature for liver surgical planning. IEEE Trans Med Imaging 2002;21:1344-1357.
Figures