2278
A novel, accurate and robust three-dimensional quantification of circulation using finite-element methods in 4D Flow MRI data of thoracic aorta1Biomedical Imaging Center, Pontificia Universidad Catolica de Chile, Santiago, Chile, 2Department of Electrical Engineering, Pontificia Universidad Catolica de Chile, Santiago, Chile, 3Millennium Nucleus for Cardiovascular Magnetic Resonance, Santiago, Chile, 4Department of Biomedical Imaging Science, Leeds Institute to Cardiovascular and Metabolic Medicine, University of Leeds, Leeds, United Kingdom, 5Department of Mechanical Engineering, Universidad Técnica Federico Santa María, Santiago, Chile, 6Department of Radiology, Pontificia Universidad Catolica de Chile, Santiago, Chile, 7Institute for Biological and Medical Engineering, Schools of Engineering, Medicine and Biological Sciences, Pontificia Universidad Catolica de Chile, Santiago, Chile
Synopsis
The circulation is normally analyzed in a 2D cross-section of the aorta, manually placed. To avoid this problem, evaluate and validate a new methodology based on Finite Elements (FE) to calculate the circulation in three-dimensions, in in-silico models, and in the ascending aorta of a group of volunteers and patients. In in-silico experiment we obtain an RMSE of the circulation values less than 1.6e-6. We also found that significant differences exist between volunteers and patients with a p-value of 0.0283. Our method is straight forward to calculate, accurate and robust throughout different resolutions and noise levels.
INTRODUCTION:
Prognostic models based on cardiovascular hemodynamic parameters can add new information for an assessment of different cardiovascular diseases. This evidence may play a key role in longitudinal monitoring and reduction of long-term risk of cardiovascular events. Rotational and helical flow in the aorta has been found to be a potentially important imaging biomarker in many cardiac diseases such as bicuspid aortic valve disease. The circulation is a metric used in fluid dynamics to quantify the rotational components of flow and is normally analyzed in a 2D cross-section of the aorta1,2. But it is well known that the generation of this cross-section is highly operator dependent, only gives local information, the 3D information is omitted and is time-consuming. The purpose of this work is the evaluation and validation of a new methodology based on Finite Elements (FE) to calculate the circulation in three-dimensions, in in-silico models, and in the ascending aorta of a group of volunteers and patients and to investigate if it can be used as a robust metric.METHODS:
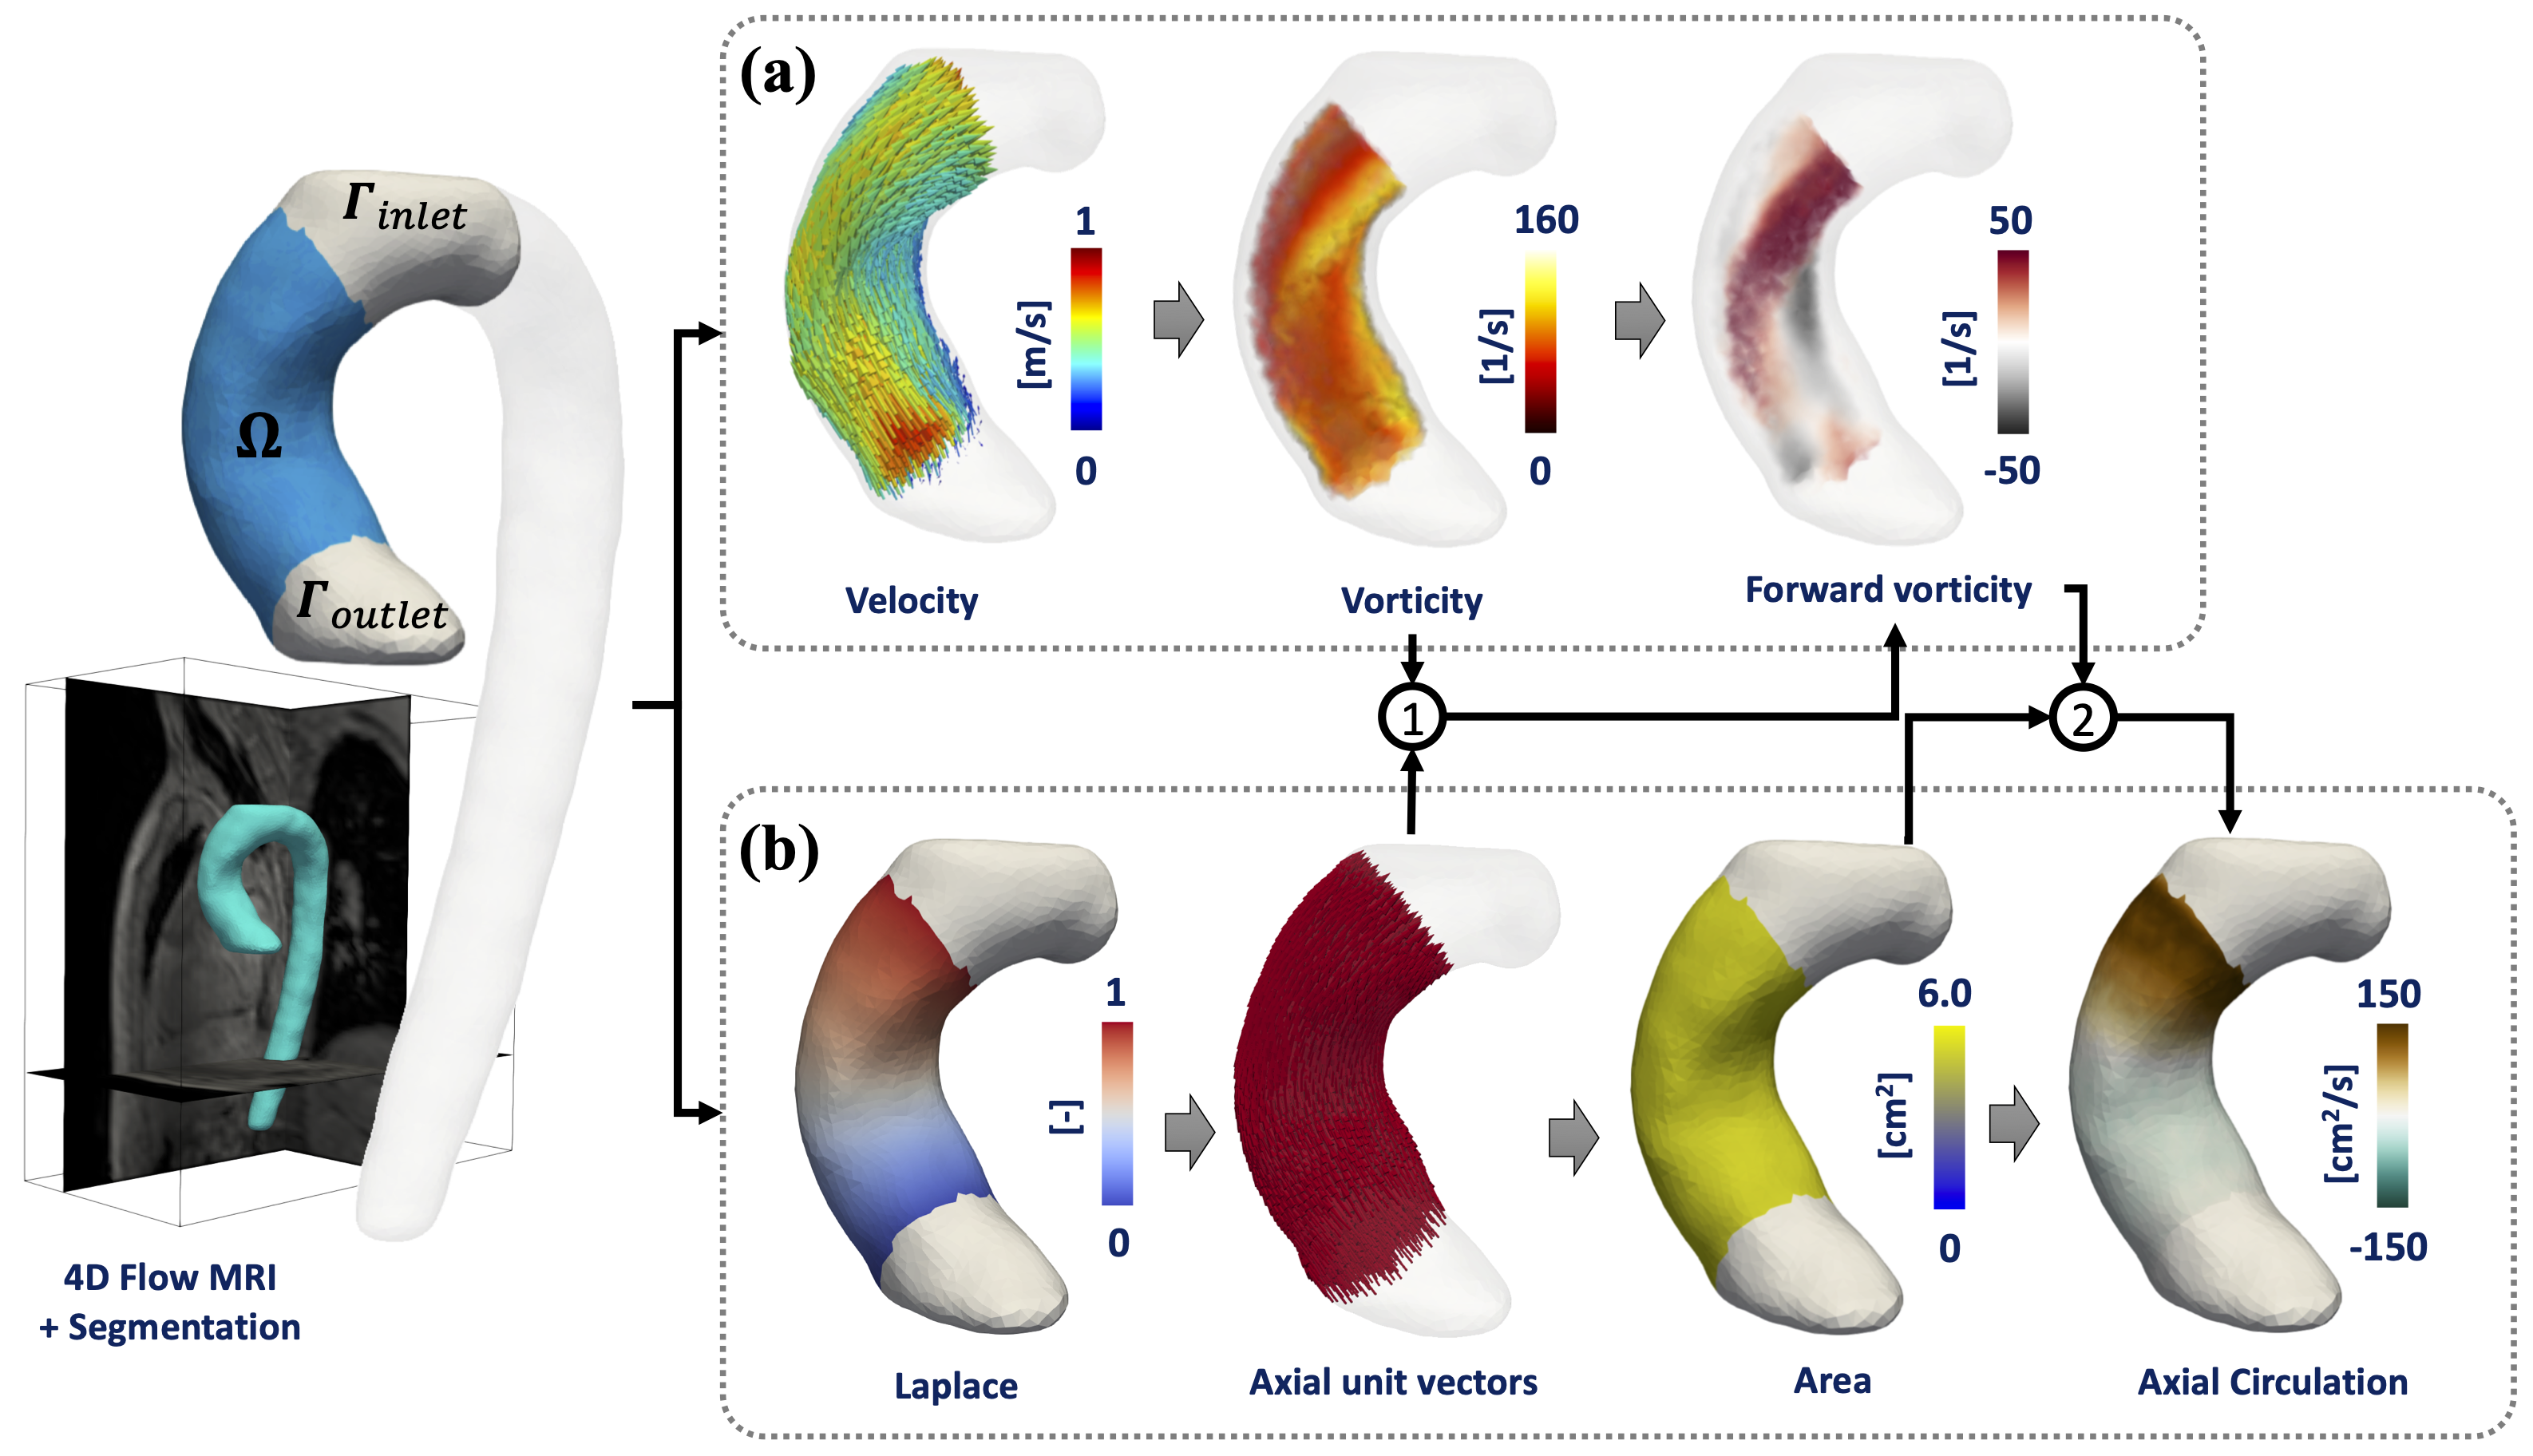
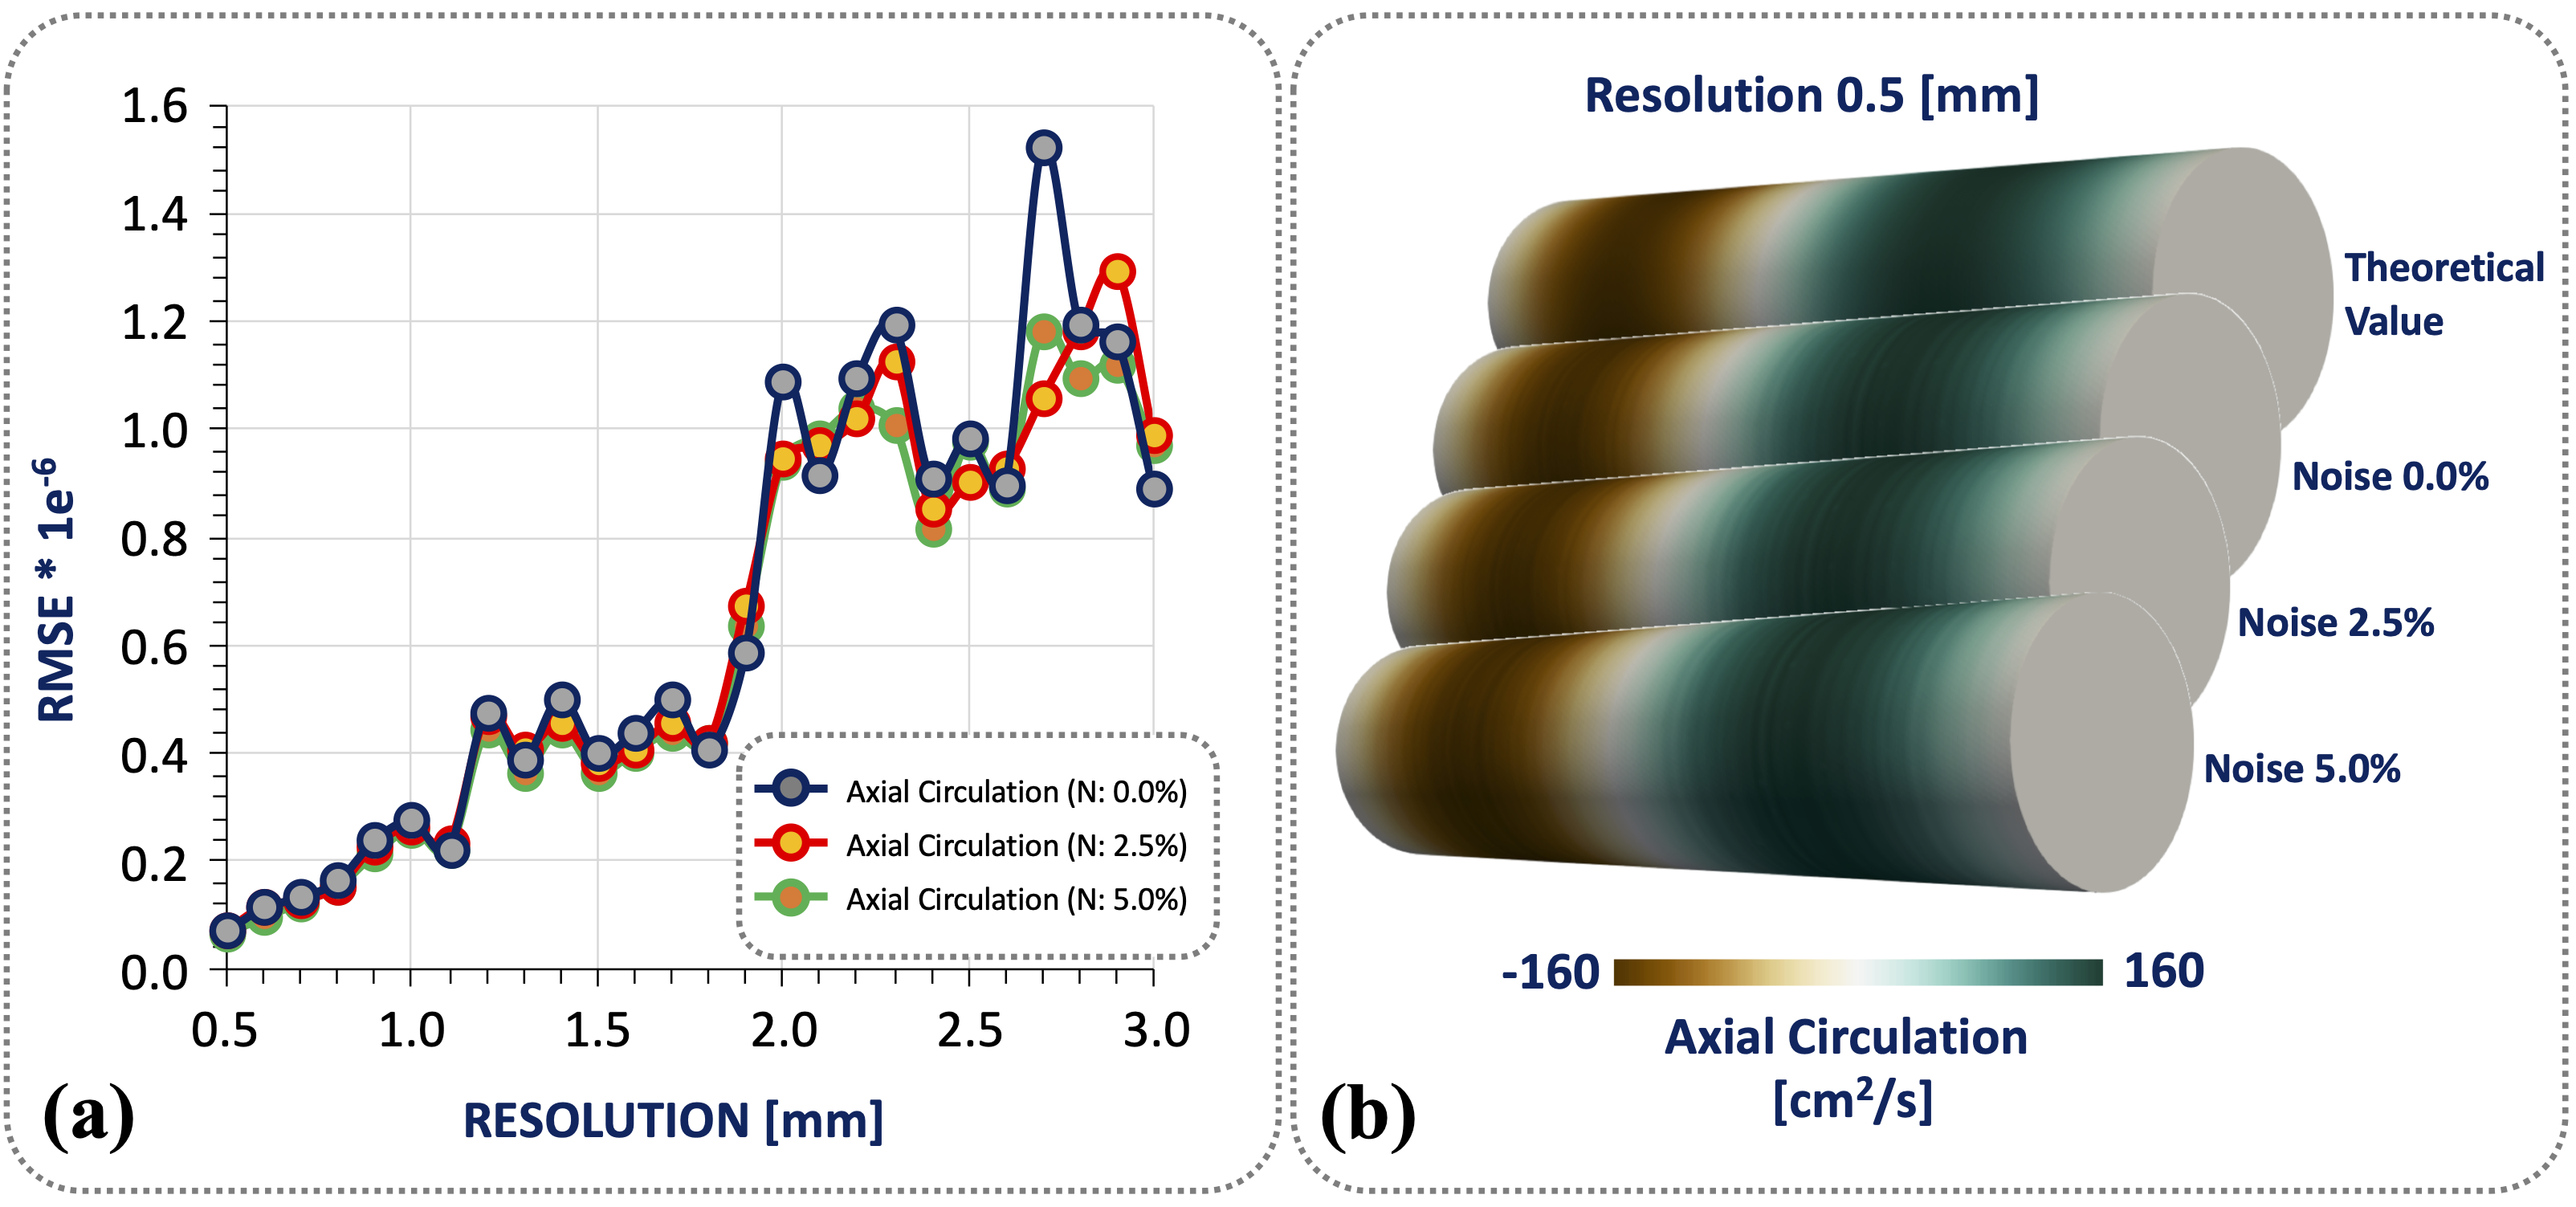
Theoretically, the circulation (Γ) is calculated as the integral of vorticity (ω) with respect to the area within a transverse plane through the aorta Stokes' theorem. To avoid the different problems of the actual 2D metrics, we apply a global least-squares stress projection method3,4 to calculate the vorticity from 4D flow MRI data, and FE formulation5 to calculate the area and axial unit vectors (α) of the geometry. The forward vorticity is calculated as the dot product between axial unit vectors and the vorticity vectors (ωf = ω·α). Finally, the circulation is calculated as the spatial integral of the forward vorticity in each level set generated by Laplace solution (Fig.1). To validate our method, we created an in-silico 3D cylindrical phantoms, using a combination of the Poiseuille flow equation and modified expression of the Lamb-Oseen equation3, for different mesh resolutions and noise levels (Fig.2). Finally, we evaluated the application of our methodology in 4D Flow MRI data of ascending aorta of six healthy volunteers (5 males, mean age 30.1 (range 26 - 38) years old, and six BAV patients (4 males, mean age 25.5 (range 14-45) years old) three with right and three with left-handed flow, at peak systole. The volunteer data were acquired in a 3T Philips MR scanner (Achieva, Philips Healthcare, Best The Netherlands) and the patient data using a clinical 3T Trio SIEMENS MR scanner (Healthcare, Erlangen, Germany). To compare the results, we performed a Mann-Whitney U-test between volunteers and patients (right and left-handed flow). The statistical analysis was performed using SPSS Statistics (version 25.0 IBM SPSS, Chicago, IL). The quantification of circulation was performed in MATLAB (MathWorks, Natick, MA, USA), and for visualization purposes, we use Paraview (KitwareInc., Clifton Park, New York, USA).RESULTS:
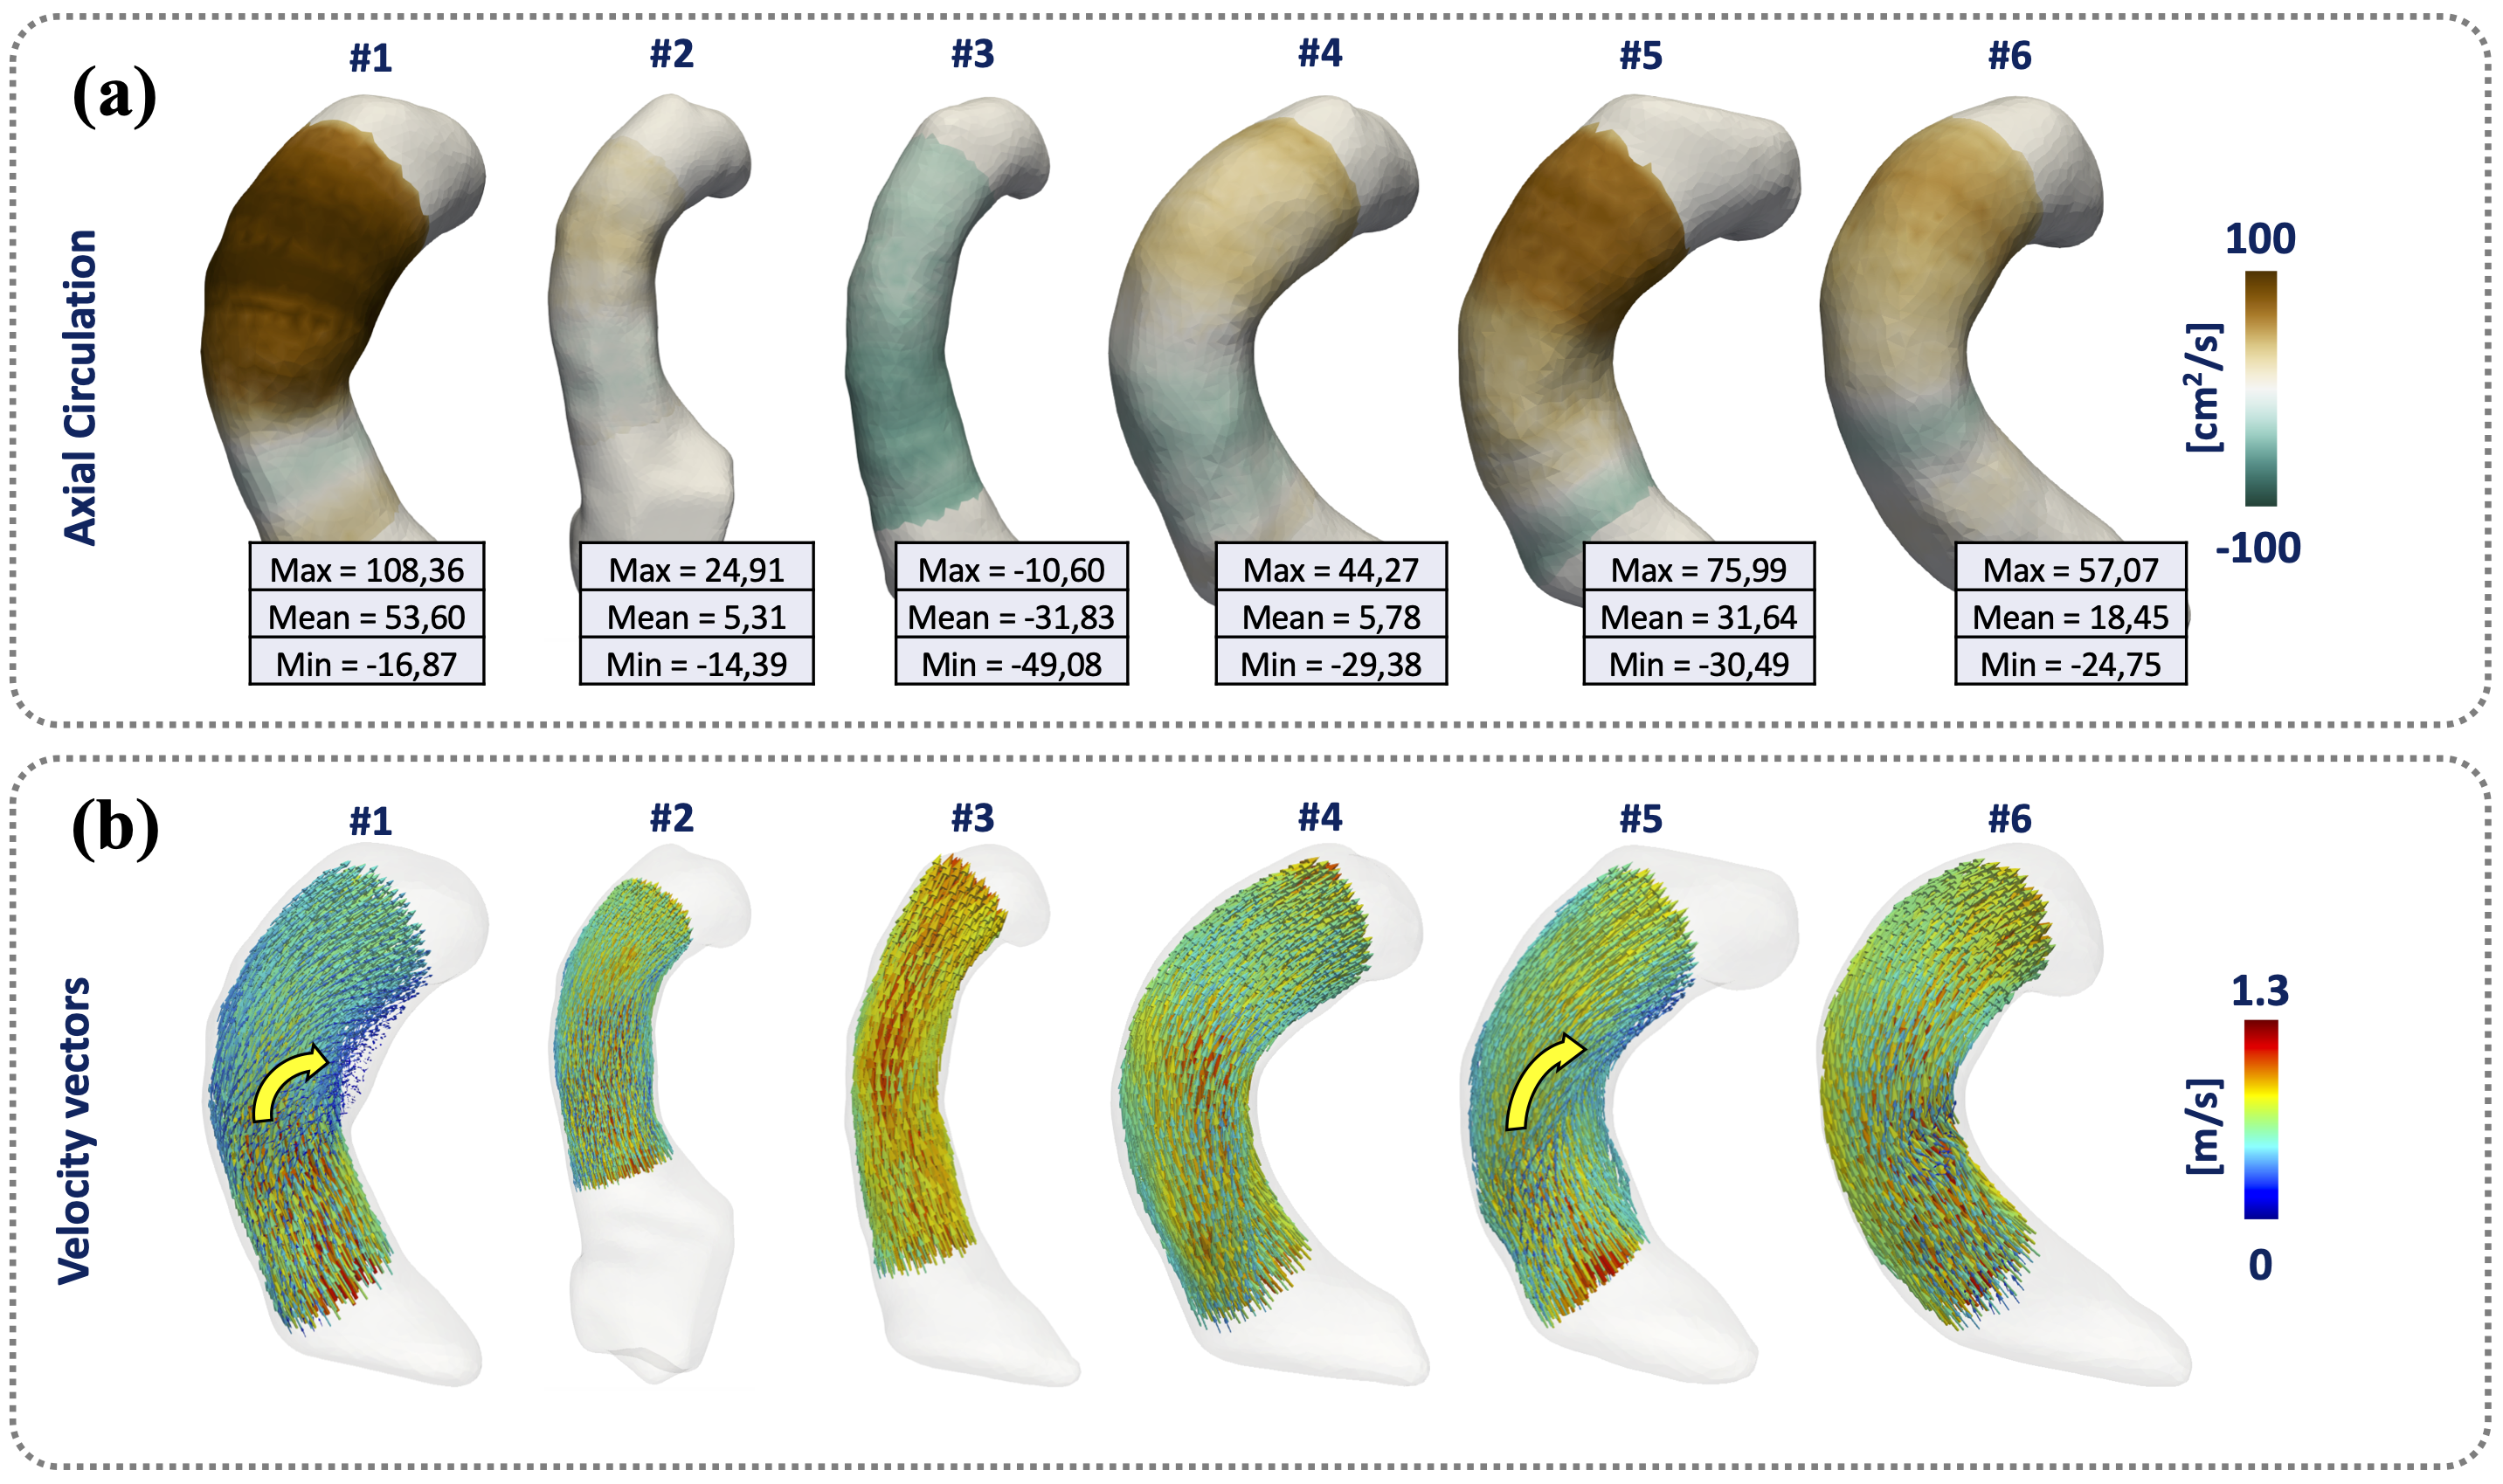
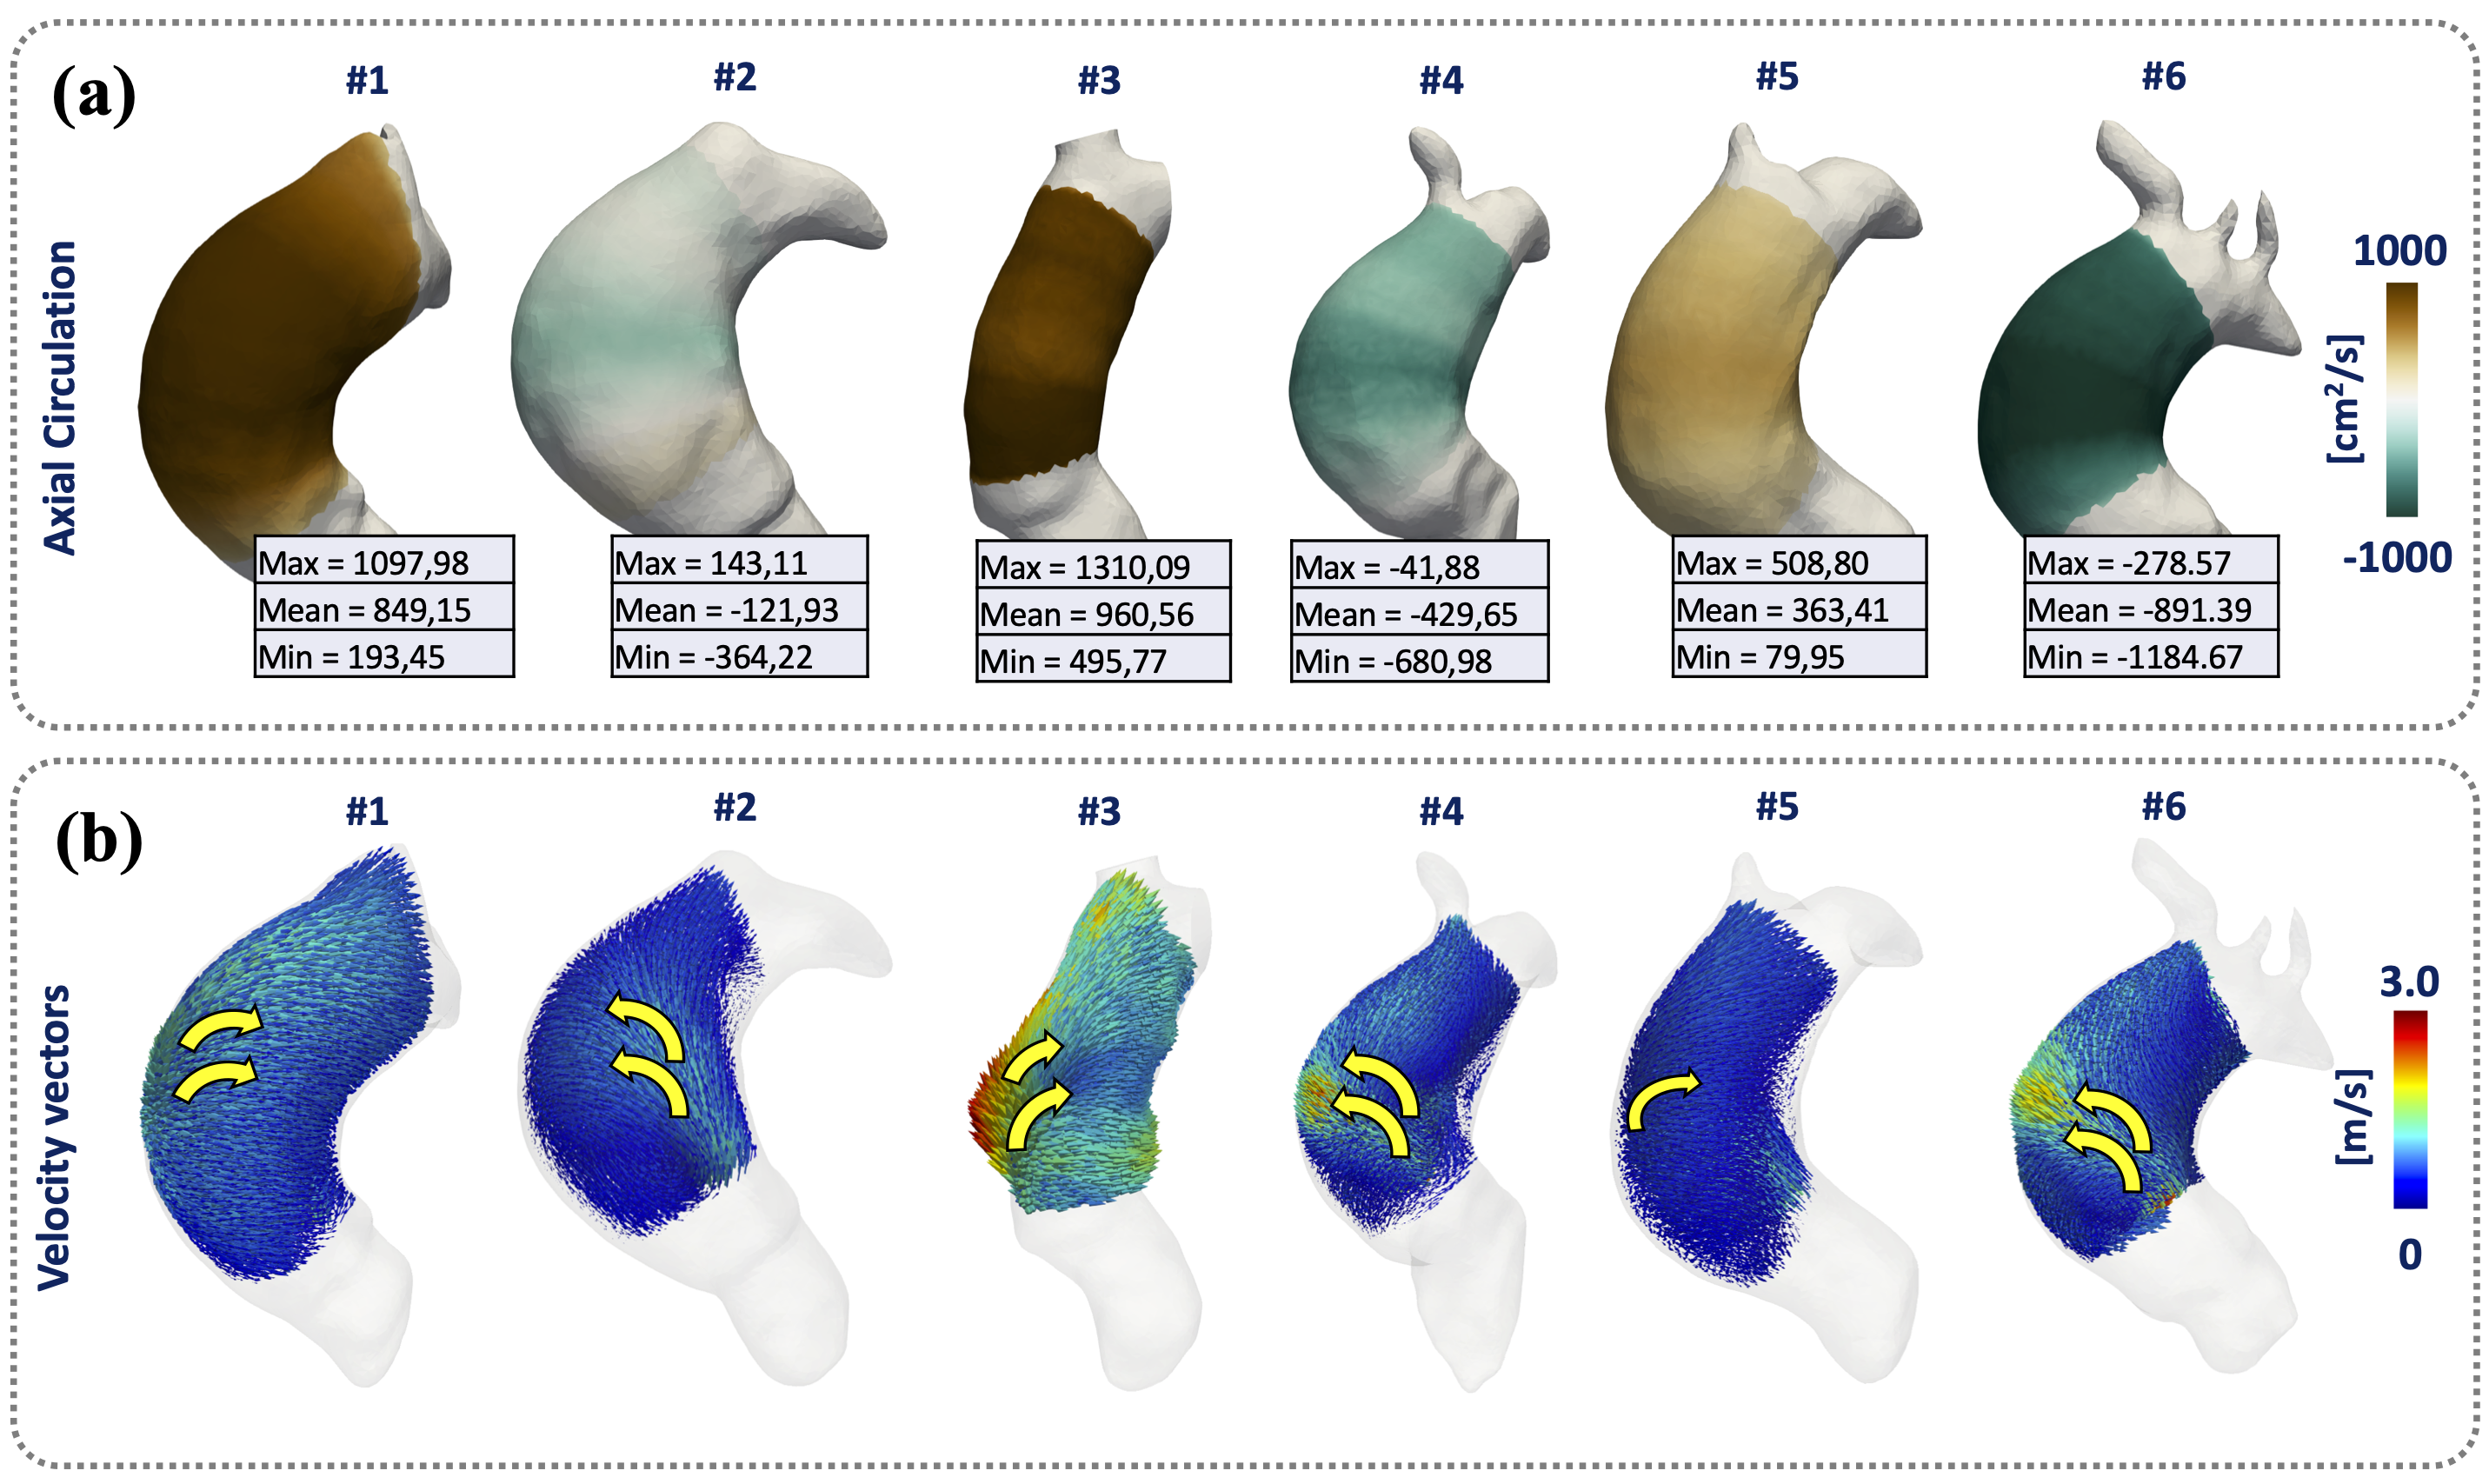
In in-silico experiment Fig.3, we obtain an RMSE of the circulation values less than 1.6e-6 between the theoretical values and our results, we demonstrate the robustness and convergence of our method throughout different resolutions and noise levels. Comparing the circulation mean ± SD of volunteer 13.83±28.78 cm2/s (Fig.4), patients right-handed 724.37±317.53 cm2/s and patients with left-handed -480.99±387.29 cm2/s (Fig.5), we found that exists significant differences between both groups with a p-value of 0.0283, between right-handed and volunteer, and also for left-handed and volunteer groups. The group of patients shown a huge dispersion of circulation [cm2/s] data, interquartile range [Q1 | Q3] of axial circulation for the group of volunteers [-4.0 | 37.1] cm2/s and patients right-handed [363.4 | 960.6] cm2/s and patients with left-handed [-891.4 | 121.9] cm2/s.CONCLUSION:
Three-dimensional circulation (Γ) based on finite element, is straight forward to calculate, accurate and robust throughout different resolutions and noise levels. Allowing us the quantification of the entire three-dimensional rotational flow characteristic in the ascending aorta. The interquartile range of values calculated in volunteer data is found to be narrow compared to those seen in patients (p-value of 0.0283) and the measure correctly differentiated between the visually seen right and left-handed helical flow, which suggests that this approach may have high clinical sensitivity.Acknowledgements
This publication has received funding from Millenium Science Initiative of the Ministry of Economy, Development and Tourism, grant Nucleus for Cardiovascular Magnetic Resonance. Also, has been supported by CONICYT - PIA - Anillo ACT1416, CONICYT FONDEF/I Concurso IDeA en dos etapas ID15|10284, and FONDECYT # 1181057. Sotelo J. thanks to FONDECYT Postdoctorado 2017 #3170737.References
1. Hess AT, Bissell MM, Glaze SJ, et al. Evaluation of circulation, Γ, as a quantifying metric in 4D flow MRI. J Cardiovasc Magn Reson. 2013;15(Suppl 1):E36.
2. Rodríguez-Palomares JF, Dux-Santoy L, Guala A, et al. Aortic flow patterns and wall shear stress maps by 4D-flow cardiovascular magnetic resonance in the assessment of aortic dilatation in bicuspid aortic valve disease. J Cardiovasc Magn Reson. 2018 Apr 26;20(1):28.
3. Sotelo J, Urbina J, Valverde I, et al. Three-dimensional quantification of vorticity and helicity from 3D cine PC-MRI using finite-element interpolations. Magn Reson Med. 2018 Jan;79(1):541-553.
4. Sotelo J, Urbina J, Valverde I, et al. 3D Quantification of Wall Shear Stress and Oscillatory Shear Index Using a Finite-Element Method in 3D CINE PC-MRI Data of the Thoracic Aorta. IEEE Trans Med Imaging. 2016 Jun;35(6):1475-87
5. Sotelo J, Dux-Santoy L, Guala A, et al. 3D axial and circumferential wall shear stress from 4D flow MRI data using a finite element method and a laplacian approach. Magn Reson Med. 2018 May;79(5):2816-2823.
Figures