2272
In-vitro and in-vivo validation of a pediatric whole heart 4D flow acquisition in 4 minutes with compressed sensing1Department of Radiology, Section of Pediatric Radiology, Children's Hospital Colorado, University of Colorado Anschutz Medical Campus, Aurora, CO, United States, 2Philips Healthcare NA, San Francisco, CA, United States, 3Department of Pediatrics, Section of Pediatric Cardiology, Children's Hospital Colorado, University of Colorado Anschutz Medical Campus, Aurora, CO, United States, 4Department of Bioengineering, University of Colorado Anschutz Medical Campus, Aurora, CO, United States
Synopsis
We investigate the feasibility of the accelerating 4D flow with compressed sensing and online reconstruction in pediatric patients. In-vitro models and imaging in pediatric patients was performed and hemodynamic quantification was compared to conventional approaches. The results demonstrated flow metrics and clinically relevant indices measured by 6-fold accelerated CS were in good agreement with those measured by conventional acceleration techniques, with scan time savings of 30.2%. This suggests the feasibility of using CS 4D flow for pediatric patients in the clinical setting.
Introduction
4D flow MRI is a promising tool for assessing complex hemodynamics in pediatric patients with congenital heart disease. However, large fields of view (FOV) are often required to cover all heart chambers and proximal vessels, causing long scan times that are difficult for young patients under sedation. As a result, clinical translation of 4D flow MRI in pediatric imaging has been limited. Recent compressed sensing (CS) studies in adult volunteers and patients have shown promising results with scan time reductions that maintain hemodynamic accuracy. The studies, which have used an ‘aorta’ FOV and CS acceleration rates of 6-8, found good accuracy compared to fully sampled data, with slightly lower peak velocities1,2. However, the feasibility of CS-accelerated pediatric ‘whole heart’ 4D flow MRI is still unclear and translation is challenged by a lack of online reconstruction. Thus, this study investigates the feasibility of using CS 4D flow with online reconstruction to quantify hemodynamics in in-vitro models and a cohort of pediatric congenital heart disease patients. In addition to traditional flow measurements, we investigate the accuracy of CS 4D flow to obtain disease specific measurements, such as cardiovascular shunting (Qp:Qs), regurgitant fraction (RF) in tetralogy of Fallot (TOF) patients, and maximum velocity in coarctation patients.Methods
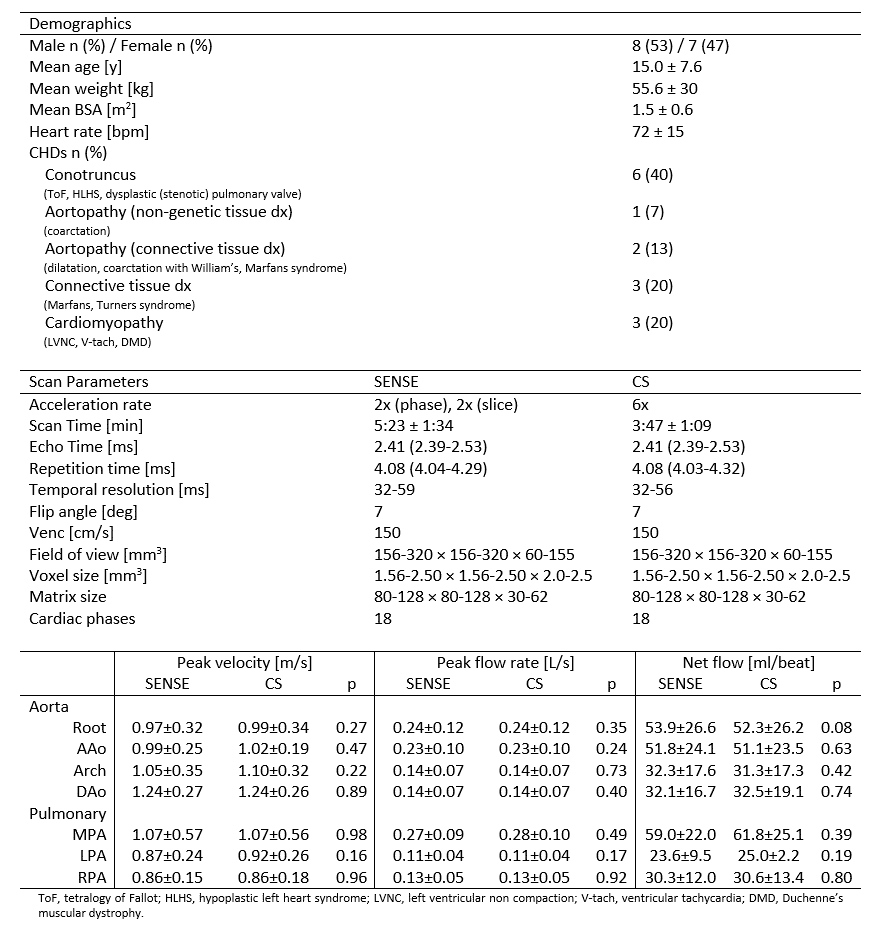
All 4D flow scans were obtained on a Philips Ingenia or Elition 3T MRI using vendor supplied 16 channel posterior coils and 16 channel anterior coils. In-vitro models were scanned with no acceleration (i.e. fully-sampled), parallel imaging (SENSE), and a vendor optimized parallel imaging and CS approach (Compressed SENSE, hereafter ‘CS’). To limit scan time, in-vivo scans were conducted with parallel imaging-only followed by the CS approach. Acceleration factors of 4 (SENSE) and 6 (CS) were used for all scans. Post-processing corrected for eddy currents, noise, and velocity aliasing using in-house code (MATLAB). Scan parameters are found in Table 1.In-vitro:
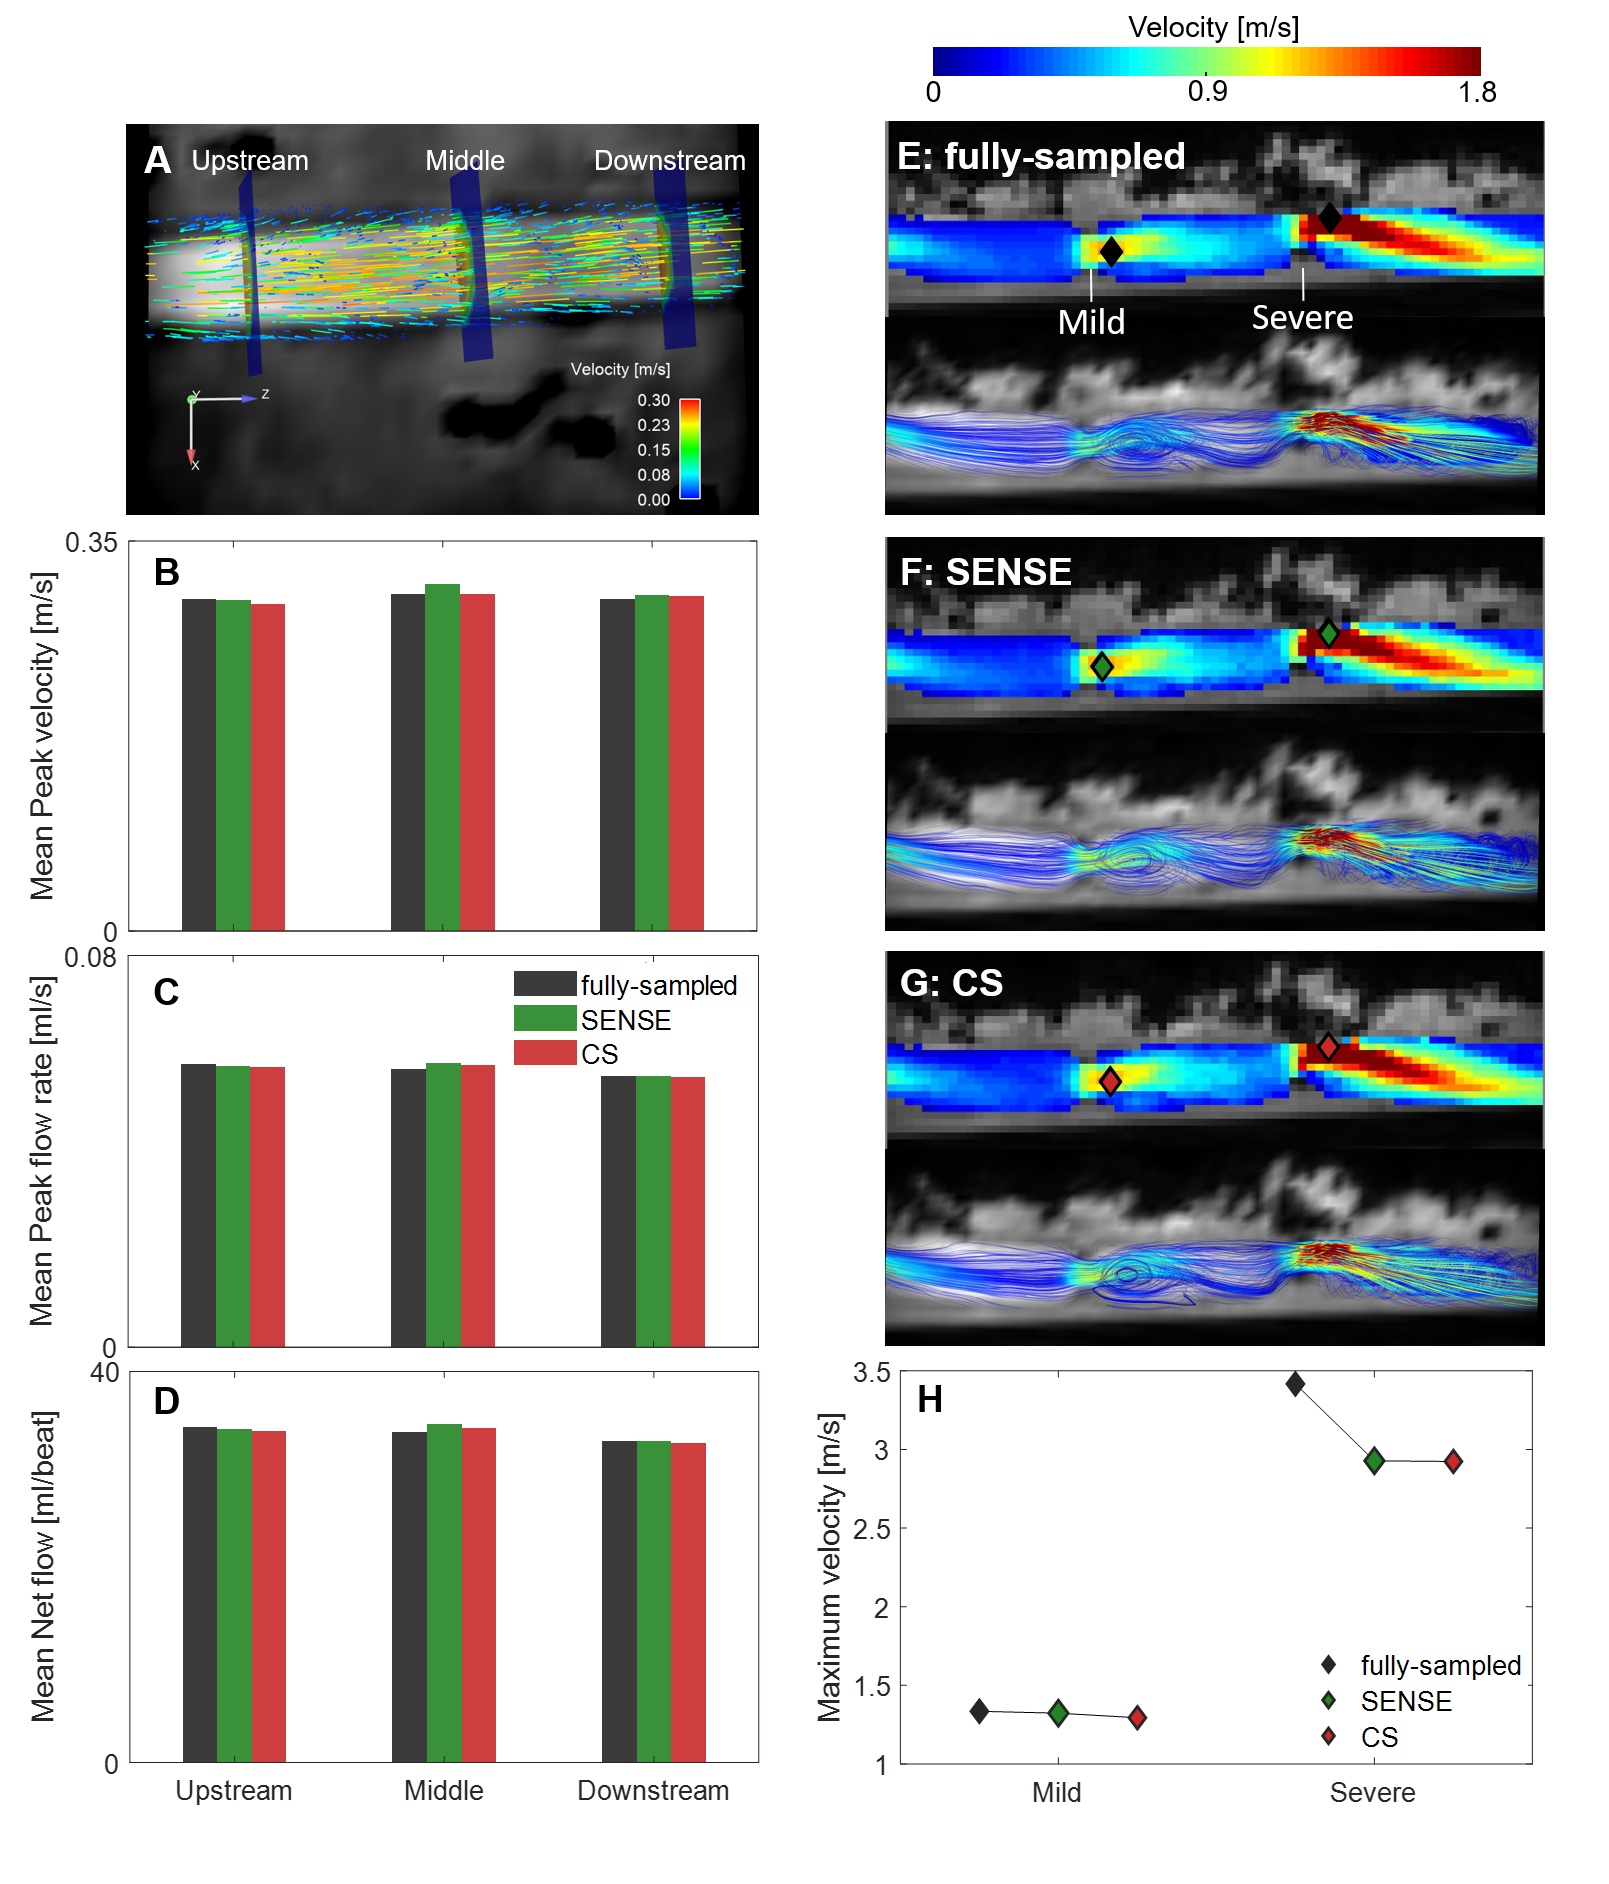
A straight compliant tube (23.3cm in length, 1.7cm in diameter with Young’s modulus of 2MPa) filled with gadolinium-doped water was connected to a pulsatile flow pump set to three stroke volumes (SV) and heart rates (HR): (25ml, 96bpm); (30ml, 80bpm); (45ml, 50bpm). Peak flow rate, peak velocity and net flow were measured at three different locations (EnSight, ANSYS Inc.) (Fig.2A). Two stenoses were subsequently created by constricting the tube to 74% (Mild) and 81% (Severe) and flow was measured at SV=30ml and HR=70bpm. Peak velocities at the stenosis were measured with a maximum intensity projection (MIP) of systolic velocity and flow was qualitatively compared by systolic streamlines.
In-vivo:
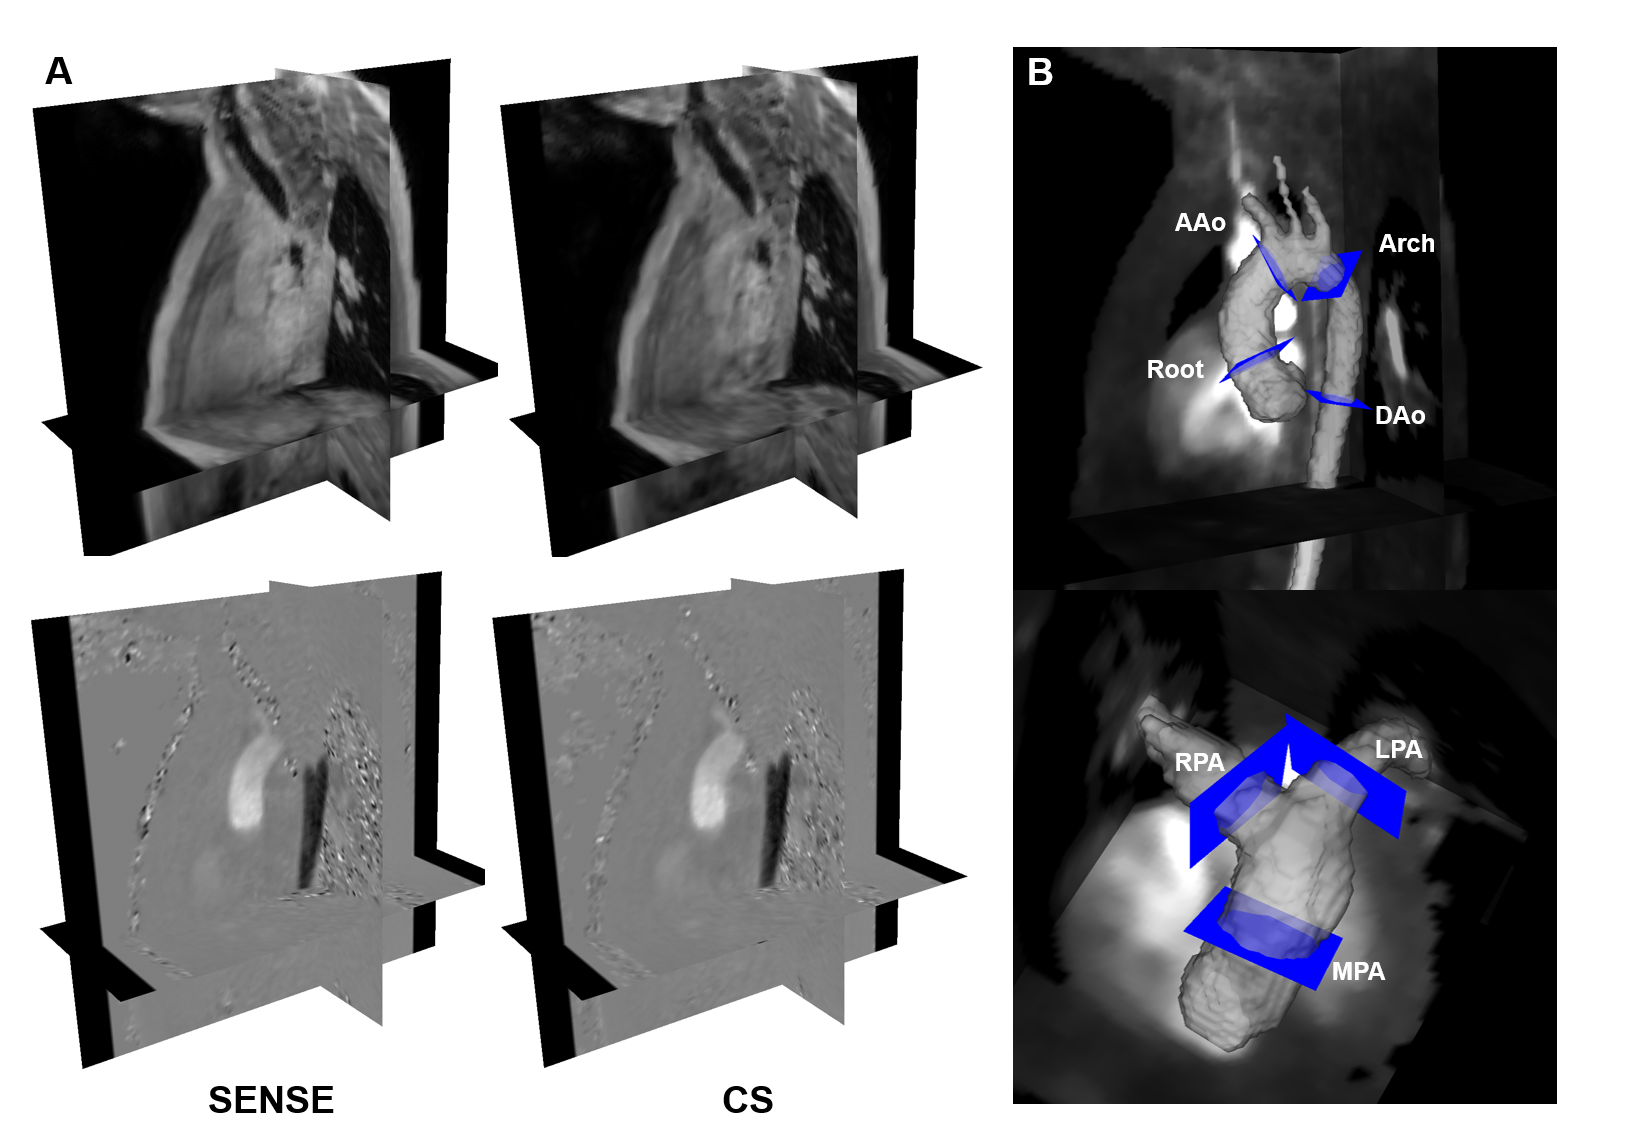
15 pediatric/young adult patients were enrolled for this IRB-approved study (demographics and scan parameters, Table 1; Field of view, Fig. 1A). Flow quantification was performed similar to the in-vitro protocol, with the aorta and pulmonary arteries segmented to extract aortic/pulmonary velocities (3D slicer). Flow at seven anatomic landmarks was measured (Fig. 1B). Qp/Qs, and regurgitant fraction were measured and the maximum coarctation velocity was computed by a systolic velocity MIP (when relevant).
Results
In-vitro:The model without stenosis showed the flow measurements had a maximum difference of 3.0% (fully-sampled vs. SENSE) and 1.5% (fully-sampled vs. CS) (Fig.2B-D). In the stenosis model, peak velocities at the mild stenosis showed a maximum of 3% difference (fully-sampled vs. CS), while lower velocities were measured with SENSE and CS at the severe stenosis (14%, Fig. 2E-H).
In-vivo:
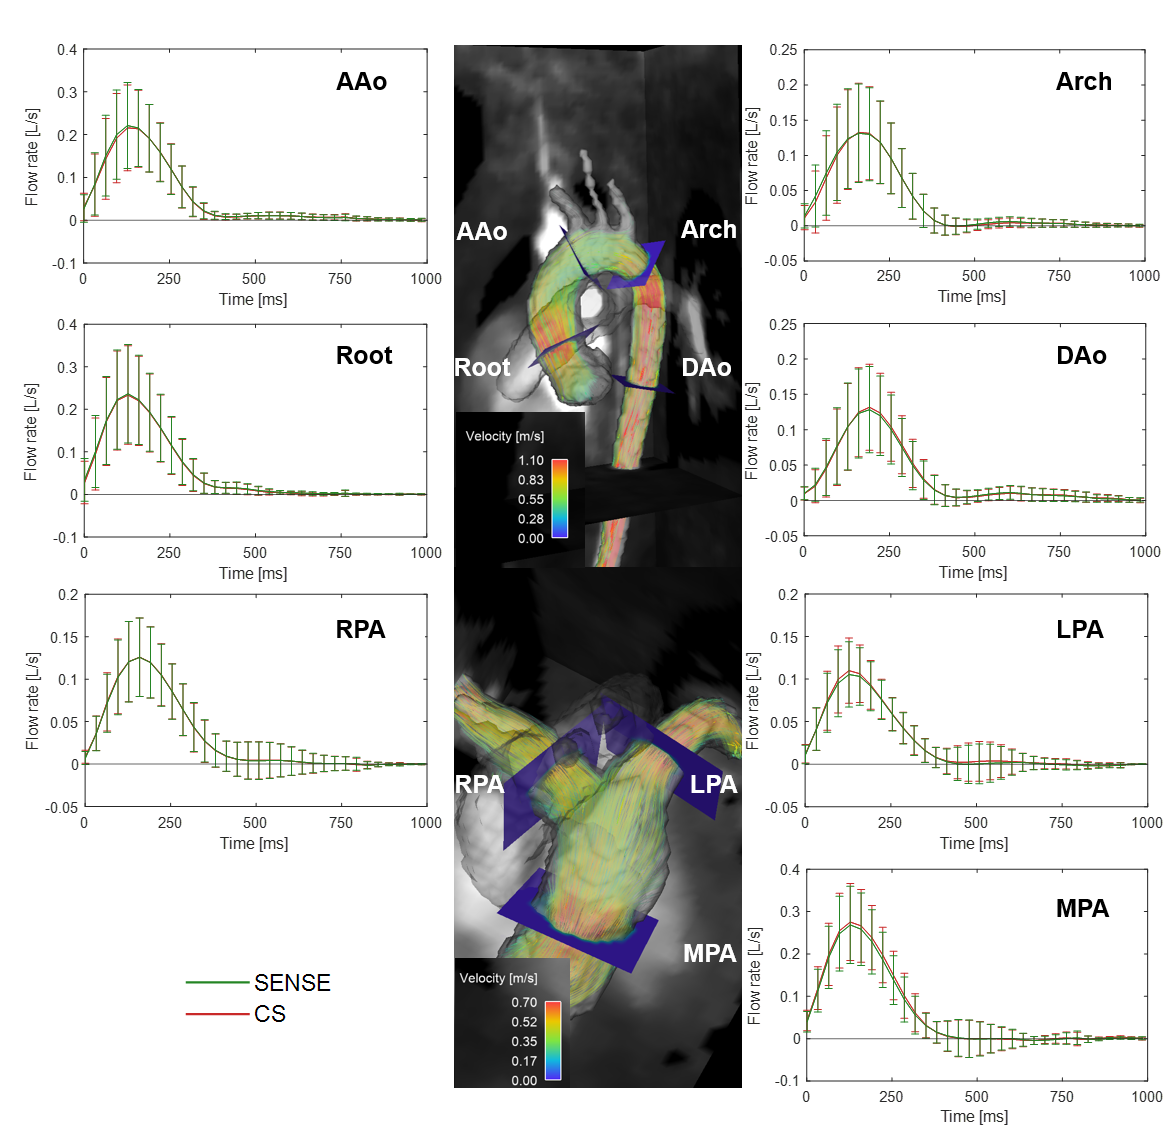
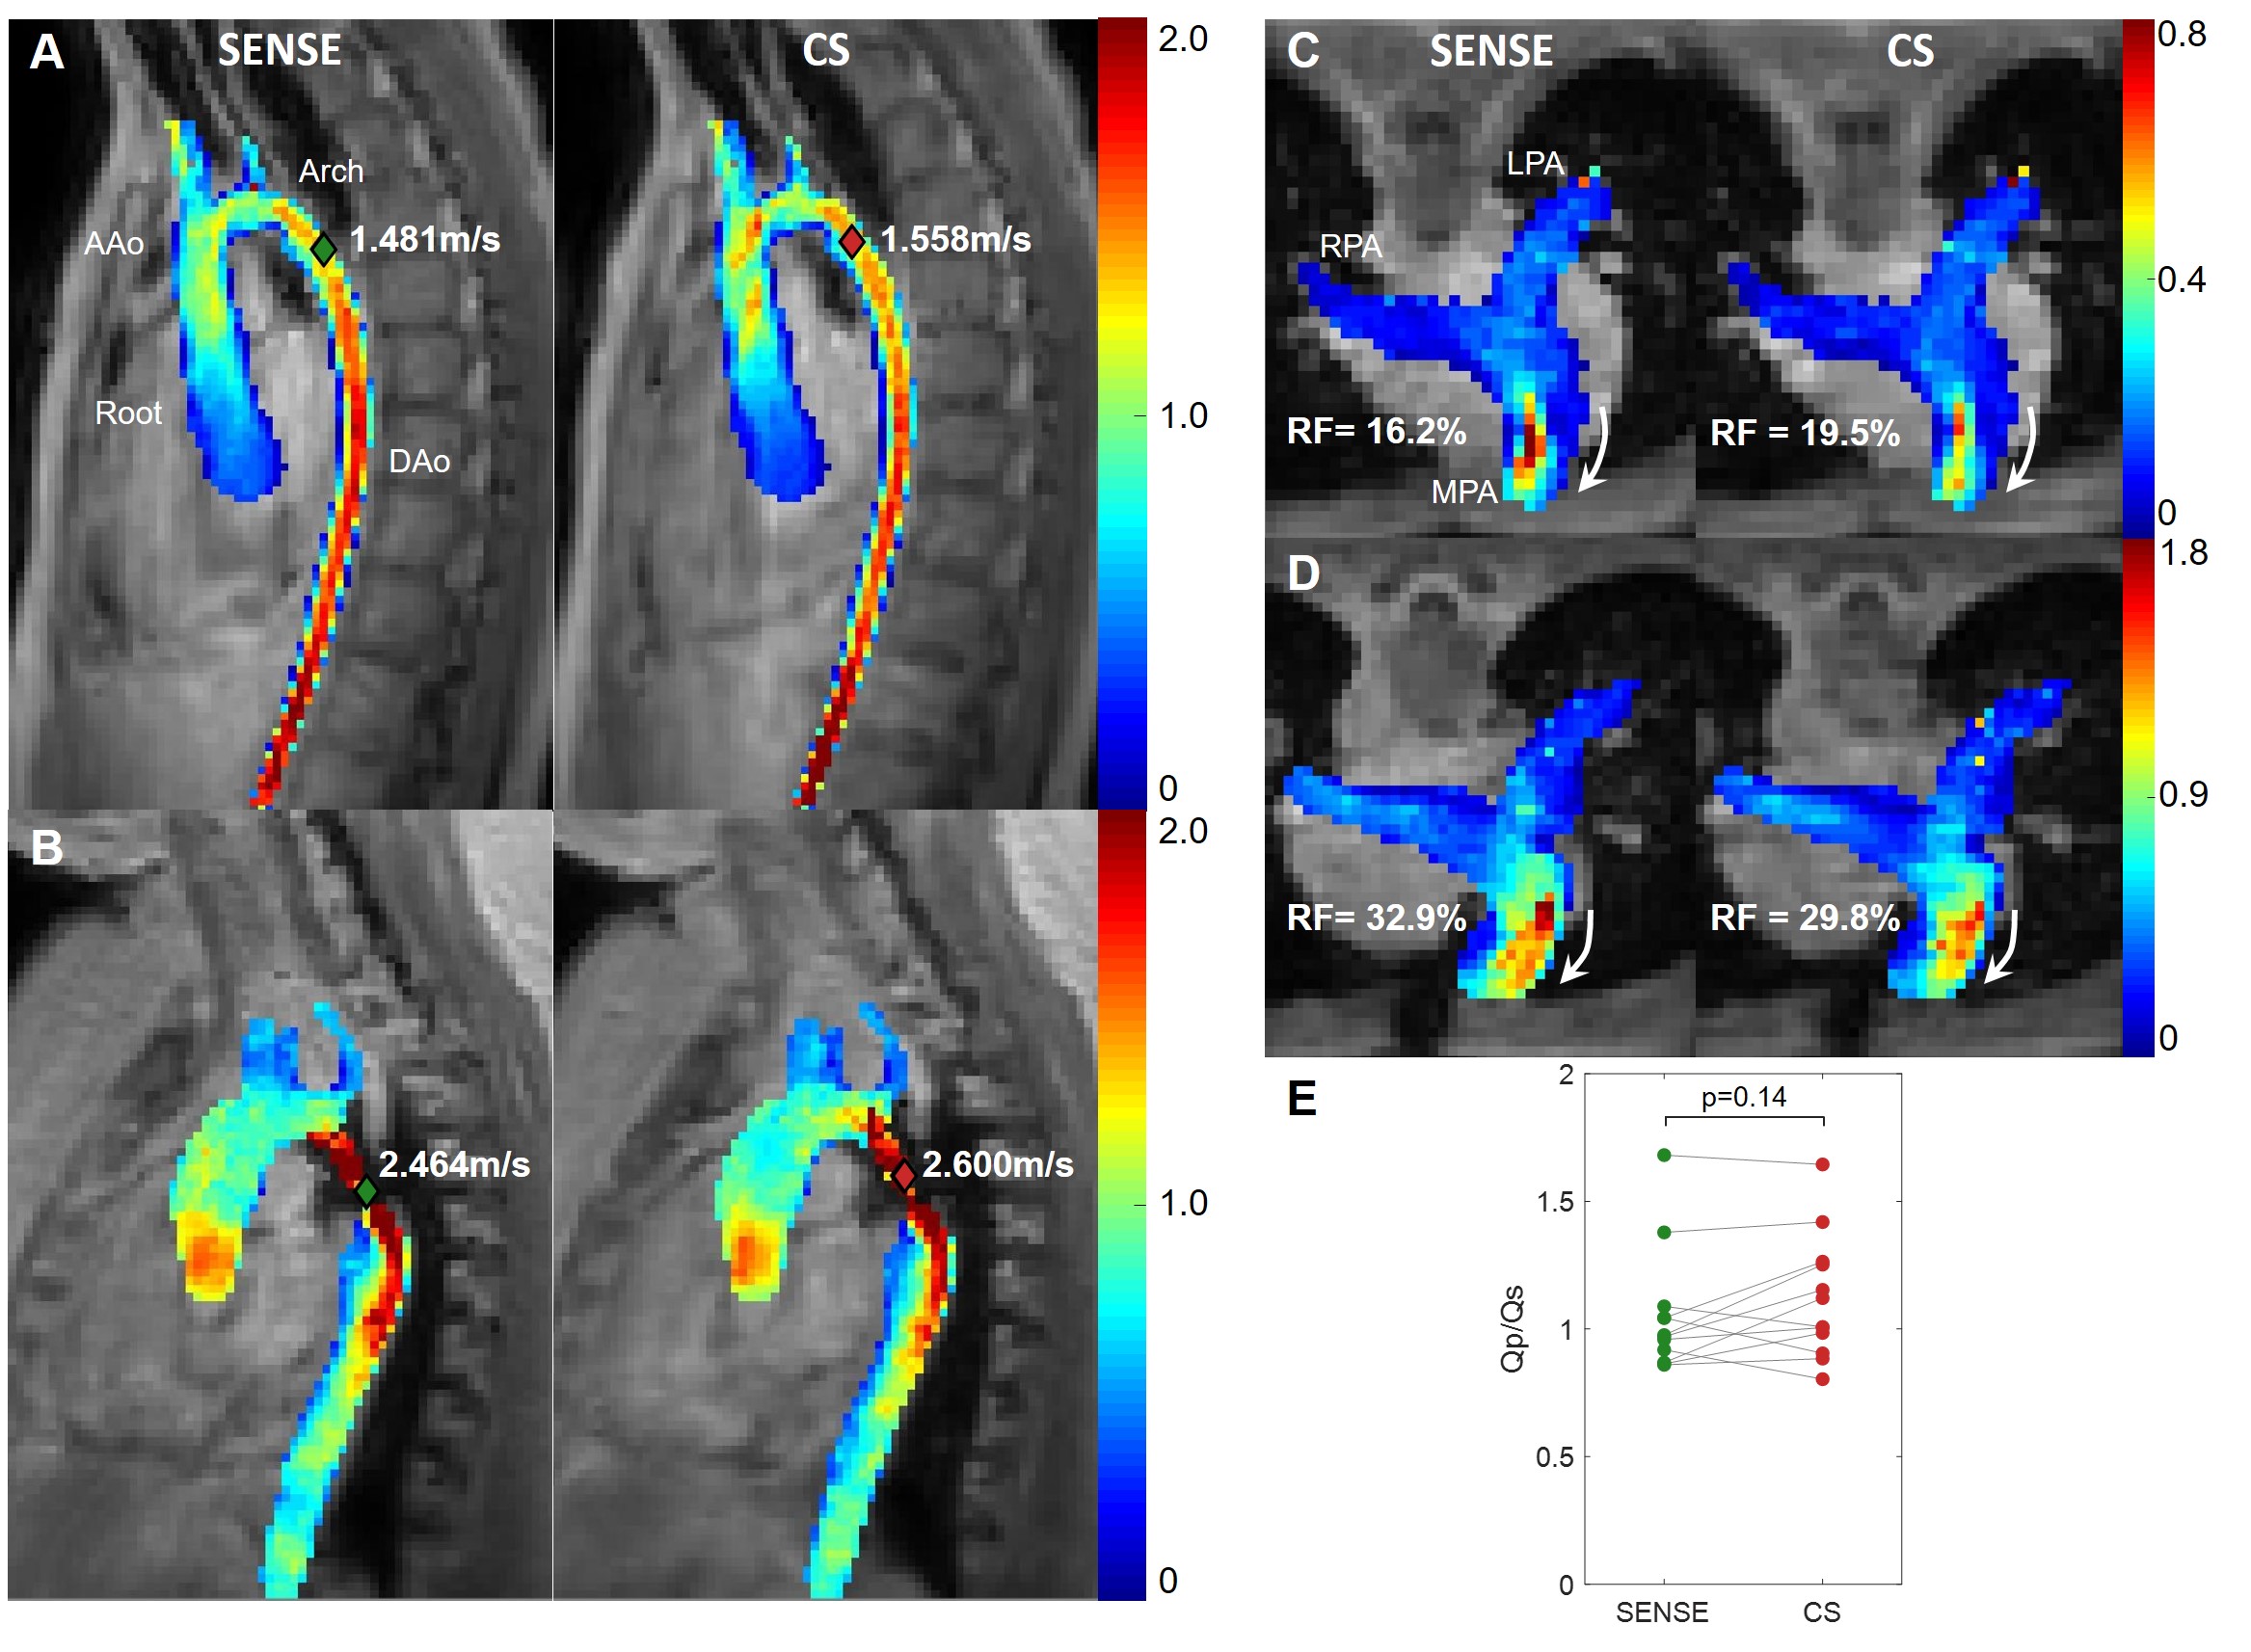
All images were successfully acquired. The pulmonary arteries were not analyzed in three patients (hemi-Fontan circulation in two patients and severe aliasing in a patient with dysplastic pulmonary valve). In total, quantitative analysis included 15 aortas and 12 pulmonary arteries. CS had consistently faster scan times, 3:47±1:09 vs. 5:23±1:34 min, a reduction of 30.2% (Table 1, p < 0.01). Peak flow, peak velocity and net flow were not significantly different between SENSE and CS (p<0.08, Table 1). Averaged flow waveforms were similar (Fig. 3). The maximum coarctation velocities were similar with a mean difference of 0.11m/s (Fig.4AB). RF was also similar with mean difference of 3.2% (Fig.4CD). Qp/Qs was not statistically different (p = 0.14, Fig.4E).
Discussion
Flow measurements by CS with 6-fold acceleration agreed with those obtained with parallel imaging and fully sampled data. The previously-reported trend of peak flow underestimation was not found in the flow waveforms2, possibly because this implementation of CS did not apply sparse sampling to the temporal direction1. Instead, slightly lower peak velocities at the location of severe stenosis in the in-vitro model was found, a phenomena that has also been previously reported2. Nonetheless, CS showed equivalent flow quantification values as SENSE with shorter scan times. Further investigation in complex CHD is necessary to better understand the limitations of the CS in severe stenosis.Conclusion
6-fold accelerated 4D flow MRI with CS was accurate for flow quantification in pediatric patients within 4 minutes, suggesting feasibility for pediatric use. Complex flow measurements such as those found post-stenosis flow, should be performed with care.Acknowledgements
No acknowledgement found.References
1. Neuhaus E, Weiss K, Bastkowski R, Koopmann J, Maintz D, and Giese D. Accelerated aortic 4D flow cardiovascular magnetic resonance using compressed sensing: applicability, validation and clinical integration. J. Cardiovasc. Magn. Res. 2019; 21: 65.
2. Ma L, Markl M, Chow K, Huh H, Forman C, Vali A, Greiser A, Carr J, Schnell S, Barker A J, and Jin N. Aortic 4D flow MRI in 2 minutes using compressed sensing, respiratory controlled adaptive k-space reordering, and inline reconstruction. Magn. Reson. Med. 2019; 81 (6): 3675-3690.
Figures