2271
Comparison of Radial Acceleration Techniques for Dual-Venc 4D Flow MRI of the Left Ventricle: Validation with Particle Imaging Velocimetry1Medical Physics, University of Wisconsin-Madison, Madison, WI, United States, 2Mechanical Engineering, University of Wisconsin-Madison, Madison, WI, United States, 3Radiology, University of Wisconsin-Madison, Madison, WI, United States, 4Biomedical Engineering, University of Wisconsin-Madison, Madison, WI, United States
Synopsis
Dual-Venc 4D flow MRI offers higher velocity sensitivity than single-Venc imaging but requires increased scan time. Radial sampling, either with a 3D-radial or hybrid stack-of-stars (SOS) trajectory, allows for acceleration that can offset the increase, but the optimal technique depends on anatomical region and is not apparent for imaging the left ventricle (LV). We compared 3D-radial and SOS velocity images in an in-vitro LV model versus a reference dataset acquired with particle imaging velocimetry (PIV), an experimental optical imaging technique. 3D-radial matched PIV velocities better than SOS, suggesting it is better for accelerated, dual-Venc imaging of the LV.
Introduction
Four-dimensional (4D) flow MRI allows for comprehensive assessment of in-vivo blood flow1. Velocity images require a predefined maximum encoded velocity (Venc), which is typically set above the maximum expected velocity. Noise in the velocity image is proportional to the Venc, so regions of flow much slower than the Venc are difficult to capture accurately. Dual-Venc imaging improves the dynamic range by acquiring two datasets and using a high-Venc image to unwrap velocity aliasing in a low-Venc image2,3. This technique requires additional scan time, but accelerated acquisitions can help offset that increase. Radially undersampled k-space acquisitions, either with a true 3D-radial or stack-of-stars (SOS) trajectory, have been successfully utilized for accelerated 4D flow MRI4,5. SOS is a hybrid technique with Cartesian through-plane and radial in-plane encoding that enables shorter scan times when acquiring a small number of slices. However, when a moderate number of slices are required, such as in left ventricle (LV) imaging, it is unclear which technique is best-suited. Here we compare 3D-radial versus SOS techniques for dual-Venc imaging of the LV, using an in-vitro model and particle imaging velocimetry (PIV) as a reference standard.Methods
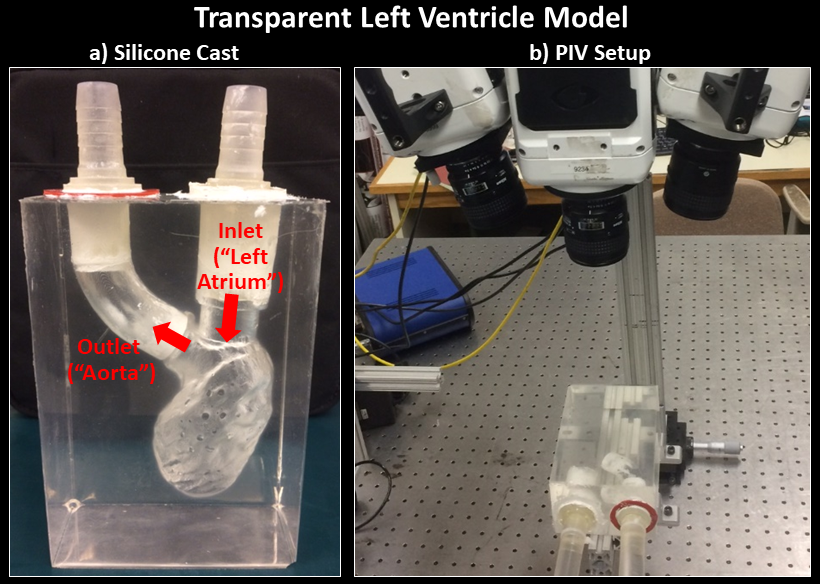
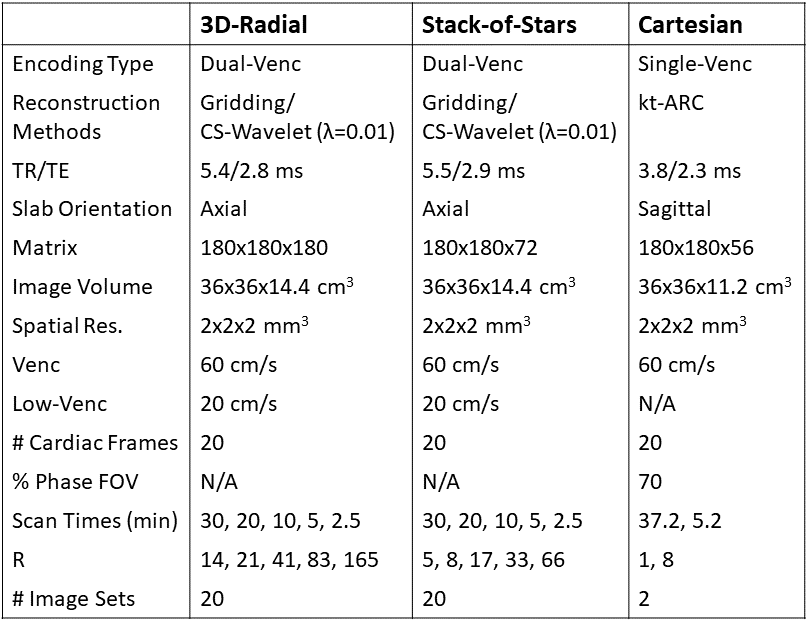
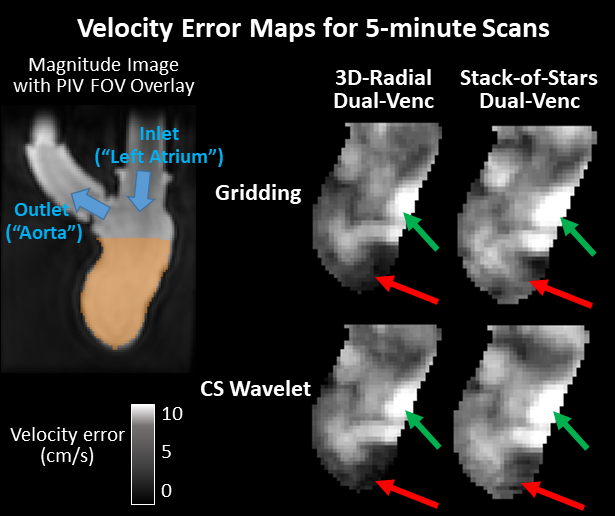
A simplified rigid in-vitro model of the LV was constructed using a published method6. The LV was segmented from a healthy adult’s cardiac CT and 3D-printed in polyvinyl alcohol (PVA). The PVA model was cured in silicone and then dissolved in water, leaving an LV cavity in the silicone model. The model was connected to a pulsatile flow pump (PD-1100, BDC Laboratories, Wheat Ridge, CO, flow rate=2.5L/min) and imaged with tomographic PIV - a 3D, high spatiotemporal resolution experimental technique using high-speed cameras to measure fluid velocities by tracking laser-illuminated fluorescent particles7. PIV data was acquired with a Flowmaster system (LaVision, Göttingen, Germany) in 5mm slabs and stitched together with a custom Matlab script. Figure 1 shows the model and PIV setup. The model was also imaged in a 3T MRI scanner (Signa Premier, GE Healthcare, Waukesha, WI) with four distinct 4D flow acquisitions: two with a product Cartesian single-Venc sequence (1 fully sampled, 1 kt-ARC8 8-fold accelerated) and two with an in-house-implemented, radial dual-Venc sequence (1 3D-radial, 1 SOS). From each radial acquisition, 20 datasets were reconstructed: 5 levels of retrospective undersampling x 2 encoding types (dual-Venc and high-Venc-only) x 2 reconstruction methods (gridding and spatial-wavelet-transform compressed sensing [CS; λ=0.01 determined empirically]). Images were acquired with typical in-vivo orientations and fields of view. Table 1 shows MRI parameters. MRI images were manually registered to the PIV dataset, and then compared separately to 2 different reference images: (1) PIV and (2) the most densely sampled MRI dataset with the same trajectory. For each comparison, a velocity difference image was computed as the magnitude of the vector difference between test and reference image velocities for all voxels in the LV cavity.Results
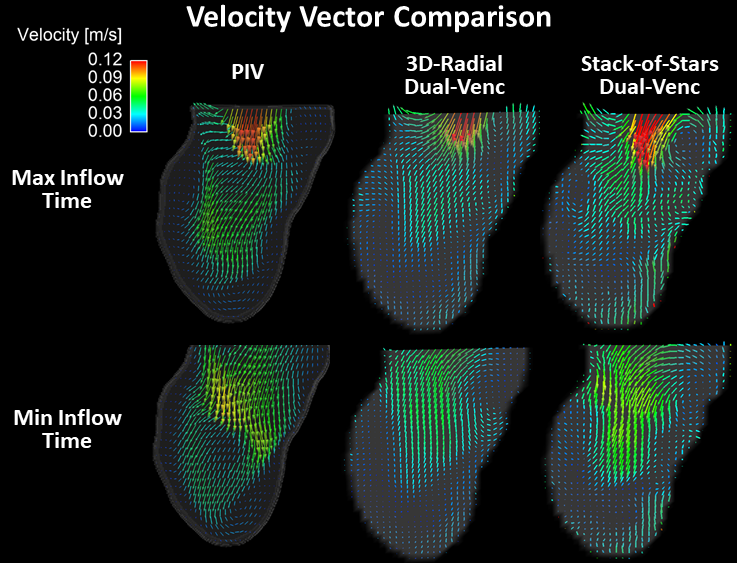
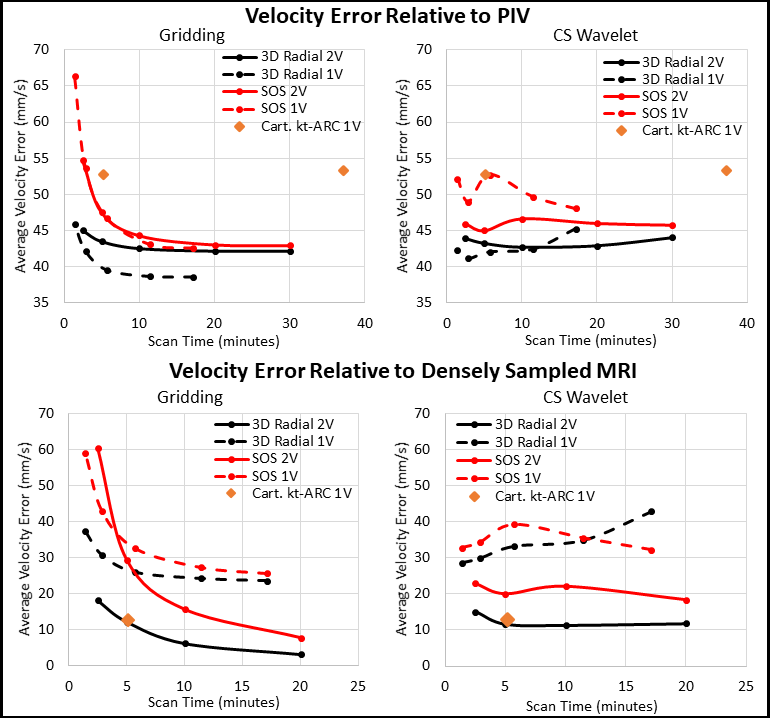
Figure 2 shows velocity vector visualizations from the PIV, 3D-radial, and SOS MRI datasets. Figure 3 shows plots of average velocity error relative to PIV and densely sampled MRI. 3D-radial velocities more closely matched PIV velocities than did SOS velocities for all scan times, reconstructions, and encoding strategies. Compared to CS-reconstructed data, gridding-reconstructed data matched PIV better at long acquisition times but worse at short acquisition times. With densely sampled MRI as the reference, 3D-radial images had lower velocity error than SOS images, and dual-Venc images had lower velocity error than single-Venc images. The kt-ARC-accelerated Cartesian dataset matched its densely sampled reference as well as the dual-Venc 3D-radial images did but diverged from PIV velocities more than both radial techniques. Figure 4 shows velocity error maps relative to PIV for 5-minute 3D-radial and SOS MRI images.Discussion
In velocity vector images, flow patterns were qualitatively similar in PIV, 3D-radial, and SOS images, but the PIV image appeared least noisy. In the quantitative comparison, 3D-radial data outperformed SOS. The differences between these images can be attributed to differential undersampling artifacts. While the acceleration factors were higher in the 3D-radial than SOS images for a given scan time, the SOS sampling pattern was more structured, resulting in a more obtrusive undersampling artifact. Images reconstructed via gridding exhibited a predictable tradeoff between scan time and velocity error, while CS images contained similar error at all scan times. This suggests that much of the velocity error in the CS images stemmed from sparsity enforcement rather than from undersampling. A lower lambda value may have improved long-acquisition-time CS images. Velocity-error-relative-to-PIV maps yielded similar patterns regardless of radial trajectory, with some subtle differences in the LV apex. Since experimental setup was kept as similar as possible between PIV and MRI experiments, the portion of the error that was independent of MRI technique likely reflects a bias between PIV and MRI rather than a difference in the true flow.Conclusion
We conclude that 3D-radial rather than SOS acquisition should be used for radially-undersampled 4D flow MRI of the LV. We also determine that CS-wavelet reconstruction is a reasonable choice for highly-undersampled radial 4D flow images of the LV. When used with dual-Venc acquisition and CS reconstruction, 3D-radial 4D flow MRI can provide highly accurate velocity estimation even at short scan times.Acknowledgements
Research reported in this publication was supported by the National Heart, Lung, And Blood Institute of the National Institutes of Health under Award Number F31HL144020. The content is solely the responsibility of the authors and does not necessarily represent the official views of the National Institutes of Health. We wish to thank GE Healthcare who provides research support to the University of Wisconsin.References
1. Dyverfeldt P, Bissell M, Barker AJ, et al. 4D flow cardiovascular magnetic resonance consensus statement. J Cardiovasc Magn Reson. 2015;17:72. doi:10.1186/s12968-015-0174-5
2. Lee AT, Bruce Pike G, Pelc NJ. Three‐Point Phase‐Contrast Velocity Measurements with Increased Velocity‐to‐Noise Ratio. Magn Reson Med. 1995;33(1):122-126. doi:10.1002/mrm.1910330119
3. Schnell S, Ansari SA, Wu C, et al. Accelerated dual-venc 4D flow MRI for neurovascular applications. J Magn Reson Imaging. 2017;46(1):102-114. doi:10.1002/jmri.25595
4. Johnson KM, Lum DP, Turski PA, Block WF, Mistretta CA, Wieben O. Improved 3D phase contrast MRI with off-resonance corrected dual echo VIPR. Magn Reson Med. 2008;60:1329-1336. doi:10.1002/mrm.21763
5. Kecskemeti S, Johnson K, Wu Y, Mistretta C, Turski P, Wieben O. High resolution three-dimensional cine phase contrast MRI of small intracranial aneurysms using a stack of stars k-space trajectory. J Magn Reson Imaging. 2012;35(3):518-527. doi:10.1002/jmri.23501
6. Ruedinger KL, Medero R, Roldán-Alzate A. Fabrication of Low-Cost Patient-Specific Vascular Models for Particle Image Velocimetry. Cardiovasc Eng Technol. 2019.
7. Medero R, Hoffman C, Roldán-Alzate A. Comparison of 4D Flow MRI and Particle Image Velocimetry Using an In Vitro Carotid Bifurcation Model. Ann Biomed Eng. 2018. doi:10.1007/s10439-018-02109-9
8. Okuda S, Yamada Y, Tanimoto A, et al. Three-dimensional cardiac cine imaging using the kat ARC acceleration: Initial experience in clinical adult patients at 3T. Magn Reson Imaging. 2015;33(7):911-917. doi:10.1016/j.mri.2015.04.004
Figures