2270
5D Flow – A quantitative in vivo comparison between Self-Gating and Pilot Tone Gating1Department of Diagnostic and Interventional Radiology, Lausanne University Hospital (CHUV) and University of Lausanne (UNIL), Lausanne, Switzerland, 2Department of Radiology, Feinberg School of Medicine, Northwestern University, Chicago, IL, United States, 3Department of Biomedical Engineering, Northwestern University, Chicago, IL, United States, 4Siemens Healthcare GmbH, Erlangen, Germany, 5Advanced Clinical Imaging Technology, Siemens Healthcare AG, Lausanne, Switzerland, 6Center for Biomedical Imaging, Lausanne, Switzerland, 7Department of Cardiology, Lausanne University Hospital (CHUV), Lausanne, Switzerland
Synopsis
Conventional 4D flow MRI techniques often have prolonged and unpredictable scan times, due to the use of respiratory navigation. To address this, a fully self-gated cardiac and respiratory motion-resolved whole-heart 5D flow protocol with a fixed scan time was recently developed using a free-running framework. This protocol extracts cardiac and respiratory signals from periodic readouts (self-gating). In this study, we explore the use of Pilot Tone signals as an alternative method for cardiac and respiratory signal extraction to reconstruct 5D flow data and compare reconstructions to those using the previously established self-gating method and the conventional 4D flow sequence.
Introduction
Conventional 4D flow MRI techniques often have prolonged and unpredictable scan times, due to the use of respiratory navigation. As a result, acquiring whole-heart 4D flow images in a clinically acceptable scan time (<10min) is challenging. To address this, a fully self-gated cardiac and respiratory motion-resolved whole-heart 5D flow protocol with a fixed scan time was recently developed using a free-running framework[1,2,3]. This method employs a continuous, non-ECG triggered 3D radial acquisition with phyllotaxis sampling[4] and periodic readouts for cardiac and respiratory self-gating (SG)[2]. Pilot Tone signals (PT), acquired in parallel to the MR acquisition, have also been recently proposed for cardiac and respiratory gating[5,6]. The PT Navigation system consists of a transmitter that generates an alternating magnetic field with a frequency outside the band occupied by the MR signal. The field received by the local MR coils is modulated by motion[5,6]. Both SG and PT potentially replace the ECG signal and navigator scans in 4D/5D flow imaging. In this study, we explore the use of PT signals to reconstruct 5D flow data and compare reconstructions to those using the previously reported SG method[3] as well as a reference standard 4D flow sequence.Methods
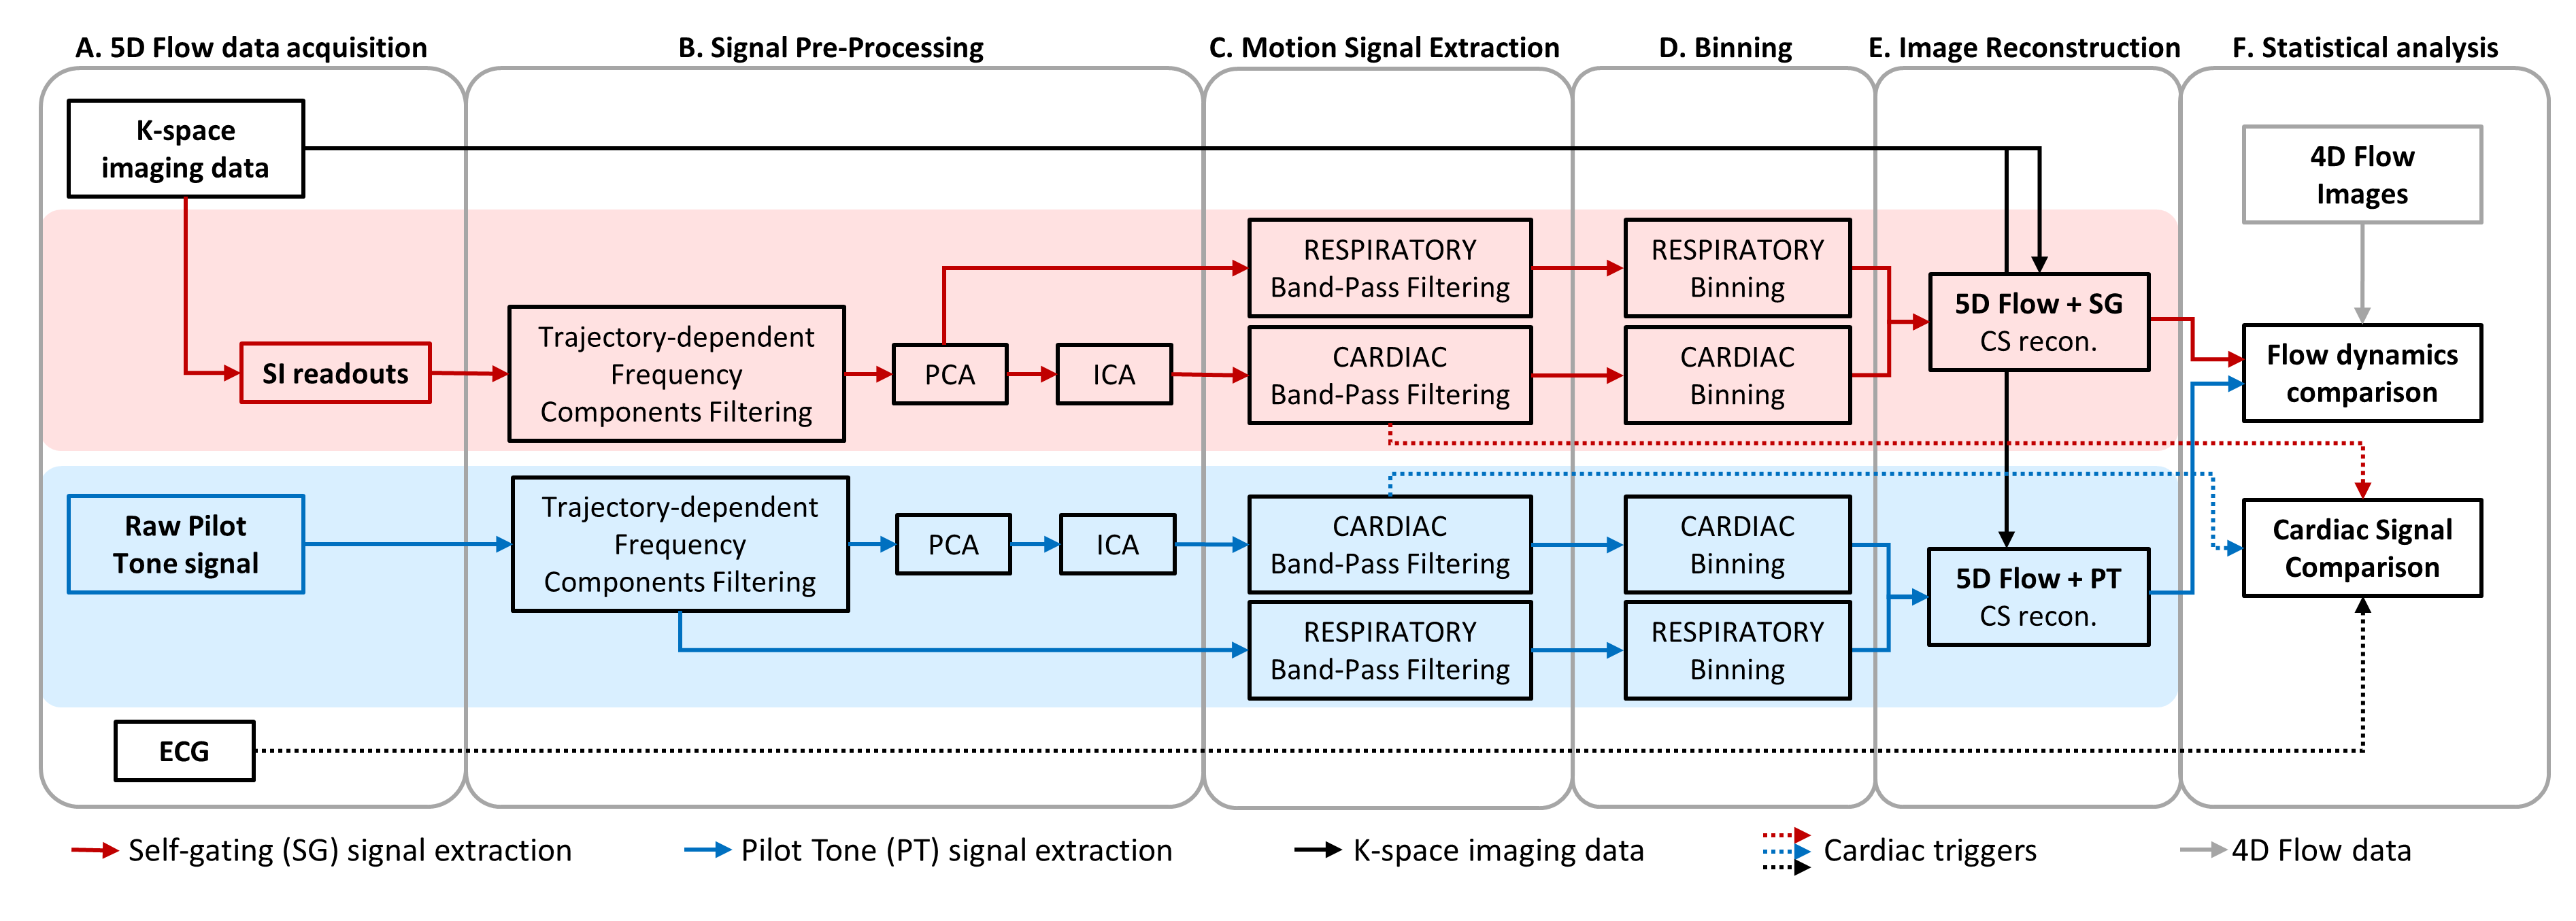
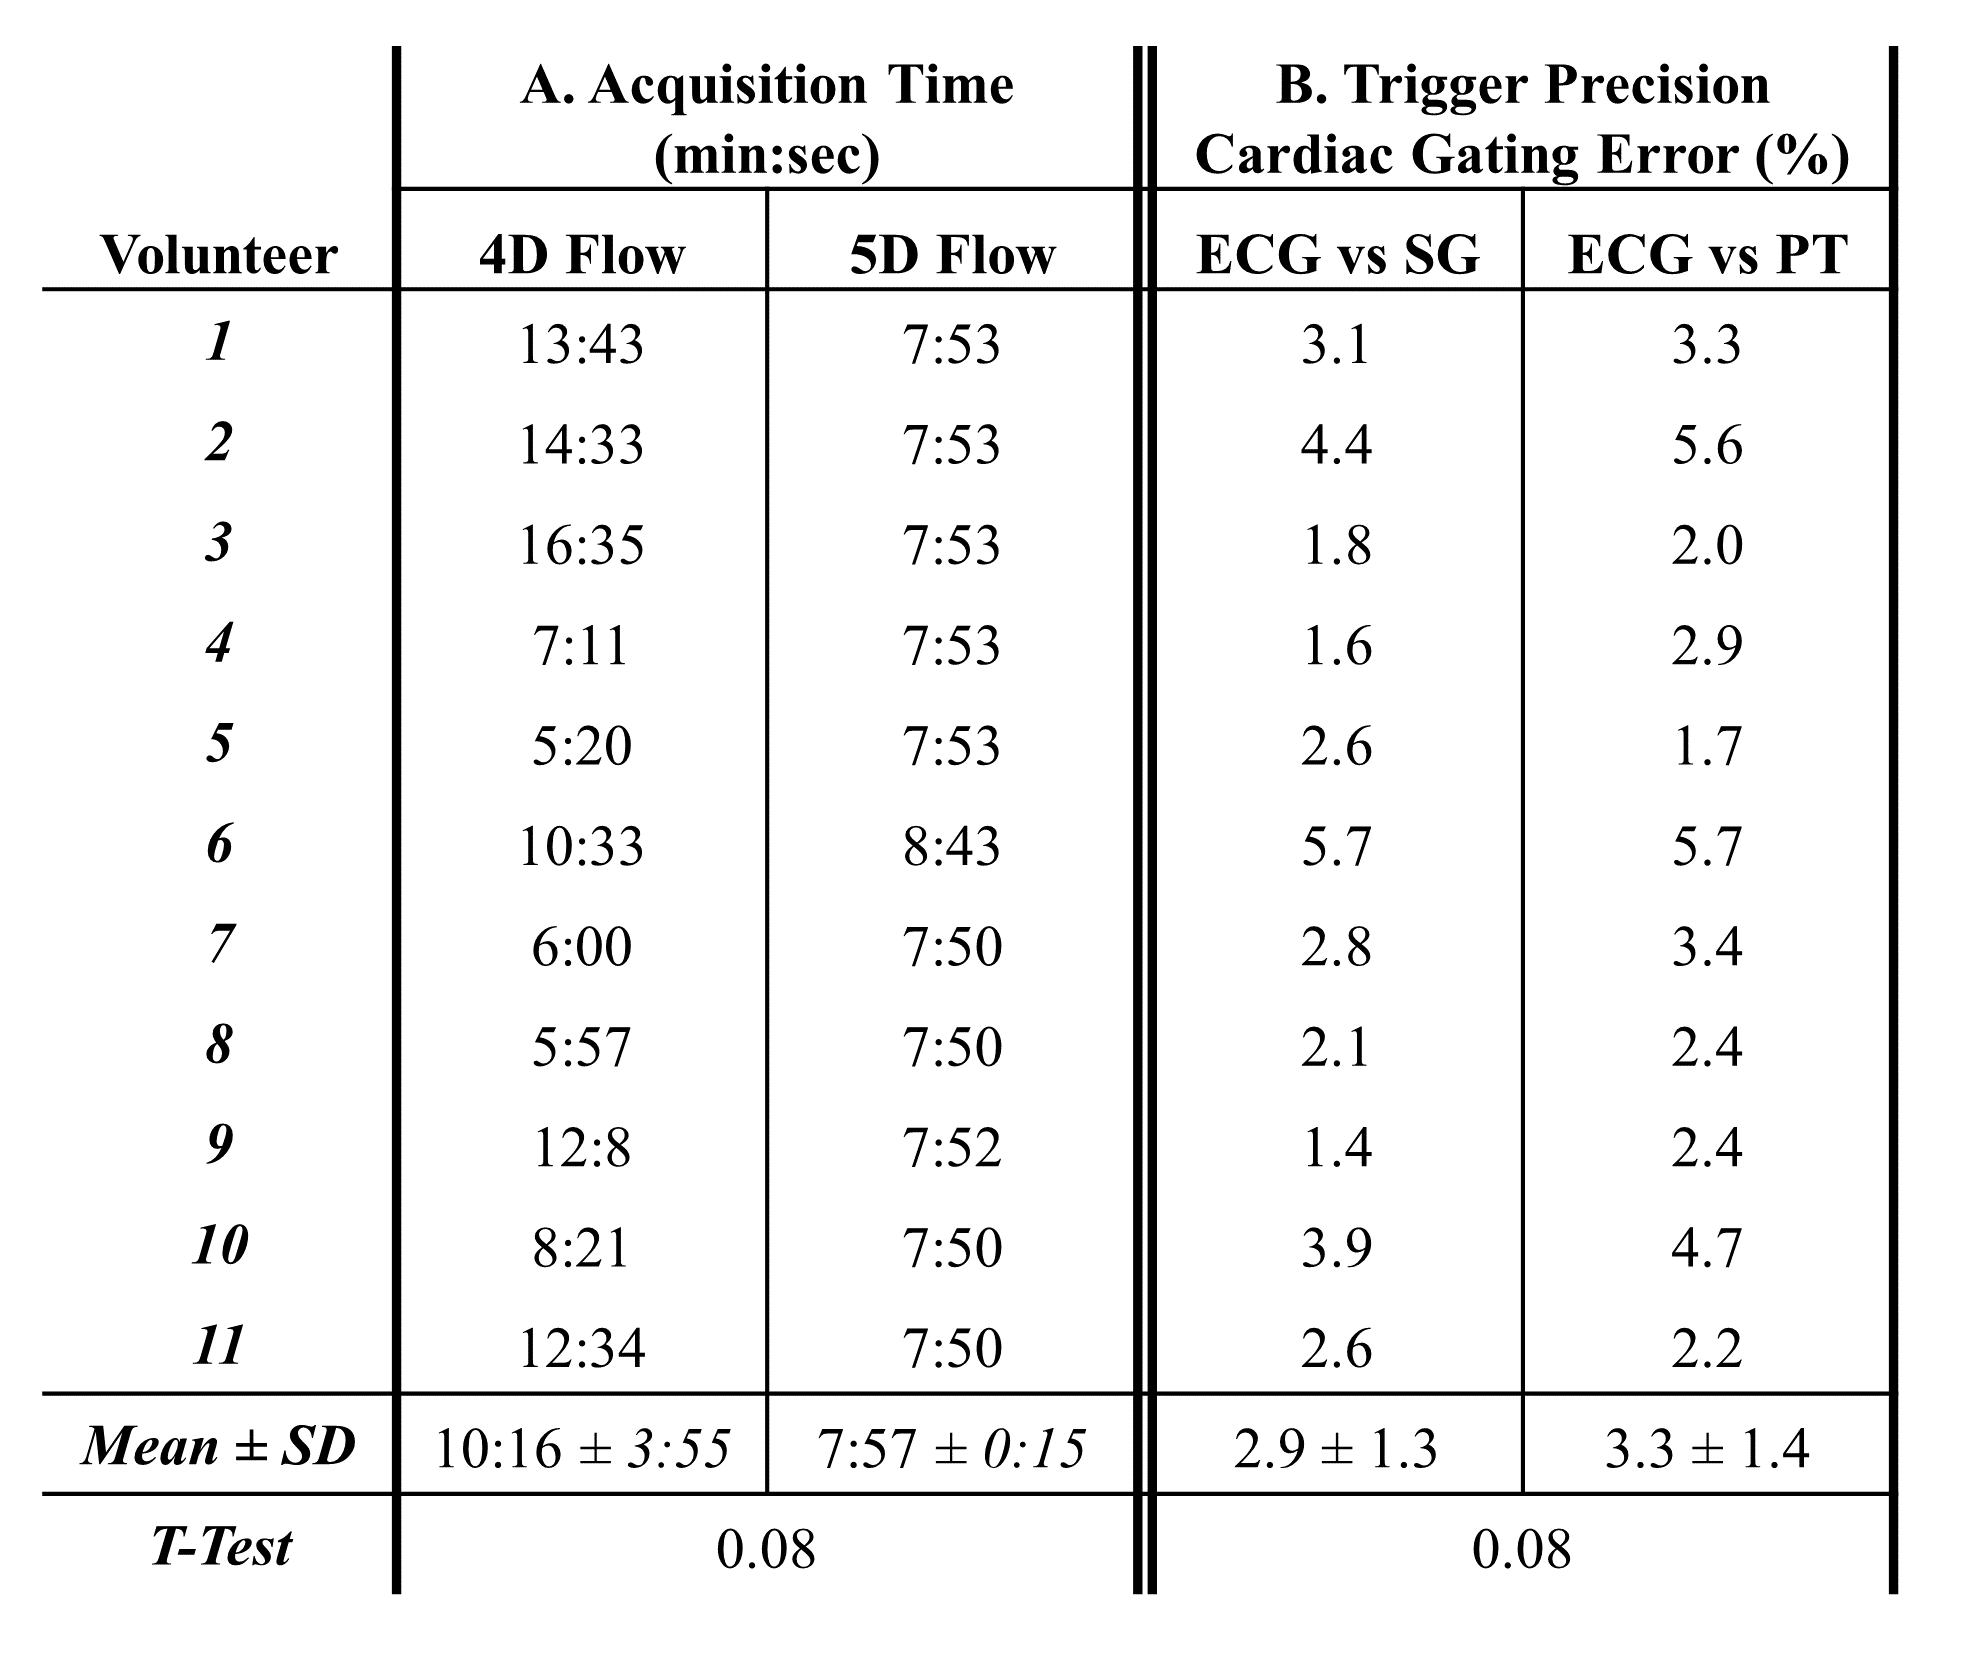
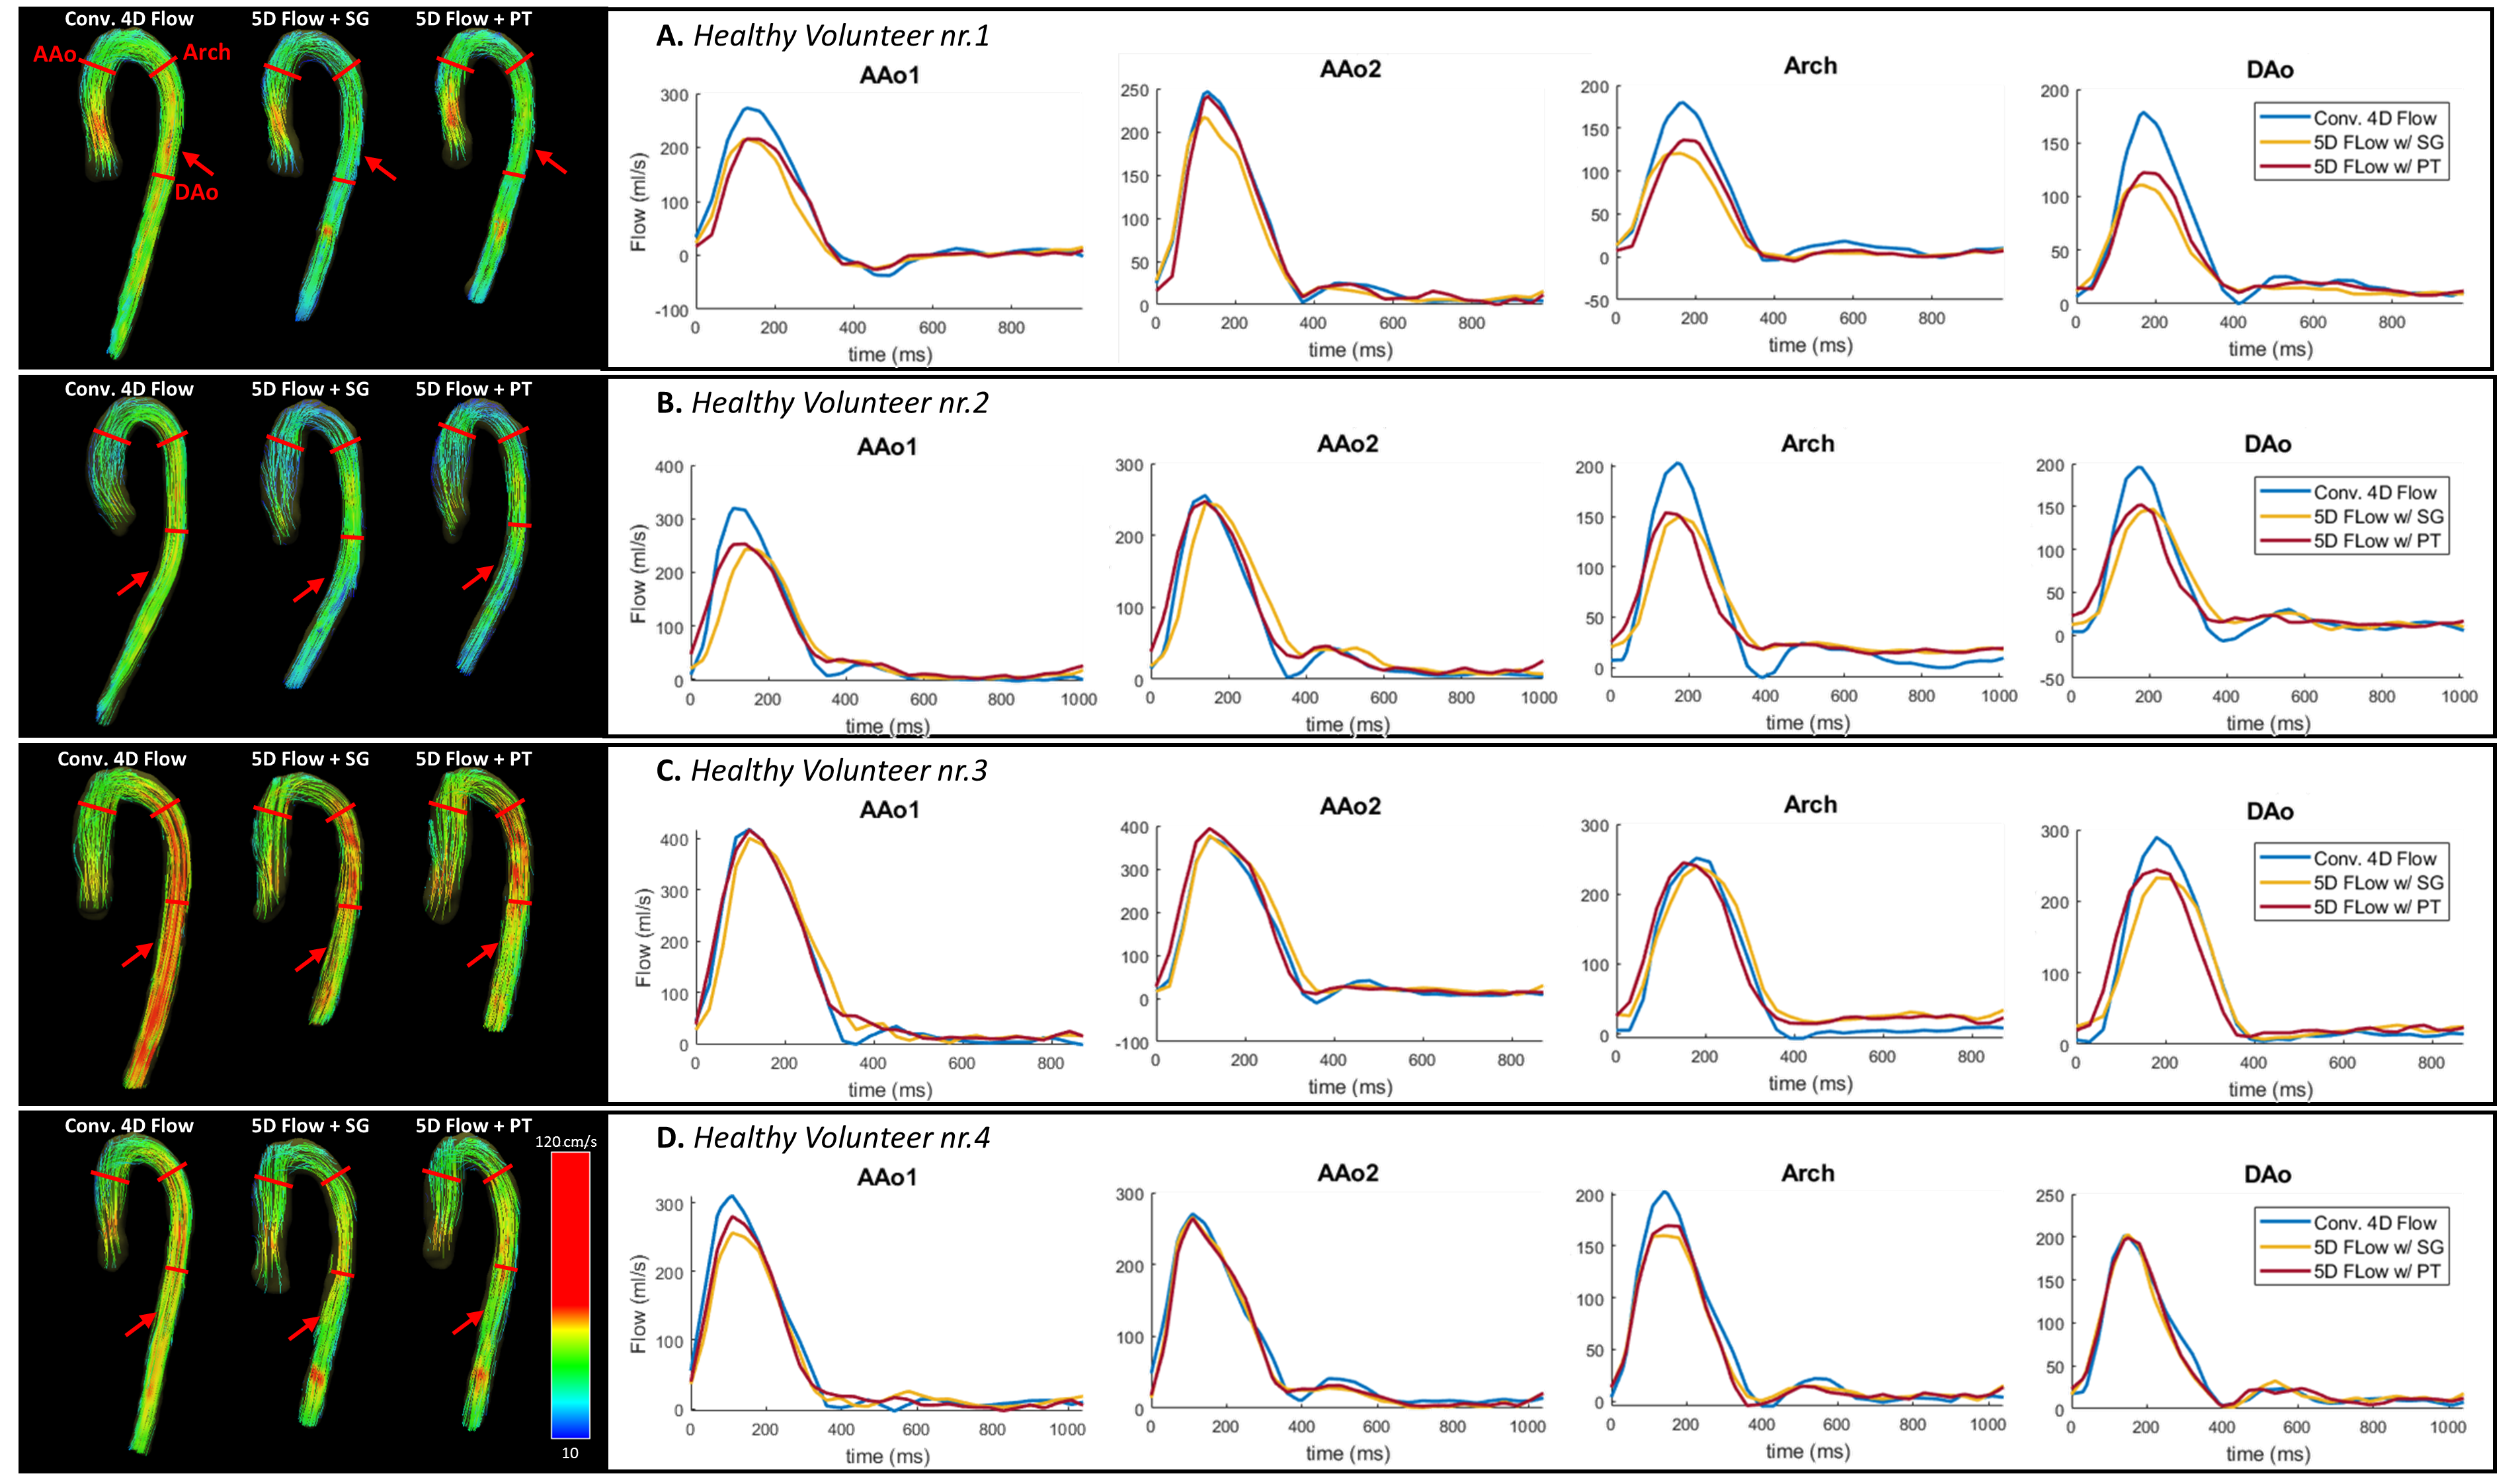
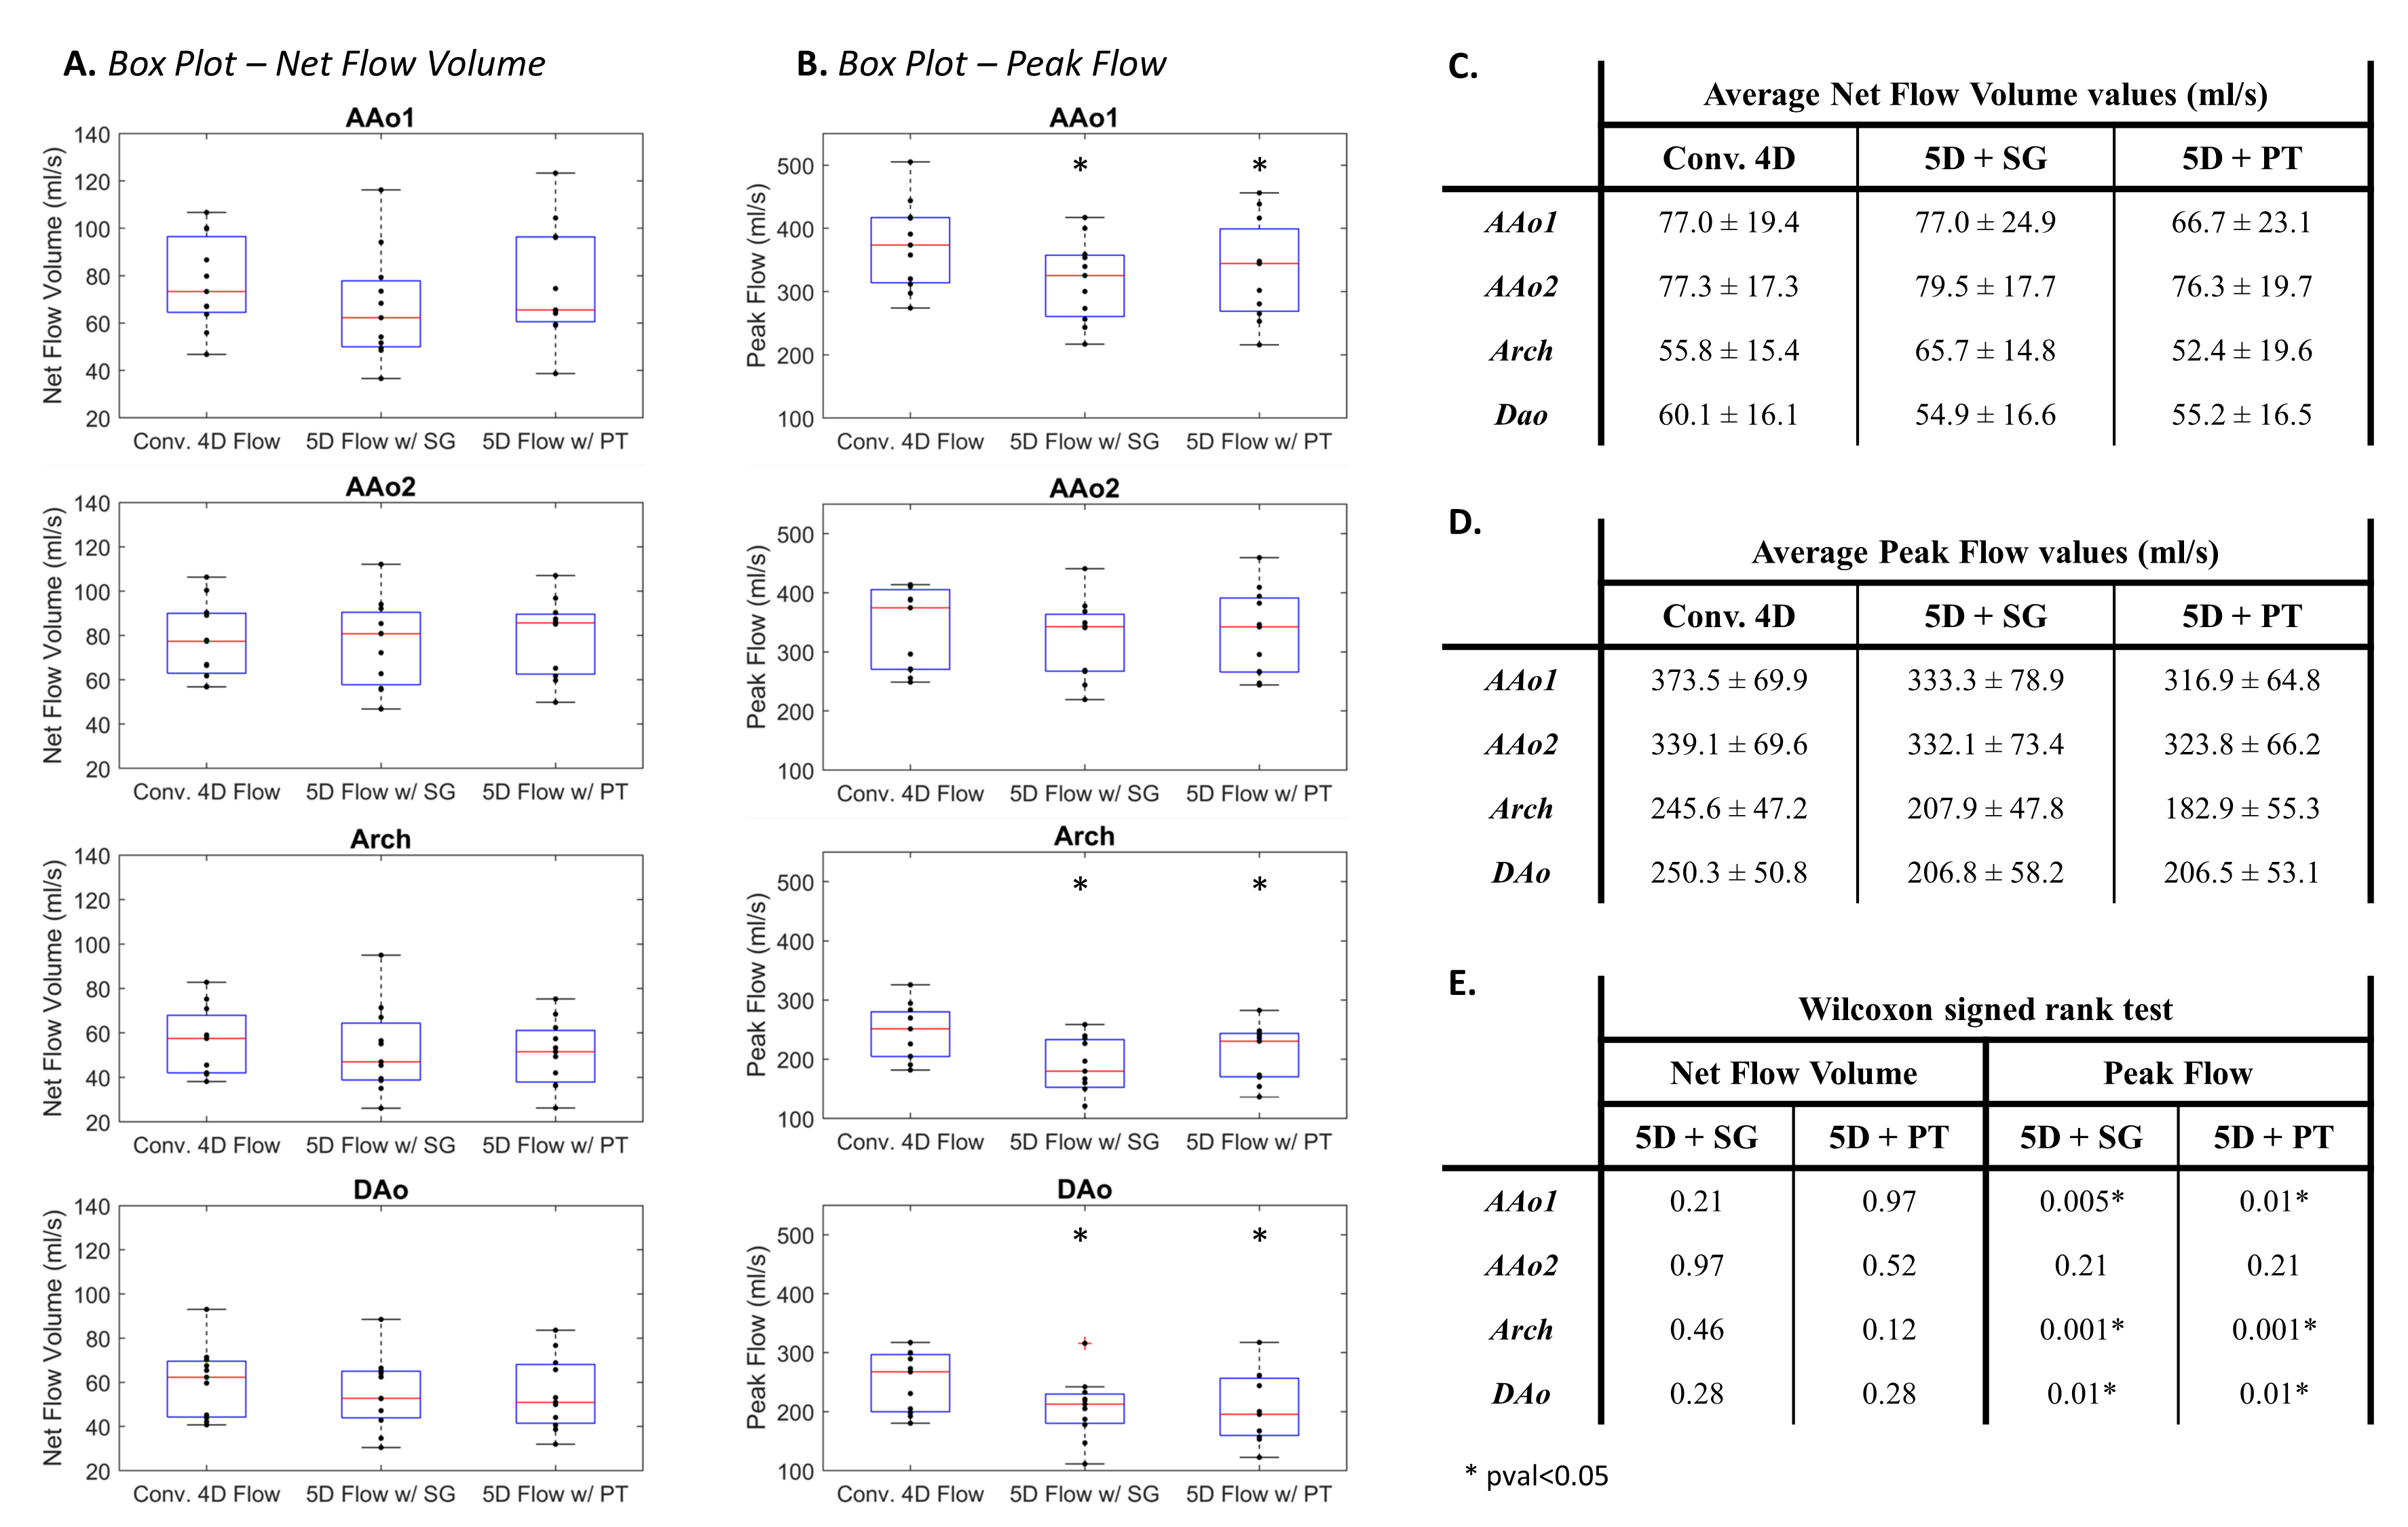
One navigator gated 4D flow sequence[7] covering the aorta and one prototype free-running radial whole-heart 5D flow sequence[3] were used for imaging in 11 healthy adult volunteers (age: 27.9±3.6 years) who provided written informed consent on a 1.5T MAGNETOM Sola (Siemens Healthcare, Erlangen, Germany), using a 12-channel body coil with an integrated PT transmitter. Scan parameters were: field of view (4D: (200-292.8 mm) x (360-366 mm) x (75-137.4 mm), 5D: (220mm)3-(260mm)3); spatial resolution (4D: 2.4x2.4x2.5 mm3, 5D: (2.3mm)3); temporal resolution (4D: 38.6-57.9ms, 5D: 50ms); velocity encoding (4D/5D: 150cm/s). Both 4D flow and 5D flow were performed during free-breathing and the ECG signal was measured during 5D flow scans for subsequent comparison. The acquisition time of each sequence was also recorded. For 5D flow, cardiac and respiratory signals were retrospectively extracted from SG and PT signals using the post-processing steps outlined in Figure 1. For both SG and PT, the cardiac gating error was quantified as the standard deviation of the difference between SG or PT triggers and the recorded ECG, normalized by the mean ECG RR-Interval[2]. After signal extraction, the SG and PT 5D flow datasets were binned into 4 respiratory and 17-23 cardiac frames, depending on the subject’s heart rate, and reconstructed using XD-GRASP[8]. For the 4D flow datasets and the two 5D flow datasets (with SG and PT), flow curves were calculated in two segments of the ascending aorta (AAo1, AAo2), one segment of the descending aorta (Dao), and one segment of the aortic arch (Arch) using Siemens 4D Flow v2.4. Additionally, the net flow volume and peak flow were computed and compared using the Wilcoxon signed rank test.Results
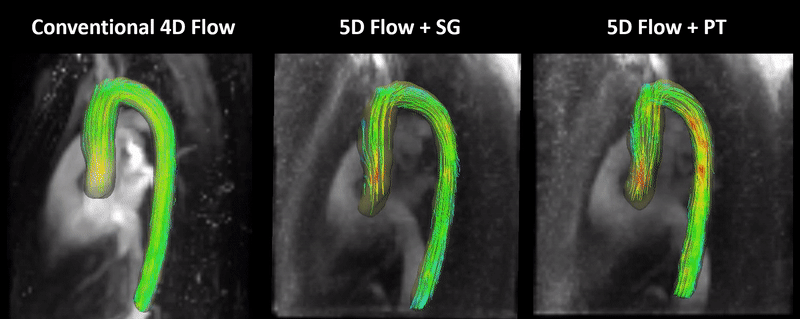
The acquisition time of the 5D flow sequence (7min 57s±15s) was shorter (p=0.08) and less variant than that of the 4D flow protocol (10min 16s±3min 55s) across all subjects (Figure 2). The mean and standard deviation of the cardiac gating error across volunteers were 2.9±1.3% for SG and 3.3±1.4% for PT (Figure 2, p=0.08). Figure 3 shows flow curves for the four aortic segments in four subjects, as well as flow streamlines immediately after peak systole for 4D flow and 5D flow reconstructed with self-gated and Pilot Tone gated signals. A flow animation for a full cardiac cycle using the three reconstructions is depicted in Figure 4. The 3D hemodynamics of the flow streamlines across the same subject were consistent, although some reduced flow values were observed on both 5D flow reconstructions. Regarding the net flow volume (Figure 5), there were no significant differences between 4D flow and either SG or PT 5D flow. Nevertheless, compared to the 4D flow measurements, the peak flow was significantly decreased for both SG and PT 5D flow for the lower segment of the ascending aorta, the descending aorta and the aortic arch (p<0.05).Discussion
5D flow scans provided whole-heart coverage in a predictable and shorter scan time, whereas 4D flow suffered from variable efficiency due to heart rate and variable navigator efficiency secondary to variability in breathing patterns. The cardiac gating error was consistent between SG and PT and within the range of previously reported values for SG[2], demonstrating the feasibility of PT as an alternative method for cardiac and respiratory gating in 5D flow imaging. While underestimation of the peak flow has been reported before[3] and may be caused by temporal undersampling and regularization, further investigation is required. Still, the temporal evolution of the flow curves and agreement in net flow volumes suggests 5D flow using SG or PT is a promising alternative to 4D flow, providing whole-heart coverage with matching temporal and spatial resolution predictably in less than 10min.Conclusions
Pilot Tone signals provide a valuable alternative to self-gating for ECG- and navigator-free cardiac and respiratory motion-resolved 5D flow, while being completely independent of the acquisition. As a result, the feasibility of using Pilot Tone for signal extraction may open new opportunities for improving flow acquisitions, including reduced scan times, and improved k-space sampling.Acknowledgements
No acknowledgement found.References
[1] S. Coppo et al. Free-running 4D whole-heart self-navigated golden angle MRI: Initial results. Magnetic Resonance in Medicine 2015, 74(5), 1306–1316.
[2] L. Di Sopra et al., An Automated Approach to Fully Self-Gated Free-Running Cardiac and Respiratory Motion-Resolved 5D Whole-Heart MR Imaging. Magn Reson Med 2019, In Press
[3] L. Ma et al. 5D flow MRI: A free-running, fully self-gated, radial imaging framework for cardiac and respiratory motion-resolved assessment of 3D blood flow dynamics, Proc. Intl. Soc. Mag. Reson. Med. 27 (2019), 0090.
[4] D. Piccini et al. Spiral Phyllotaxis: The Natural Way to Construct a 3D Radial Trajectory in MRI. Magnetic Resonance in Medicine 2011, 66, 1049–1056.
[5] P. Speier et al. PT-Nav: A Novel Respiratory Navigation Method for Continuous Acquisition Based on Modulation of a Pilot Tone in the MR-Receiver, Proc. ESMRMB 129:97-98, 2015.
[6] M. Bacher et al. Retrospective Evaluation of Pilot Tone Based Cardiac Trigger Quality In A Volunteer Cohort, Book of Abstracts ESMRMB 2017 30:360- 361.
[7] P. Dyverfeldt et al. 4D flow cardiovascular magnetic resonance consensus statement. Journal of Cardiovascular Magnetic Resonance 2015, 17(1), 1–19.
[8] L. Feng et al. 5D whole-heart sparse MRI. Magn Reson Med 2017, 79(2), 826–838.
Figures