2269
4D flow MRI vs. Doppler Echocardiography: Data Integration Framework for Direct Comparison of Intra-cardiac Flow Dynamics1Radiology, Northwestern University, Chicago, IL, United States, 2Cardiology, Northwestern Memorial Hospital, Chicago, IL, United States, 3Radiology, University of Colorado Denver, Denver, CO, United States, 4Biomedical Engineering, Northwestern University, Chicago, IL, United States
Synopsis
We developed a framework to integrate 4D flow MRI with color Doppler echocardiography (CDE) for direct localized inter-modal velocity comparison. The framework combines CDE and 4D flow MRI data by using cine-MRI and a two-step image registration; 1) registration of CDE to cine-MRI and 2) registration of cine-MRI to 4D flow MRI. As a result, a voxel-wise inter-modal velocity difference map overlaid to a tissue image was constructed. Six healthy subjects with a same-day CDE and 4D flow MRI were utilized and a strong correlation with moderate agreement was found in the LVOT.
Introduction
4D flow MRI is an emerging technique capable of visualizing complex 3D cardiovascular flow. Previous studies have demonstrated that 4D flow MRI can assess 3D hemodynamic parameters (e.g. wall shear stress distribution1, 3D flow patterns2, and viscous energy loss3) associated with cardiovascular diseases. In order to demonstrate clinical utility, comparisons must be made with Doppler echocardiography, the reference standard for clinical cardiovascular flow assessment. Previous comparison studies have focused on peak velocity4-8 and shown 4D flow MRI can measure comparable velocity when encoding velocity was appropriately set prior to a scan4. However, those studies did not match the measurement location, and thus, are not fully investigating inter-modality agreement. This limitation can be tackled by using 2D color Doppler echocardiography (CDE) which measures the planar velocity field. The goal of this study was to develop a framework for matching measurement locations of ‘same-day’ 4D flow MRI and CDE to perform voxel-wise velocity comparison.Methods
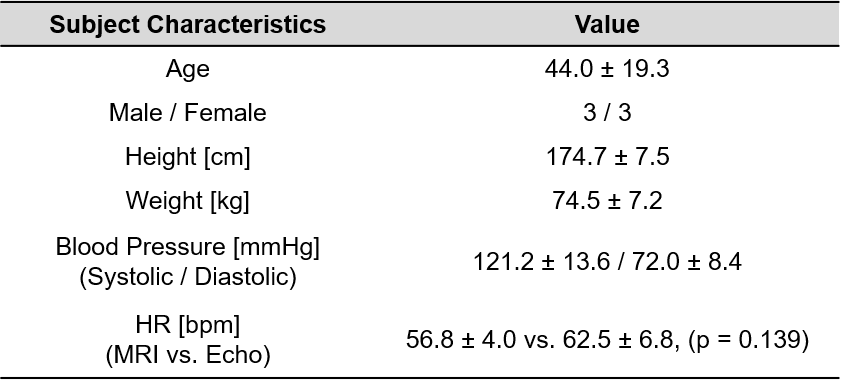
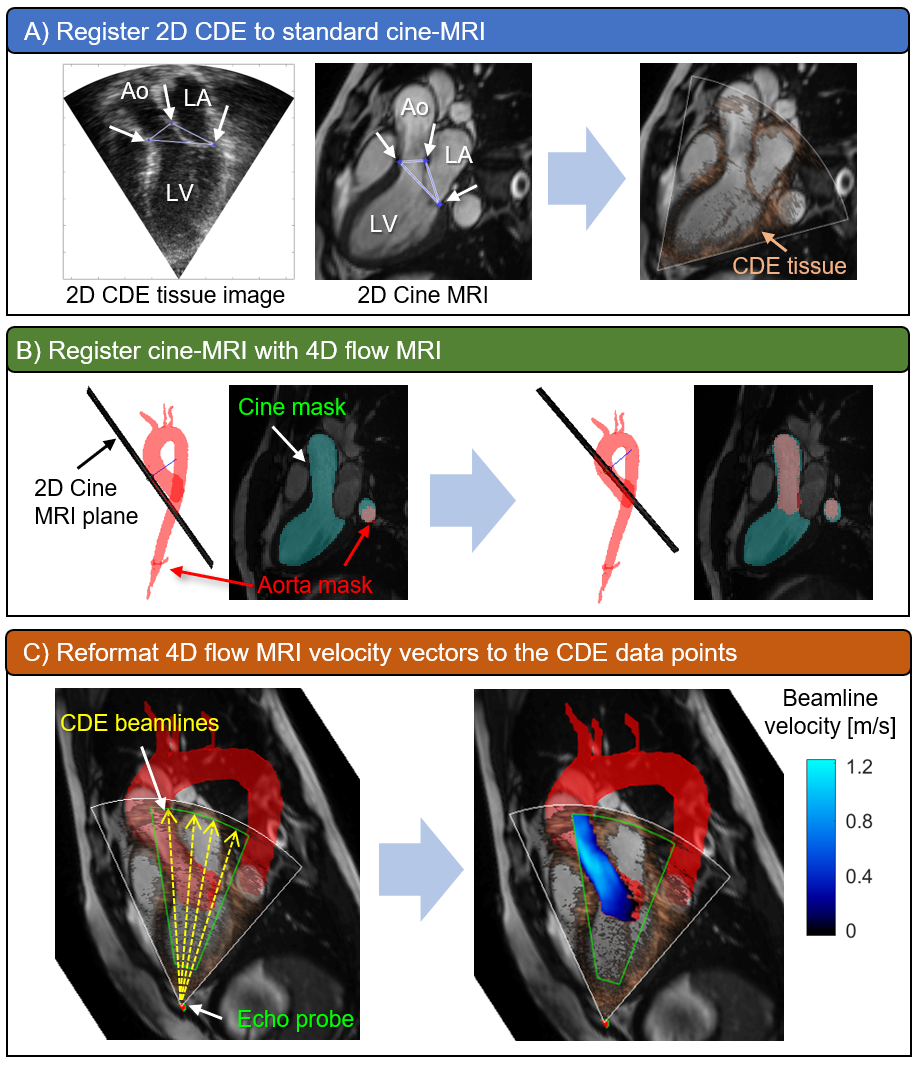
Six healthy volunteers underwent free-breathing 4D flow MRI (spatial resolution=3.4-3.8 x 2.4-2.5 x 2.4-2.8 mm3, temporal resolution=38.4-40.6 ms, venc=150 cm/s, 1.5T Aera: Siemens Healthcare, Erlangen, Germany) and transthoracic echocardiography on the same day. Baseline characteristics of the subjects are listed in Table 1. 4D flow MRI datasets were preprocessed by using MATLAB (R2018b, Mathworks Inc., Natick, USA) for phase offset correction, noise masking, anti-aliasing as described previously9. MRI velocity datasets were segmented in 3D, including the aorta and left ventricular outflow tract (LVOT) using a previously described machine learning approach10. Three-chamber (3C) CDE datasets with a clear appearance of velocity in the LVOT were exported from an ultrasound scanner and reconstructed with MATLAB. A workflow for registering CDE image pixels to 4D flow MRI voxels is illustrated in Figure 1. First, 3C CDE tissue image was manually registered with 3C standard cine-MRI by matching aortic valve leaflet hinge points and a posterior mitral annulus junction point seen in both images (Figure 1A). Second, the cine image was registered with 4D flow MRI by using rigid transformation combined with optimization algorithm in MATLAB. This step was necessary since cine-MRI was acquired at end inspiration. The left ventricle with the aorta in the cine image was segmented and the mask data was used to perform registration with a 3D aorta segmentation mask. A generalized pattern search algorithm11 was implemented to automatically find a location of the global maximum cross-correlation coefficient between the masks (Figure 1B). Then, CDE image pixels were transferred to 4D flow MRI space by using the image transformation matrices obtained after the previous steps. Lastly, 4D flow MRI velocity vectors were interpolated to CDE pixel locations and projected to ultrasound beamlines (Figure 1C) and compared with CDE velocity data. Peak systole was chosen as a reference cardiac phase for comparison. A velocity difference map was constructed in the data overlapping region. Linear regression and Bland-Altman analysis was performed for the velocities in the LVOT.Results
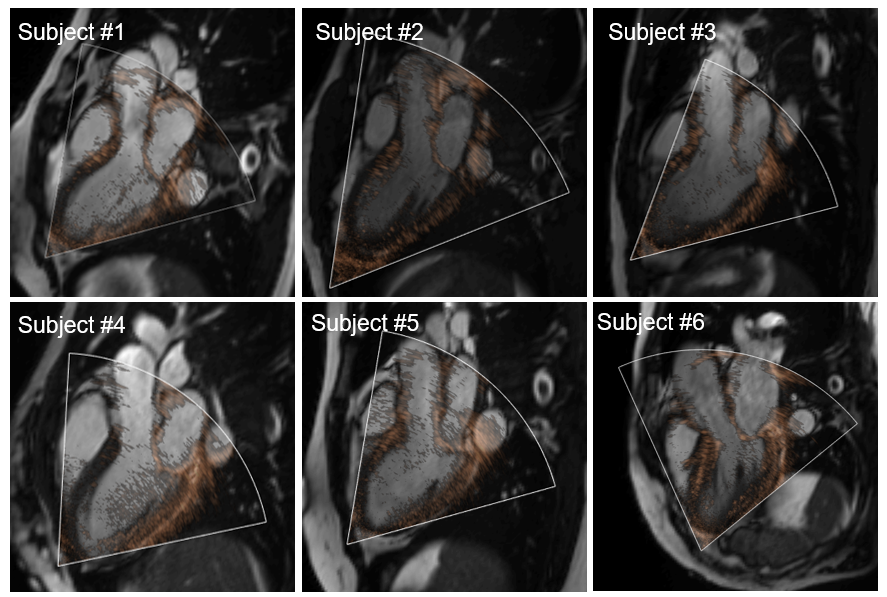
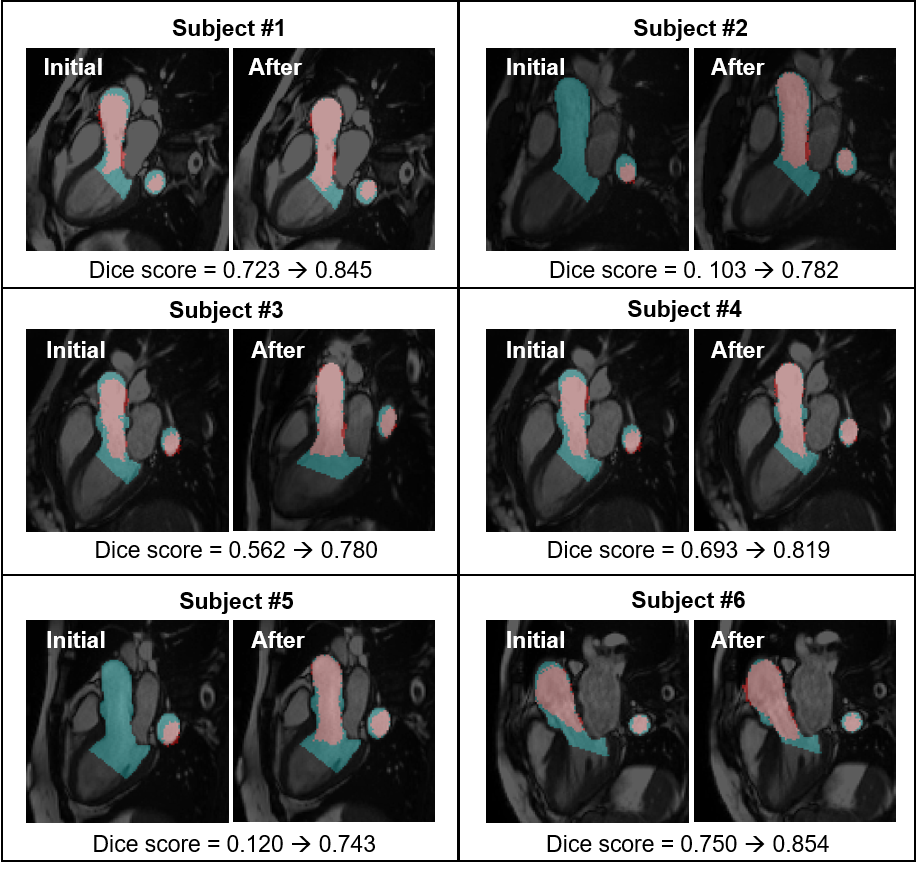
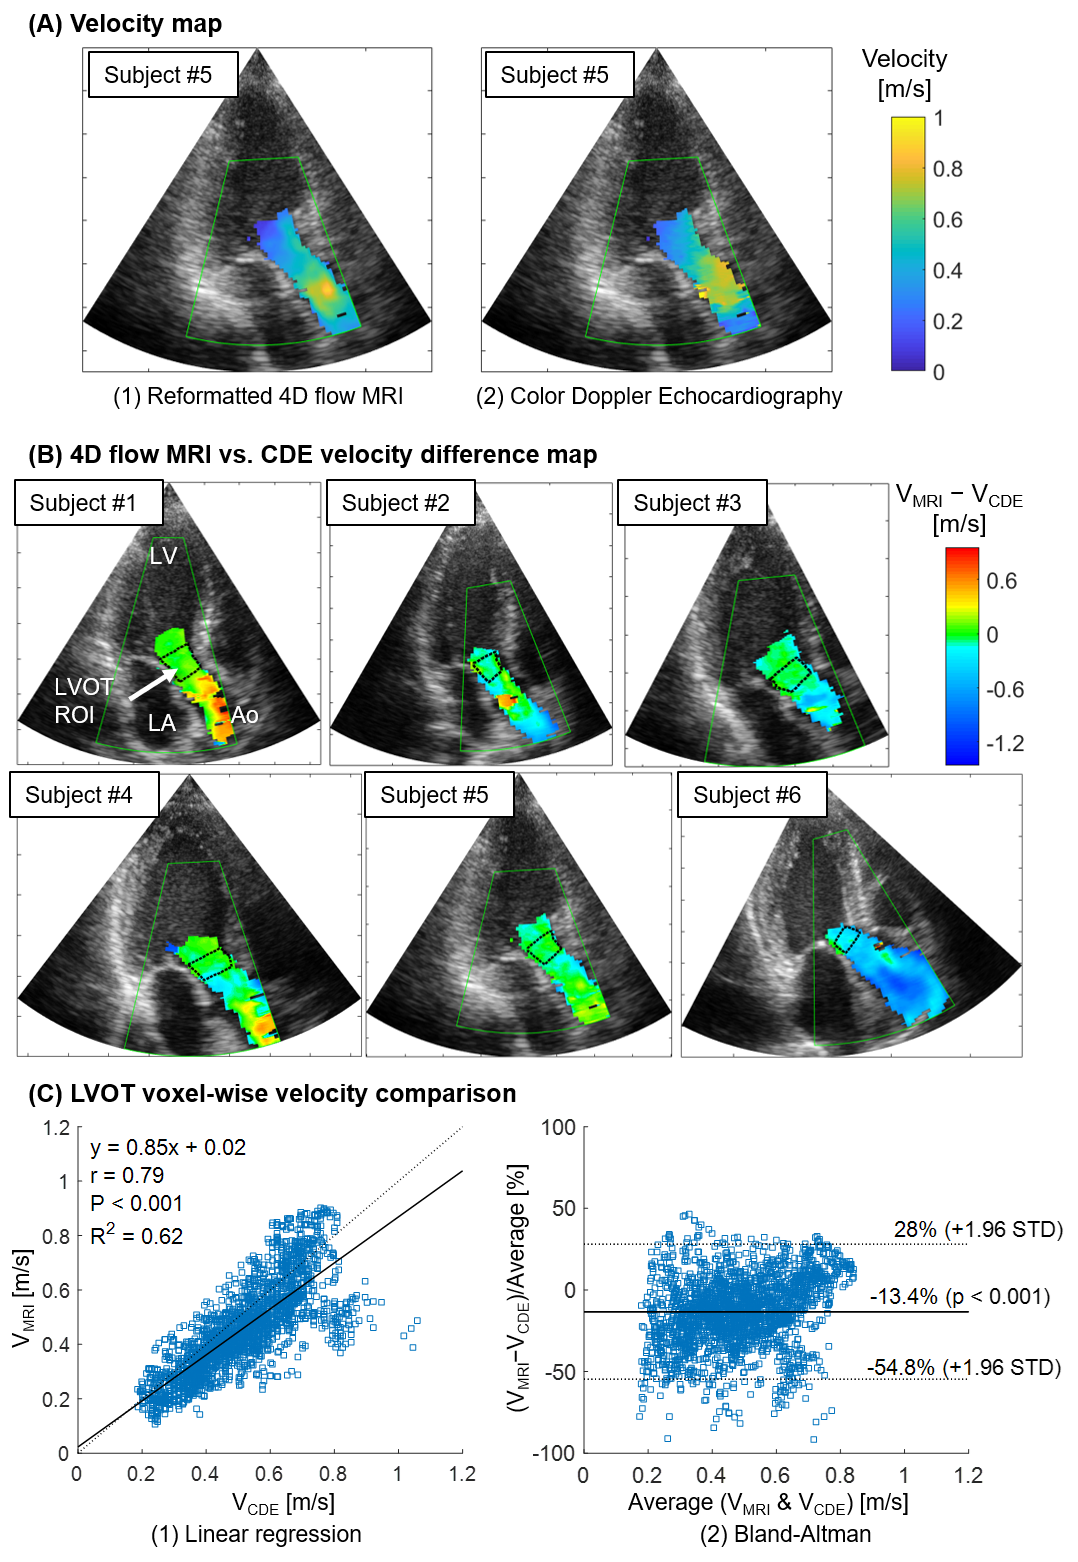
Qualitative inspection of CDE image registered to cine image showed a reasonable overlap of anatomical features such as mitral valve leaflets and aorta wall (Figure 2). Cine to 4D flow MRI registration improved Dice score between the cine segmentation masks and the 3D aorta mask cross-sections (initially 0.49 ± 0.30, after 0.80 ± 0.04, p = 0.035, Figure 3). Figure 4A shows a reformatted 4D flow MRI velocity (VMRI) and a CDE velocity (VCDE) map from a subject who had the best overall velocity resemblance. Figure 4B shows voxel-wise velocity difference maps from all subjects. Large discrepant voxels (|VMRI-VCDE| > 0.6 m/s) were mostly located in the downstream of the aortic valve. There was a strong correlation of velocities in the LVOT (r = 0.79, p < 0.001) with a moderate agreement (bias -13.4% and limits of agreement ± 41.4%).Discussion
The framework proposed in this study enabled the comparison of 4D flow MRI with Doppler echocardiography at the same anatomical location. The constructed velocity difference map was beneficial to assess inter-modal agreement with respect to anatomical locations. We confirmed that both modalities provide comparable velocities in the LVOT where velocities are relatively uniform and well-aligned with each other. On the contrary, two modalities seem to disagree when the flow is disturbed by anatomical structures as seen by the presence of large discrepant voxels near and behind the aortic valve. However, this study is limited by the number of subjects (n=6) and the absence of patients. Future work will focus on a larger cohort including patients with aortic valve diseases.Conclusion
We developed a novel framework that integrates 4D flow MRI and CDE and investigated voxel-wise velocity inter-modal agreement in LVOT. The framework is able to generate a velocity difference map superimposed onto a tissue image and this data can provide useful information to better understand the regional reliability of both modalities.Acknowledgements
No acknowledgement found.References
1. Van Ooij P, Potters WV, Nederveen AJ, Allen BD, Collins J, Carr J, Malaisrie SC, Markl M and Barker AJ. A methodology to detect abnormal relative wall shear stress on the full surface of the thoracic aorta using four‐dimensional flow MRI. Magnetic resonance in medicine. 2015;73:1216-1227.
2. Mahadevia R, Barker AJ, Schnell S, Entezari P, Kansal P, Fedak PW, Malaisrie SC, McCarthy P, Collins J and Carr J. Bicuspid aortic cusp fusion morphology alters aortic three-dimensional outflow patterns, wall shear stress, and expression of aortopathy. Circulation. 2014;129:673-682.
3. Barker AJ, van Ooij P, Bandi K, Garcia J, Albaghdadi M, McCarthy P, Bonow RO, Carr J, Collins J and Malaisrie SC. Viscous energy loss in the presence of abnormal aortic flow. Magnetic resonance in medicine. 2014;72:620-628.
4. Gabbour M, Schnell S, Jarvis K, Robinson JD, Markl M and Rigsby CK. 4-D flow magnetic resonance imaging: blood flow quantification compared to 2-D phase-contrast magnetic resonance imaging and Doppler echocardiography. Pediatric radiology. 2015;45:804-813.
5. Harloff A, Albrecht F, Spreer J, Stalder A, Bock J, Frydrychowicz A, Schöllhorn J, Hetzel A, Schumacher M and Hennig J. 3D blood flow characteristics in the carotid artery bifurcation assessed by flow‐sensitive 4D MRI at 3T. Magnetic Resonance in Medicine: An Official Journal of the International Society for Magnetic Resonance in Medicine. 2009;61:65-74.
6. Huh H, Kinno M, Thomas JD, Markl M and Barker AJ. Estimation of aortic valve effective orifice area: a same day comparison between Doppler echocardiography and 4D flow MRI. International Society for Magnetic Resonance in Medicine. 2018.
7. Markl M, Lee DC, Furiasse N, Carr M, Foucar C, Ng J, Carr J and Goldberger JJ. Left atrial and left atrial appendage 4D blood flow dynamics in atrial fibrillation. Circulation: Cardiovascular Imaging. 2016;9:e004984.
8. Rose MJ, Jarvis K, Chowdhary V, Barker AJ, Allen BD, Robinson JD, Markl M, Rigsby CK and Schnell S. Efficient method for volumetric assessment of peak blood flow velocity using 4D flow MRI. Journal of Magnetic Resonance Imaging. 2016;44:1673-1682.
9. Walker PG, Cranney GB, Scheidegger MB, Waseleski G, Pohost GM and Yoganathan AP. Semiautomated method for noise reduction and background phase error correction in MR phase velocity data. Journal of Magnetic Resonance Imaging. 1993;3:521-530.
10. Berhane H, Scott M, Robinson JD, Rigsby CK and Markl M. 3D U-Net for Automated Segmentation of the Thoracic Aorta in 4D-Flow derived 3D PC-MRA. International Society for Magnetic Resonance in Medicine. 2019.
11. Audet C and Dennis Jr JE. Analysis of generalized pattern searches. SIAM Journal on optimization. 2002;13:889-903.
Figures