2268
Method for Comprehensive Analysis of Vascular Geometry and Fluid Dynamics Using MRI1Department of Congenital Heart Disease and Pediatric Cardiology, University Hospital Schleswig-Holstein, Kiel, Germany, 2The Edwards Lifesciences Center for Advanced Cardiovascular Technology, University of California, Irvine, CA, United States, 3Harvard Medical School, Brigham and Women’s Hospital, Boston, MA, United States, 4Department of Radiology and Nuclear Medicine, University Hospital Schleswig-Holstein, Lübeck, Germany
Synopsis
Many secondary flow patterns in the large vessels have been shown to represent significant pathophysiological phenomena. However, the computational cost to analyze a large number of quantities usually discourage the use of these parameters for clinical decision making given the limited computing resources in clinical settings. We describe a novel postprocessing method for comprehensive analysis of vascular anatomy and fluid dynamics based on 4D Flow MRI. The method defines a multi-dimensional feature space built from a few complementary fluid dynamics building blocks to efficiently determine a large number of anatomic and fluid dynamics parameters in the course of a vessel.
INTRODUCTION
As an advancement of 2D phase contrast techniques,1 four-dimensional phase contrast (4D Flow) MRI has emerged as a rich source for assessment of fluid dynamics and anatomic information.2-4 Post-processing of 4D Flow MRI has led to several quantitative indices to describe the complex fluid dynamics of the aorta and pulmonary artery. Turbulences, helical flow patterns, eccentricity and other secondary flow patterns have been shown to represent significant pathophysiological phenomena.5-11 Assessment of cardiovascular fluid dynamics can benefit from postprocessing techniques that comprehensively analyze 4D Flow MRI together with other conventional and routine measures. However, the computational cost to analyze a large number of quantities usually discourage the use of these parameters for clinical decision making given the limited computing resources in clinical settings. Thus, a method that can attain as many fluid dynamics and anatomic characteristics at a relatively low computing cost could be highly desirable. These parameters, alone or combined together, can be ideally used to improve clinical diagnosis and may ultimately promote 4D Flow MRI to become an integral part of clinical routines. Here we describe a novel postprocessing method for comprehensive analysis of vascular anatomy and fluid dynamics based on 4D Flow MRI. The method defines a multi-dimensional feature space built from a few complementary fluid dynamics building blocks to efficiently determine a large number of anatomic and fluid dynamics parameters in the course of a vessel.METHODS
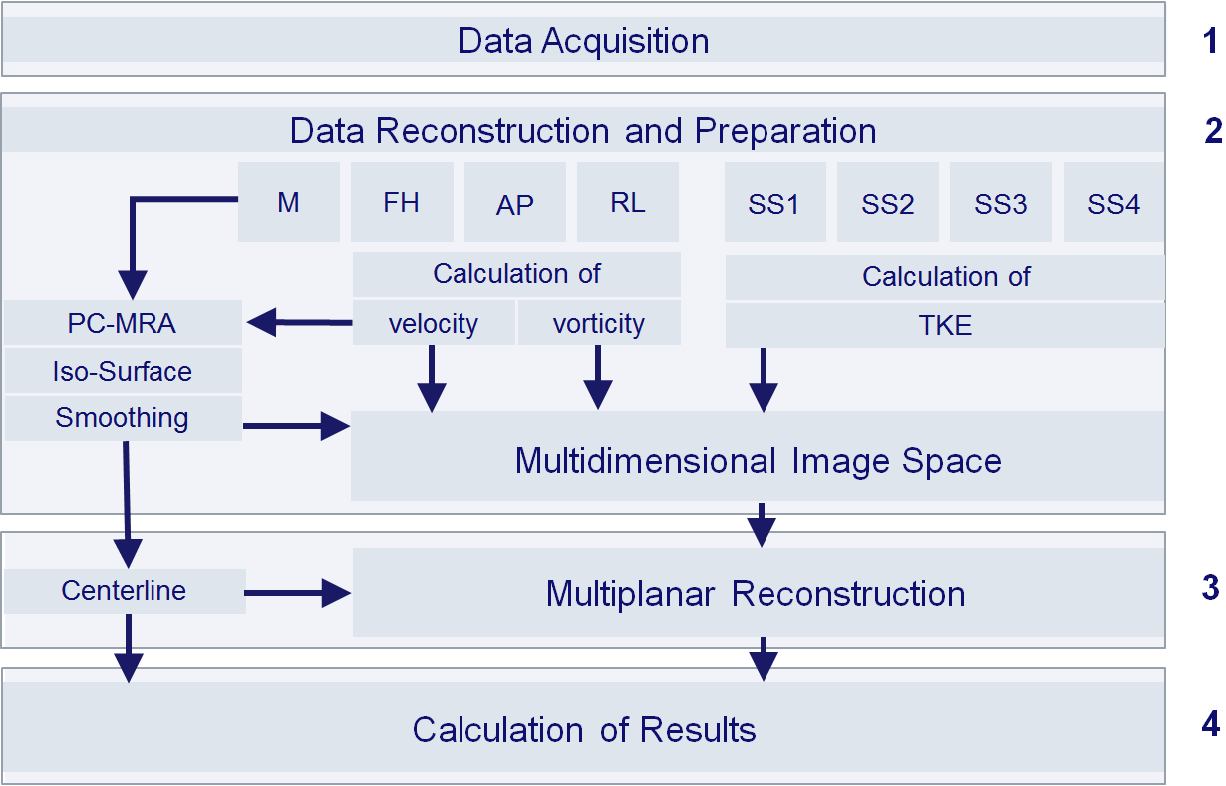
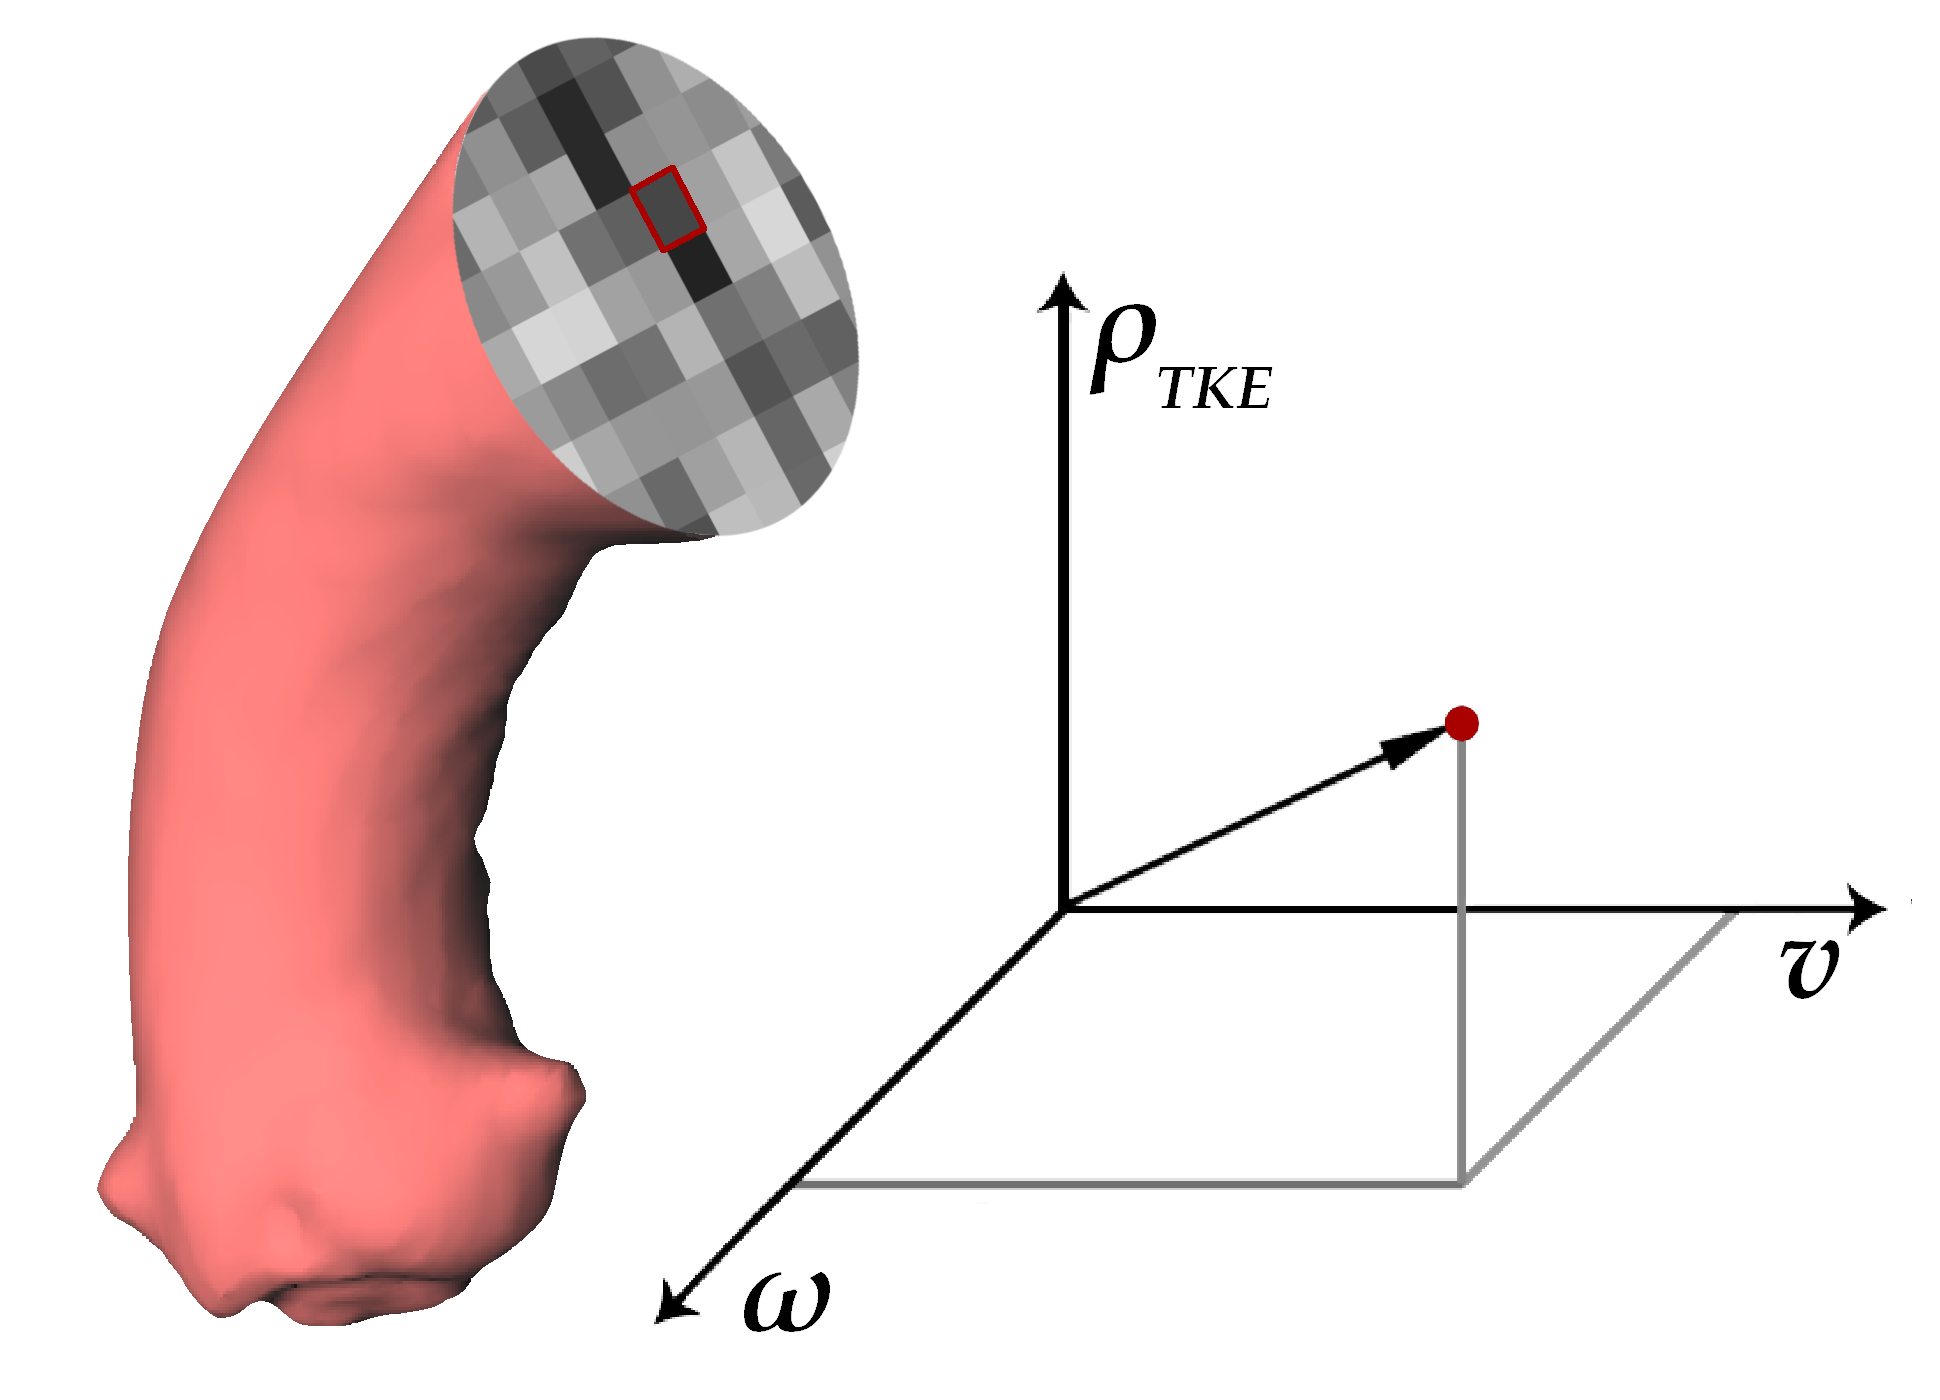
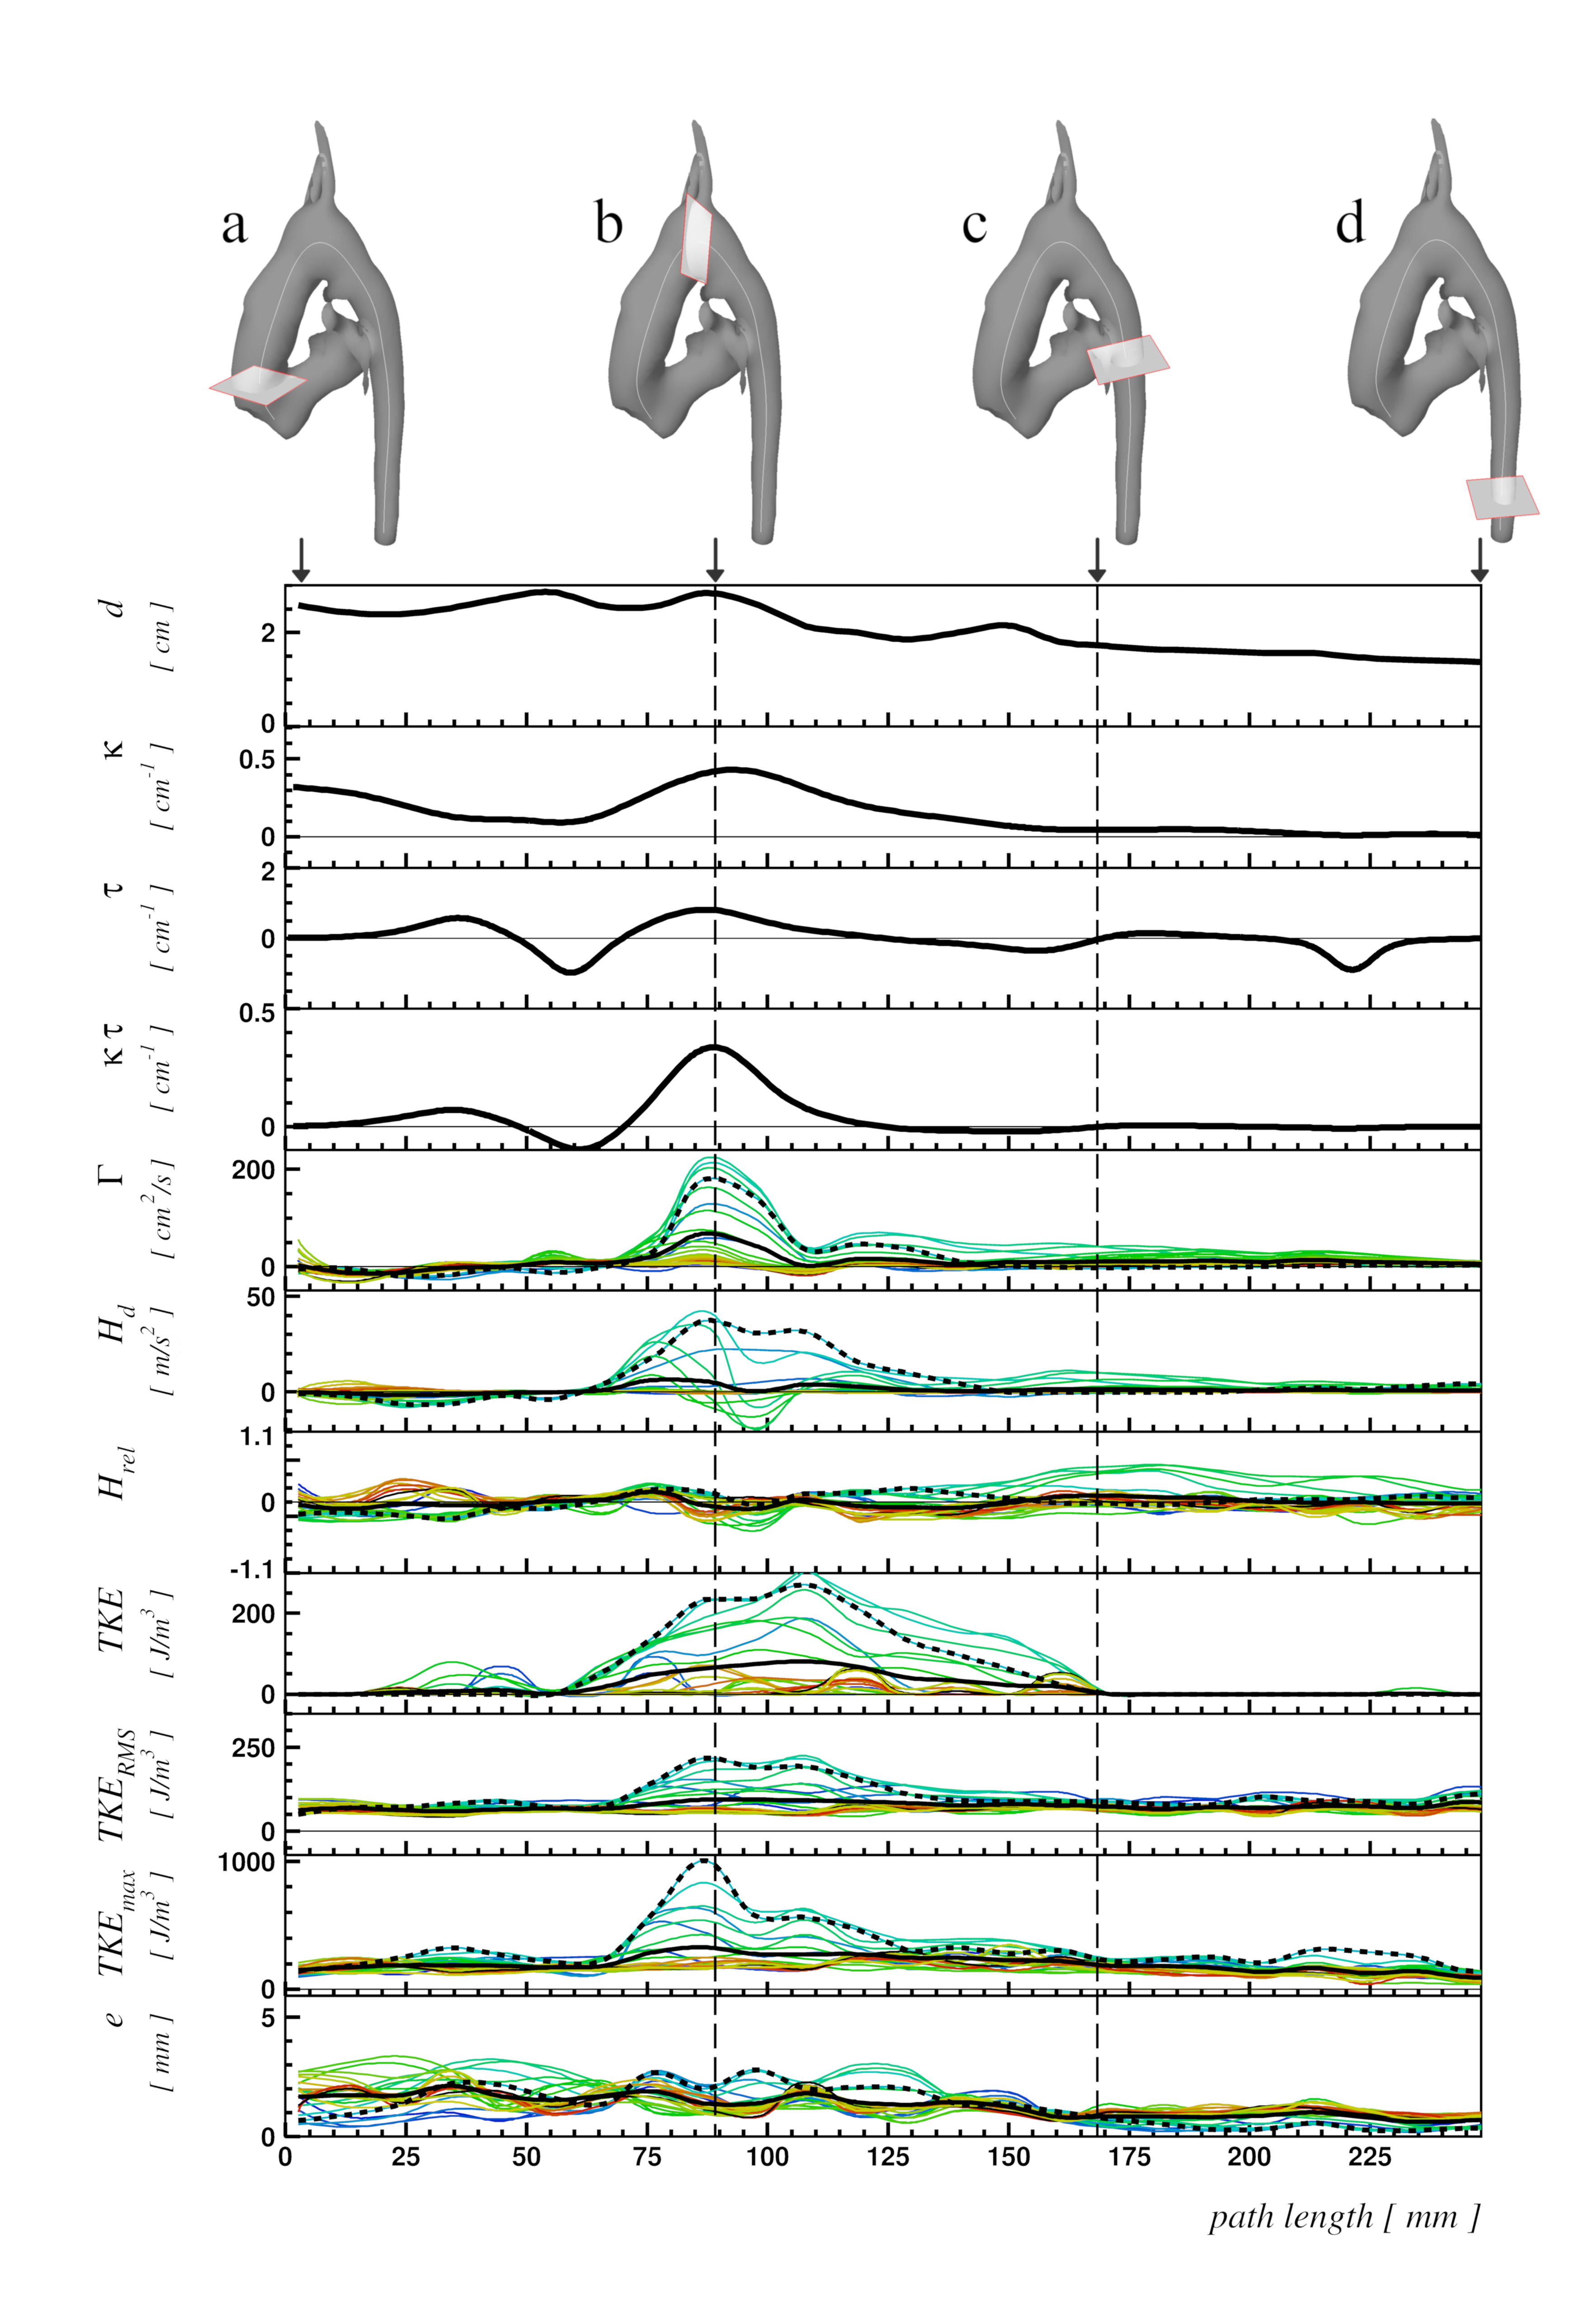
The method works based on acquisition of 4D Flow MRI according to common guidelines12 and reconstruction of four datasets with magnitude data, one with velocity-compensation (SS1) and three datasets with velocity encoding along the three spatial directions (SS2, SS3, SS4), as well as three datasets for phase contrast data with velocity-encoding along the three spatial directions (FH, AP, RL). The approach involves a multiplanar reconstruction (MPR) of a multi-dimensional feature space along the vessel’s centerline. The feature space is built from velocity (3-dimenional), vorticity (3-dimensional) and turbulent kinetic energy density (1-dimensional). Anatomical landmarks are placed at the vessel’s center based on anatomic slice images (magnitude). The curved vessel centerline is defined as the natural cubic spline through the landmarks. A curved MPR13 of the feature space is performed in perpendicular planes intermittently along the vessel’s centerline. The MPR resampling is limited to the vessel volume determined by a phase contrast magnetic resonance angiography (PC-MRA).Results are calculated from the feature space data of the resampled MPR planes and centerline. As an important byproduct of the MPR, the centerline is used as source of geometric information about the vessel. Fluid-dynamics quantities, i.e., circulation Γ, helicity density Hd, relative helicity density Hrel, turbulent kinetic energy density TKE, peak and root mean square turbulent kinetic energy density (TKEmax, TKERMS) and eccentric flow displacement e are determined in-plane from the reconstructed feature space associated with the equivalent vessel diameter d, curvature κ, torsion τ and effective torsion κ∙τ.14-16,9 The method provides all quantities systematically as functions of the longitudinal position along the vessel. The flow diagram of the method is shown in Figure 1. To show its performance, the method was applied to a pathologically shaped neo-aorta in a patient with hypoplastic left-heart syndrome in Fontan circulation.
RESULTS
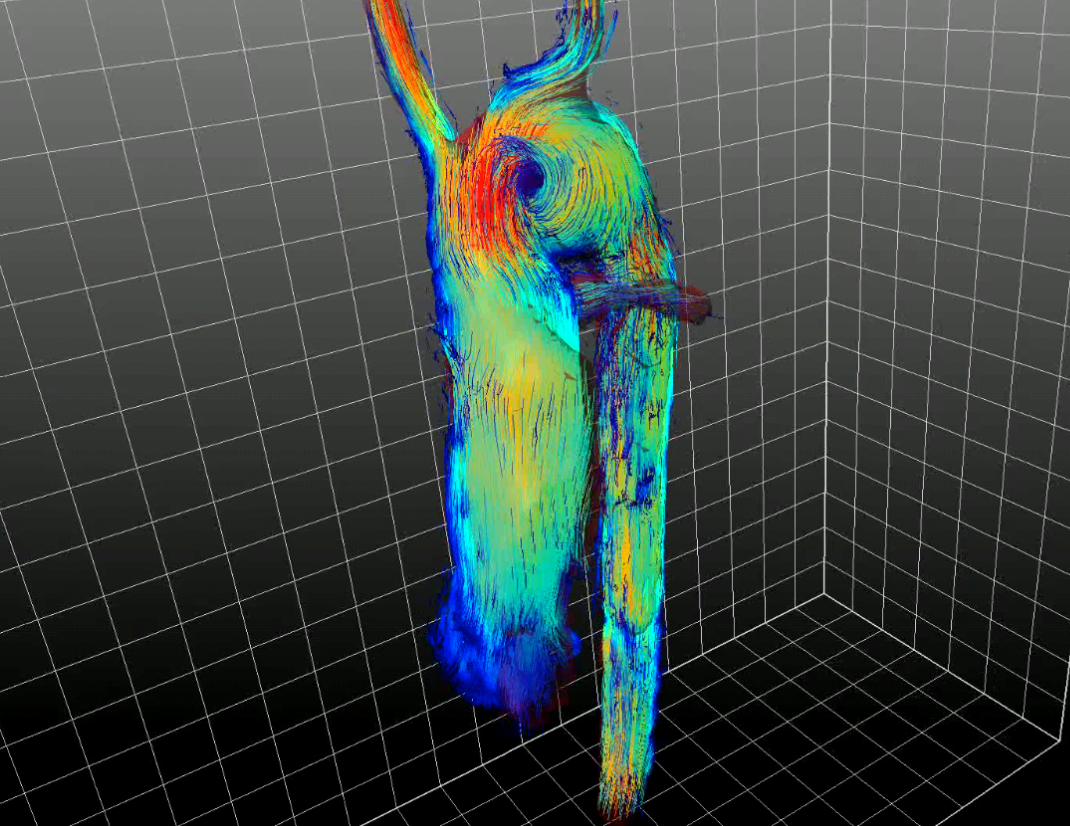
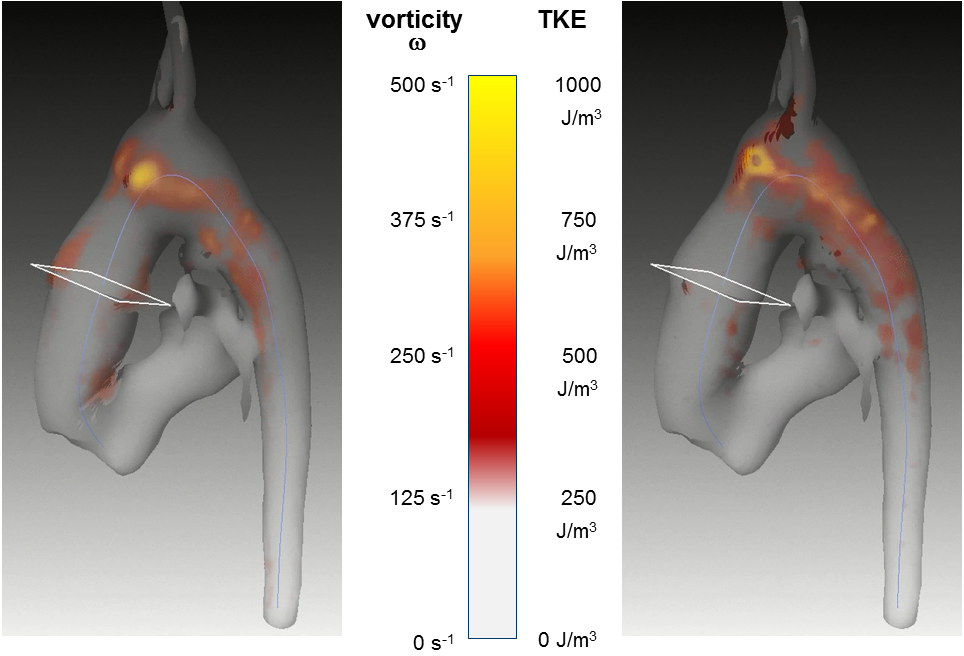
Segmentation and centerline of the patient’s neo aorta exhibited a strong kinking which was associated with a prominent vortex (Figures 3, 4). Regions of high vorticity were related to regions of high TKE, as visualized in Figure 4. Quantitative results on anatomic and fluid dynamics parameters as functions of longitudinal position and time frame are shown in Figure 5. The position of the aortic arch corresponds to the region of maximum curvature and effective torsion. In this region, circulation, helicity density, TKE, TKEmax and TKERMS reached maximal values while the relative helicity density and flow displacement show no apparent association to the curvilinearity of the aortic arch.DISCUSSION
Multiple studies have established the physiological impact of secondary flow patterns.5-11 However, the parameters quantifying the secondary flow patterns in blood vessels have not been well integrated in a unified analysis scheme to allow a comprehensive and profound diagnostic assessment. Based on the known technique of curved multiplanar reconstruction13 and using a vessel centerline, we describe a method for computation of a number of secondary fluid dynamics parameters from the multiplanar reconstruction of three complementary building blocks: velocity, IVSD and vorticity. This method allows for an efficient use of computing power. The geometric distortion due to vessel curvature prevents Euclidean calculation of vorticity from velocity after MPR. Therefore, vorticity is calculated before MPR. The method presented in this work applies the known technique of curved MPR to a specially-designed multi-dimensional feature space and jointly uses the centerline for both MPR and quantification of curvilinearity, to facilitate analyses involving fluid dynamics and geometric quantification.CONCLUSION
We describe a novel method for efficient analysis of vascular fluid dynamics and anatomy, which allows to systematically quantify a large number of fluid dynamics and anatomic parameters to be used for clinical decision making. We showed the method’s performance using a test case to reveal inter-dependencies between local geometric and fluid dynamics parameters along a vessel path.Acknowledgements
No acknowledgement found.References
1. O'Donnell M. NMR blood flow imaging using multiecho, phase contrast sequences. Med Phys 1985;12:59-64.
2. Markl M, Chan FP, Alley MT et al. Time-resolved three-dimensional phase-contrast MRI. J Magn Reson Imaging 2003;17:499-506. Erratum in: J Magn Reson Imaging 2003;18:396.
3. Markl M, Frydrychowicz A, Kozerke S, Hope M, Wieben O. 4D flow MRI. J Magn Reson Imaging 2012;36:1015-1036.
4. Sträter A, Huber A, Rudolph J, Berndt M, Rasper M, Rummeny EJ, Nadjiri J. 4D-Flow MRI: Technique and Applications. Rofo 2018;190:1025-1035.
5. Liu X, Sun A, Fan Y, Deng X. Physiological significance of helical flow in the arterial system and its potential clinical applications. Ann Biomed Eng 2015;43:3-15.
6. Ha H, Ziegler M, Welander M et al. Age-Related Vascular Changes Affect Turbulence in Aortic Blood Flow. Front Physiol 2018;9:36-45.
7 Ha H, Kim GB, Kweon J et al. Turbulent Kinetic Energy Measurement Using Phase Contrast MRI for Estimating the Post-Stenotic Pressure Drop: In Vitro Validation and Clinical Application. PLoS One. 2016;11:e0151540.
8. Ge L, Lassab GS. Turbulence in the Cardiovascular System: Aortic Aneurysm as an Illustrative Example. Berlin Heidelberg: Springer-Verlag 2009. 319 p.
9. Sigovan M, Hope MD, Dyverfeldt P, Saloner D. Comparison of four-dimensional flow parameters for quantification of flow eccentricity in the ascending aorta. J Magn Reson Imaging 2011;34:1226-1230.
10. Ayaon-Albarran A, Fernandez-Jimenez R, Silva-Guisasola J, Agüero J, Sanchez-Gonzalez J, Galan-Arriola C, Reguillo-Lacruz F, Maroto Castellanos LC, Ibanez B. Systolic flow displacement using 3D magnetic resonance imaging in an experimental model of ascending aorta aneurysm: impact of rheological factors. Eur J Cardiothorac Surg 2016;50:685-692.
11. Rickers C, Kheradvar A, Sievers HH et al. Is the Lecompte technique the last word on transposition of the great arteries repair for all patients? A magnetic resonance imaging study including a spiral technique two decades postoperatively. Interact Cardiovasc Thorac Surg 2016; 22:817-825.
12. Dyverfeldt P, Bissell M, Barker AJ et al. 4D flow cardiovascular magnetic resonance consensus statement. J Cardiovasc Magn Reson 2015;17:72-90.
13. Rubin GD, Napel S, Leung AN. Volumetric analysis of volumetric data: achieving a paradigm shift. Radiology. 1996 Aug;200(2):312-7.
14. Lorenz R, Bock J, Barker AJ, von Knobelsdorff-Brenkenhoff F, Wallis W, Korvink JG, Bissell MM, Schulz-Menger J, Markl M. 4D flow magnetic resonance imaging in bicuspid aortic valve disease demonstrates altered distribution of aortic blood flow helicity. Magn Reson Med 2014 ;71:1542-1553.
15. Dyverfeldt P, Sigfridsson A, Kvitting JP, Ebbers T. Quantification of intravoxel velocity standard deviation and turbulence intensity by generalizing phase-contrast MRI. Magn Reson Med; 56:850-858. Erratum in: Magn Reson Med 2007;57:233.
16. Dyverfeldt P, Kvitting JP, Sigfridsson A, Engvall J, Bolger AF, Ebbers T. Assessment of fluctuating velocities in disturbed cardiovascular blood flow: in vivo feasibility of generalized phase-contrast MRI. J Magn Reson Imaging 2008;28:655-663.
Figures