2263
Energy loss assessed with 4D-Flow for the normal subjects and patients with an abdominal aortic aneurysm pre and post endovascular aortic repair1Department of Radiological Technology, Nagoya University Hospital, Nagoya, Japan, 2Department of Fundamental Development of Low Invasive Diagnostic Imaging, Nagoya University Graduate School of Medicine, Nagoya, Japan, 3Department of Radiology, Nagoya University Graduate School of Medicine, Nagoya, Japan, 4Brain & Mind Research Center, Nagoya University, Nagoya, Japan, 5Trust Clinic, Nagoya, Japan, 6GE Healthcare Japan, Tokyo, Japan
Synopsis
We analyzed energy loss in normal subjects, patients in pre- and post- endovascular aortic repair. Patients had vortices in dilated flow path in pretreatment and tortuous high-velocity streamlines in posttreatment. Energy loss of posttreatment was higher than that of pretreatment. Energy loss would be affected most effectively by the change of the flow direction.
Introduction
4D flow MR imaging allows depictions of the blood flow1, and various hemodynamic biomarkers have been proposed based on the data. Energy loss (EL), one of the parameters derived from 4D-Flow, has been researched to characterize the abnormal flow2. A previous paper has reported that EL may be a predictor of aneurysmal rupture in the anterior communicating artery3. However, the research of EL for the abdominal vessels has been sparse. This study aimed to establish the EL values in the normal aorta and AAA pre-endovascular aortic repair (EVAR) as well as post-EVAR using 4D-Flow.Methods
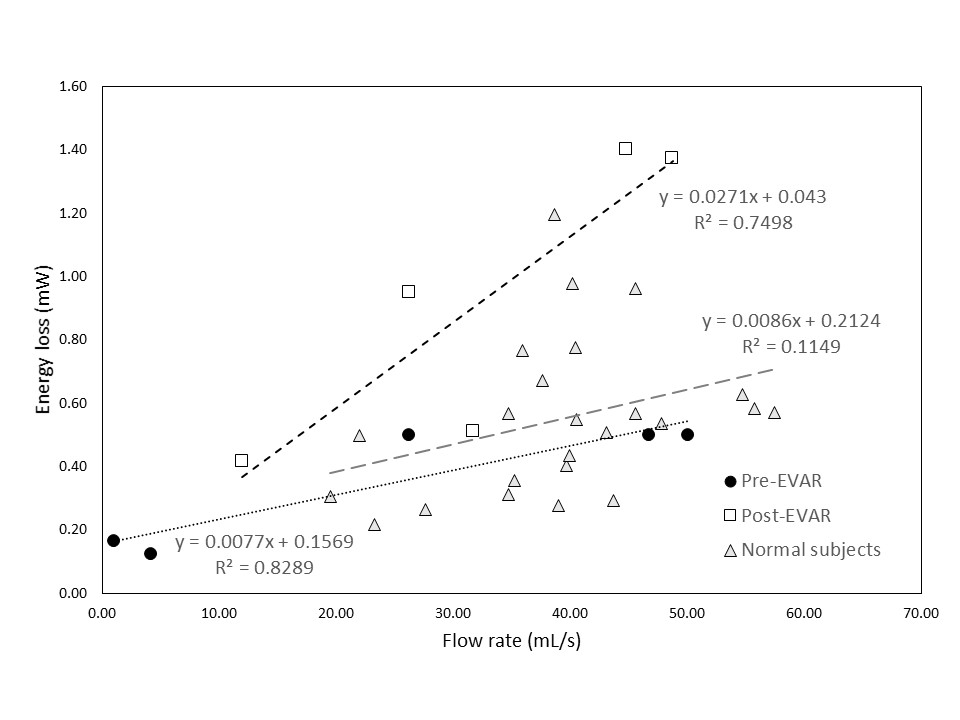
Twenty-four normal subjects (mean age; 51.2, sex; 24 male) underwent MR imaging including non-contrast 4D-Flow, and five patients with abdominal aortic aneurysms (mean age; 78.6, sex; 4 male) underwent contrast-enhanced MRI including 4D-Flow before and after EVAR. 3D streamline and EL was assessed with use of flow analysis software iTFlow (Cardioflow design, Co. Ltd.). EL was measured for the segments from the level of the renal artery to the common iliac arteries at the bifurcation of the internal and external iliac arteries. EL was calculated based on the following equation4 $$ EL=\sum_{ij}\int_{}^{}\frac{1}{2}\mu(\frac{\partial U_{i}}{\partial x_{j}}+\frac{\partial U_{j}}{\partial x_{i}})^{2}dV$$ Where is the viscosity of the blood ( = 0.004 Pa*s). The flow rate of the abdominal aorta was also measured at the proximal portion of the abdominal aorta to see the relationship with EL. The scattergram was plotted to show the relationships between EL and the flow rate in the subdivided groups of normal, AAA pre-EVAR and post-EVAR. Linear regression analysis was applied to see the correlations between the EL and the flow rate between pre-EVAR and post-EVAR.Results
The pre-EVAR AAA had vortices in the aneurysm, both in systole and early diastole (Fig.1). The post-EVAR AAA also had a few vortices in early diastole within the stent as well as high-velocity tortuous flow in systole. There was a weak correlation between EL and the flow rate in the abdominal aorta of the normal subject (r2=0.115), higher relationships for the AAA pre-EVAR (r2=0.839), and post-EVAR (r2=0.750)(Fig.2). EL of post-EVAR tended to be higher than that of pre-EVAR (Fig.3).Discussion
We hypothesized that normalization of the flow path in AAA after EVAR would reduce the EL; however, the result was opposite. Considering the strong correlations between EL and the flow rate, increased flow rate due to less compliant flow path after EVAR was responsible for the increase of EL. Change of the magnitude of the velocity and local alterations of the flow direction increased the EL of AAA. Although less frequent vortices formation in post-EVAR suggested apparent improvement of EL after EVAR, the streamlines in post-EVAR revealed high-velocity flow in the tortuous flow path as compared to normal subjects. In normal subjects, compliant vessels without tortuosity or dilatations caused minimal changes on the local flow directions, which resulted in weak correlations between EL and flow rate.Conclusion
EVAR did not improve EL probably because of the increased flow rate due to less compliant flow path as well as the added tortuosity. Unlike pathological aorta, normal aorta revealed marginal correlation between the flow rate and EL probably reflecting undilated flow path and more compliant vessel wall.Acknowledgements
No acknowledgement found.References
1. Markl M, Chan FP, Alley MT, et al. Time-resolved three-dimensional phase-contrast MRI. J Magn reson Imaging. 2003; 17 (4): 499-506
2. Barker AJ, van Ooji P, Bandi K, et al. Viscous energy loss in the presence of abnormal aortic flow. Magn Reson Med. 2014; 72 (3): 620-8 3.
3. Peng Hu, Yi Qian, Chong-Joon Lee, et al. The energy loss may predict rupture risks of anterior communicating aneurysms: a preliminary result. Int J Clin Exp Med 2015; 8 (3): 4128-4133.
4. Itatani K, Okada T, Uefima T, et al. Intraventricular Flow Velocity Vector Visualization Based on the Continuity Equation and Measurements of Vorticity and Wall Shear Stress, Japanese Jounal of Applied Physics. 2013; 52 (7S): 08HF16 1-6.
Figures