2262
Feasibility of a Free-Breathing 2D Phase Contrast Sequence for Aortic Pulse Wave Velocity Measurements1Medical Physics, University of Wisconsin - Madison, Madison, WI, United States, 2Radiology, University of Wisconsin - Madison, Madison, WI, United States, 3Medicine, University of Wisconsin - Madison, Madison, WI, United States
Synopsis
Pulse wave velocity (PWV) is a biomarker that indirectly relates to arterial stiffness, an early indicator of cardiovascular disease. Breath-hold phase contrast (PC) MRI can be used to assess PWV in the aorta, however in certain populations, breath-holds may be difficult. We present a method to measure aortic PWV using a free-breathing radially-undersampled PC sequence. Initial results show that the free-breathing PC-derived PWV measures are comparable to the measures obtained from breath-hold Cartesian PC scans. Larger cohorts are warranted to verify these findings.
Introduction
Pulse wave velocity (PWV) is the rate at which pulse pressure propagates through a vessel. PWV is clinically important because it indirectly measures arterial stiffness, which is an early manifestation of vessel wall remodeling from cardiovascular disease occurring well before luminal narrowing1. Developing biomarkers to detect early vascular disease is clinically desirable for potential therapeutic intervention. 2D cine phase-contrast (PC) MRI has been successfully used to non-invasively determine aortic PWV by measuring temporal shifts (Δt) in flow waveforms between imaging planes and calculating the aortic centerline distance (Δx) between the planes2, hence PWV=Δx/Δt. When imaging the aorta, respiratory motion is avoided by performing breath-hold (BH) exams (~10-15 seconds). However, in certain patient populations, BHs may be difficult. Radially-undersampled MR sequences offer flexible tradeoffs for spatial/temporal resolution and in retrospective physiological gating, as well as decreased motion artifacts due to oversampling of central k-space. The aim of this work is to assess the feasibility of a free-breathing (FB) 2D radially-undersampled PC sequence by comparing PWV measures to a standard Cartesian 2D PC BH sequence.Methods
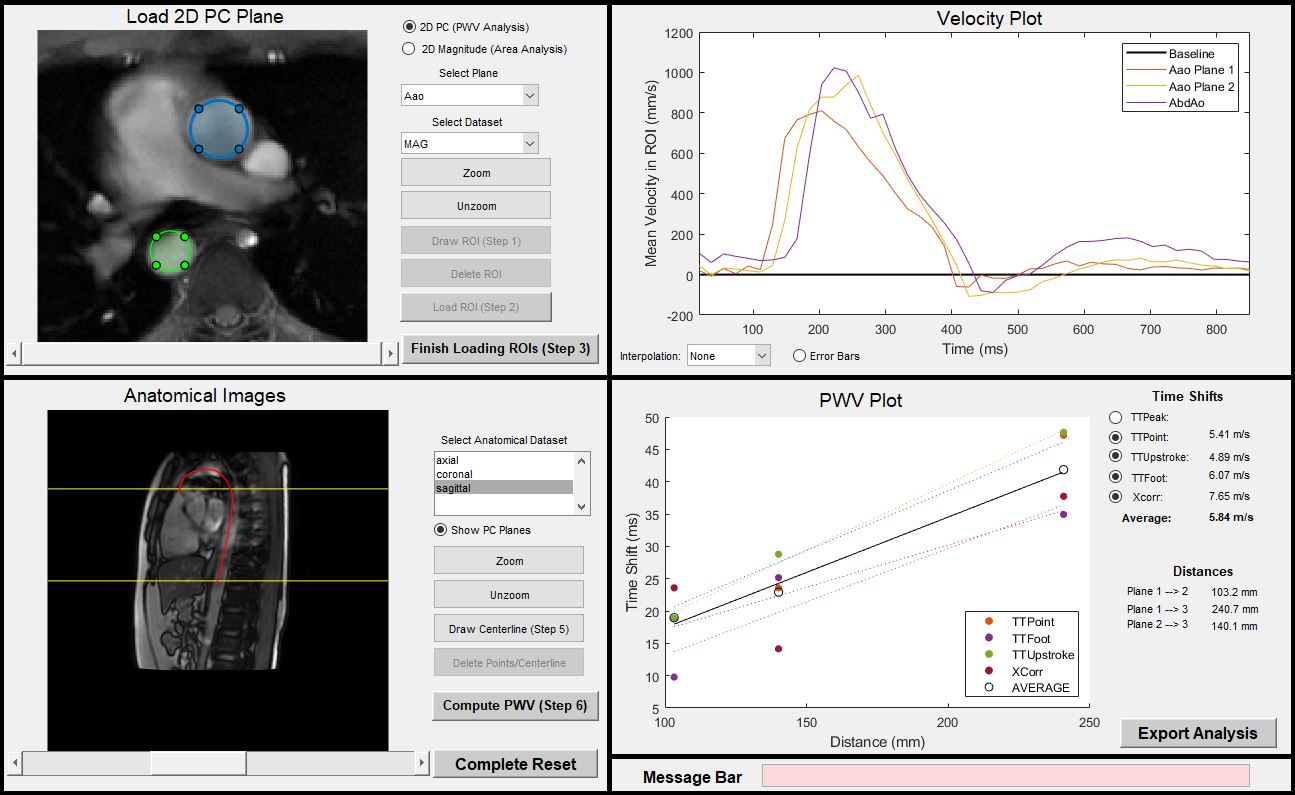
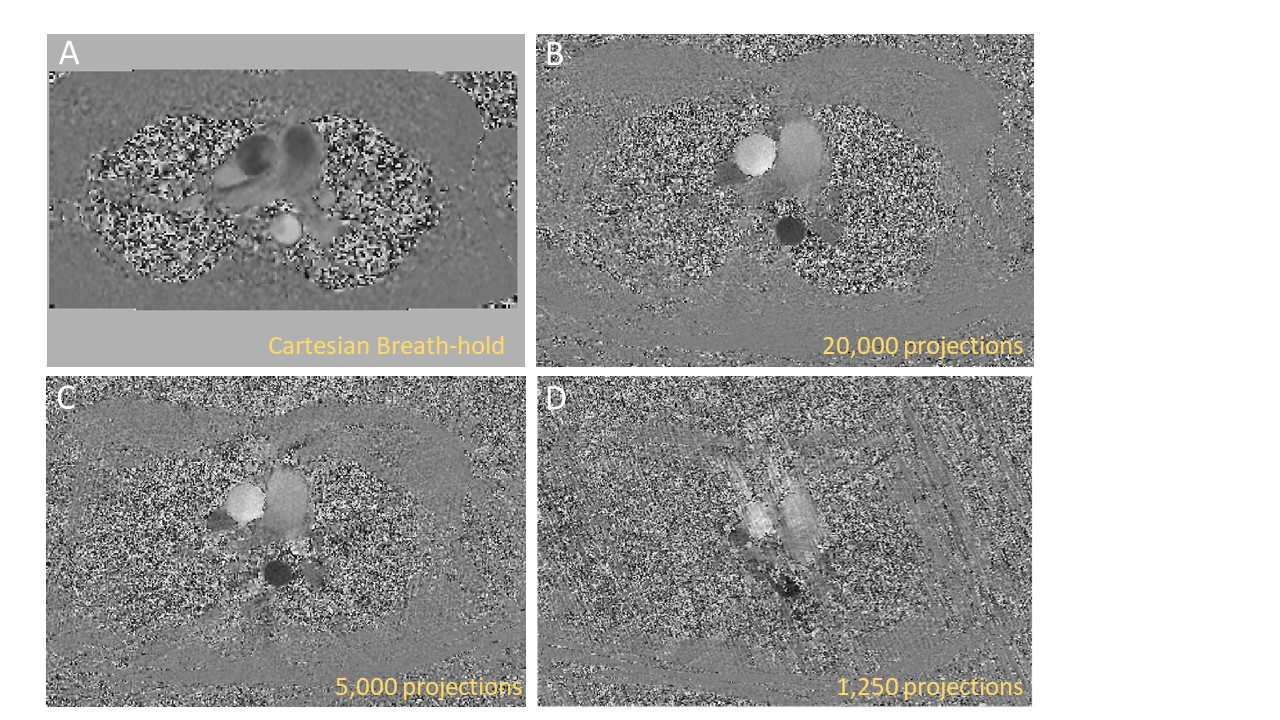
Six healthy subjects (3F/3M, mean age=33y) were scanned with both a radially-undersampled FB PCVIPR3 sequence and a Cartesian BH product sequence at 3T (Signa Premier, GE Healthcare, Waukesha, WI) using a 30-channel anterior AIR™ coil and 60-channel posterior array. For both sequences, two axial planes were prescribed in the aorta: one in the aortic arch and the second in the abdominal aorta (Figure 1). Additionally, ungated free-breathing FIESTA images were acquired to manually draw centerlines for distance calculations. 2D PC Cartesian scans were acquired with prospective peripheral pulse-oximeter (PG) gating : scan time=10-13s (breath-hold); TR=5ms; TE=3ms; flip=25˚;Venc=1500cm/s; cardiac frames=40; temporal res.=41ms. 2D radial PCVIPR scans were acquired with retrospective PG and retrospective respiratory gating: scan time=4:54; projections=20,000; TR=7ms; TE=4ms; flip=25˚; VENC=1500; golden-angle sampling; reconstructed frames=40; temporal res.=22-39ms (depending on heart-rate). To determine the minimal number of projections needed, the radial PCVIPR scans were subsampled to 15000, 10000, 5000, 2500, and 1250 projections (corresponding to 3:41, 2:27, 1:14, 0:37, 0:18, and 0:09s scan times).A customized GUI in MATLAB (Mathworks, Natick, MA) was developed in order to process the PC data (Figure 2). From the first PC plane in the aortic arch, both ascending and descending aorta were transected (Figure 1A) thus providing two ROI data measurements. Circular ROIs were drawn around each vessel and flow waveforms were constructed over all time frames. The waveforms were further smoothed with a Gaussian filter (width 7 pixels) to decrease velocity noise, as shown in Figure 4. Centerlines were calculated from the anatomical FIESTA images by manually placing seed points in the aorta over multiple image slices and fitting the points to a 3D b-spline (Figure 2B). Centerlines and ROI locations were kept consistent over each subprojection group. Time-to-foot (TTF)4, time-to-upstroke (TTU)5, time-to-point (TTPoint)6, and cross-correlation (Xcorr)7 methods were used to calculate time shifts in flow waveforms. Measured time shifts for each method were plotted against measured centerline distances between planes and linear regression was used to fit the 3 data points (Figure 1, bottom right) where the inverse of the fitted slope is the PWV. The slopes of each regression were averaged to create a composite PWV measure for each individual. PWVs for each radial sub-sampling dataset were compared to the PWV measures from the BH Cartesian scans using a paired Student’s t-test, with p<0.05 signifying statistical significance. Data was checked to ensure the entire waveform was visible and not clipped by the pulse-oximeter lag.
Results
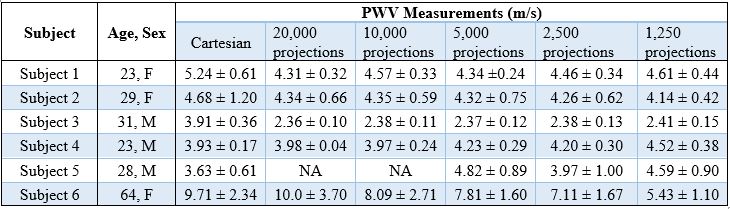
Four of the six subjects were successfully scanned with 2 radial and 2 Cartesian PC scans in the aortic arch and abdominal aorta. One subject was scanned with only 5,000 projections; the other subject was scanned with only 1 plane through the aortic arch, both due to scanner acquisition errors. Table 1 shows composite PWV measures obtained from linear regression of the 3 ROI data points. None of the subsampled projection groups were significantly different from the Cartesian PWV, however, there was an observed bias between the Cartesian and radial acquisitions in some subjects (for example, Subject 3) even when compared to heavily oversampled radial datasets. Image quality was greatly diminished below 5,000 projections, however, the velocity waveforms were not severely affected by subsampling, particularly after Gaussian smoothing of the waveform. This is evidenced by the consistency of PWV values with decreasing number of projections.Discussion
We demonstrated the feasibility of a free-breathing (FB) radial PC sequence for PWV estimations. FB PWV assessment can be useful in severely diseased or older populations who cannot hold their breath when evaluating global or regional vessel stiffness and cardiovascular health. The observed bias in some subjects requires further investigation. We believe it is due to a higher acquired temporal resolution for the radial sequence and will conduct additional measurements with Cartesian PC with higher temporal resolution.Conclusion
Based on preliminary results, pulse wave velocity measures from the FB 2D radial sequence was comparable to that of the BH 2D Cartesian sequence. Further studies are warranted to (1) increase statistical power and (2) to investigate the observed bias between the Cartesian BH and the FB radial acquisitions.Acknowledgements
We gratefully thank GE for their continued MR research support.References
1. Cavalcante, J. L., Lima, J. A. C., Redheuil, A. & Al-Mallah, M. H. Aortic stiffness: Current understanding and future directions. J Am Coll Cardiol 57, 1511–1522 (2011).
2. Wentland, A. L., Grist, T. M. & Wieben, O. Review of MRI-based measurements of pulse wave velocity: a biomarker of arterial stiffness. Cardiovasc Diagn Ther 4, 193–206 (2014).
3. Gu, T. et al. PC VIPR: A high-speed 3D phase-contrast method for flow quantification and high-resolution angiography. AJNR Am J Neuroradiol 26, 743–749 (2005).
4. Mohiaddin, R. H., Firmin, D. N. & Longmore, D. B. Age-related changes of human aortic flow wave velocity measured noninvasively by magnetic resonance imaging. J Appl Physiol 74, 492–497 (1993).
5. Dogui, A. et al. Measurement of aortic arch pulse wave velocity in cardiovascular MR: Comparison of transit time estimators and description of a new approach. J Magn Reson Imaging 33, 1321–1329 (2011).
6. Groenink, M. et al. Biophysical properties of the normal-sized aorta in patients with Marfan Syndrome: evaluation with MR flow mapping. Radiology 219, 535–540 (2011).
7. Fielden, S. et al. A new method for the determination of aortic pulse wave velocity using cross-correlation on 2D PCMR velocity data. J Magn Reson Imaging 27, 1382–1387 (2008).
Figures