2256
Comparison of Phase-Contrast Flow Imaging at 0.55T and 1.5T1NATIONAL INSTITUTES OF HEALTH/NHLBI, BETHESDA, MD, United States, Bethesda, MD, United States
Synopsis
Low-field MRI equipped with high-performance technology and modern imaging methods offers the potential to make technically demanding cardiac imaging more accessible. This study demonstrates that a low-field (0.55T) system can provide accurate phase-contrast flow measurements in both healthy volunteers and patients who were clinically referred for assessment of intracardiac shunt and valvular disease. Comparative studies between contemporary high-performance 0.55T and 1.5T systems generated well-correlated quantitative flow measurements (r>0.87).
Introduction
High-performance low-field imaging technology is attractive for cardiovascular MRI due to the lower costs, favorable imaging properties and improved device safety [1, 2]. We have developed a 0.55T system with retained hardware performance and modern imaging methods, which may be well suited for the demands of rapid cardiac imaging [3]. In cardiovascular MRI, 2D phase-contrast flow measurements are routinely used for the clinical assessment of valvular heart disease, vascular flow assessment and intracardiac shunts [4]. In this study, we evaluate the quantification of pulmonary and aortic flow in normal volunteers and in patients referred for clinical cardiac MRI evaluation and compare flow quantification to conventional imaging performed at 1.5 Tesla.Methods
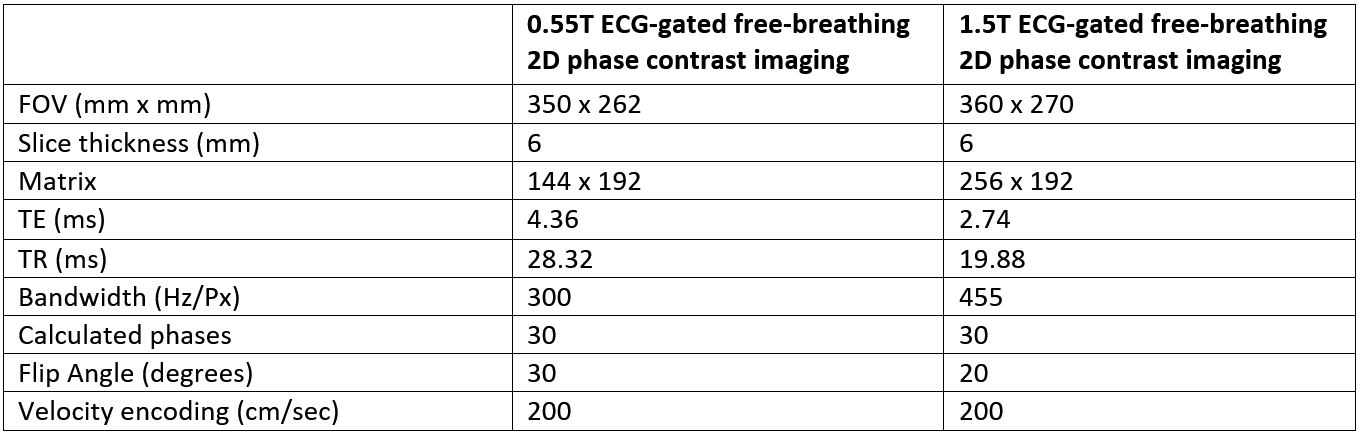
Eighteen subjects underwent paired examinations using a 1.5T system (MAGNETOM Aera, Siemens Healthcare, Erlangen, Germany) and prototype 0.55T system (MAGNETOM Aera, Siemens Healthcare, Erlangen, Germany). Both healthy subjects and clinically-referred patients were included. Clinical indications for MRI exams included assessment of valvular regurgitation and intracardiac shunts. The study was approved by our local Institutional Review Board and informed consent was obtained on all subjects and volunteers. Flow was measured using retrospectively gated, free-breathing gradient-recalled echo (GRE) phase-contrast imaging. Imaging parameters are provided in Table 1. Bandwidth was reduced and the flip angle was increased to compensate for lower SNR at 0.55T. Phase-contrast using a single directional through-plane velocity-encoded gradient was performed for the assessment of the total pulmonary flow output (Qp) through the main pulmonary artery (MPA) and the total systemic flow output (Qs) through the ascending aorta (Ao). The ratio of pulmonic-to-aortic flow was calculated to assess for the presence of a hemodynamically significant left-to-right intracardiac shunt (Qp/Qs >1.5). Correlation coefficient and Bland-Altman analyses were performed to determine the level of agreement between paired measurements. The coefficient of variation was also calculated to determine the reproducibility of each set of flow measurements.Results
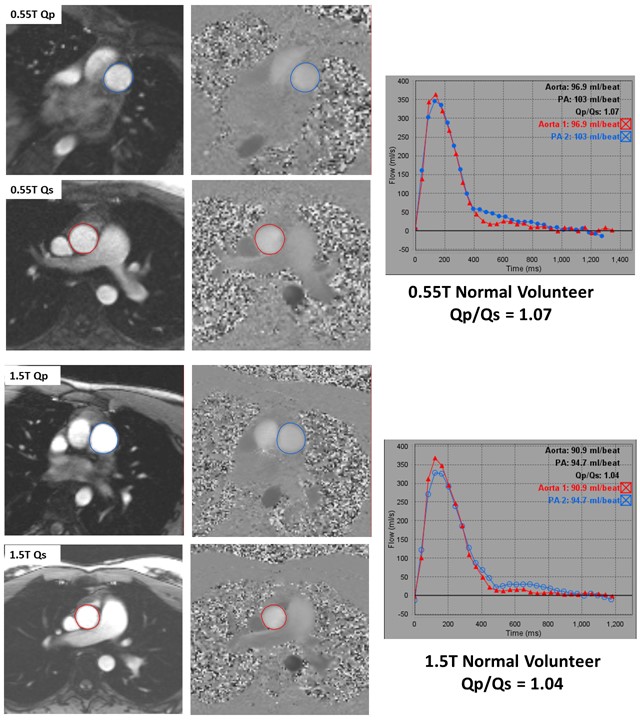
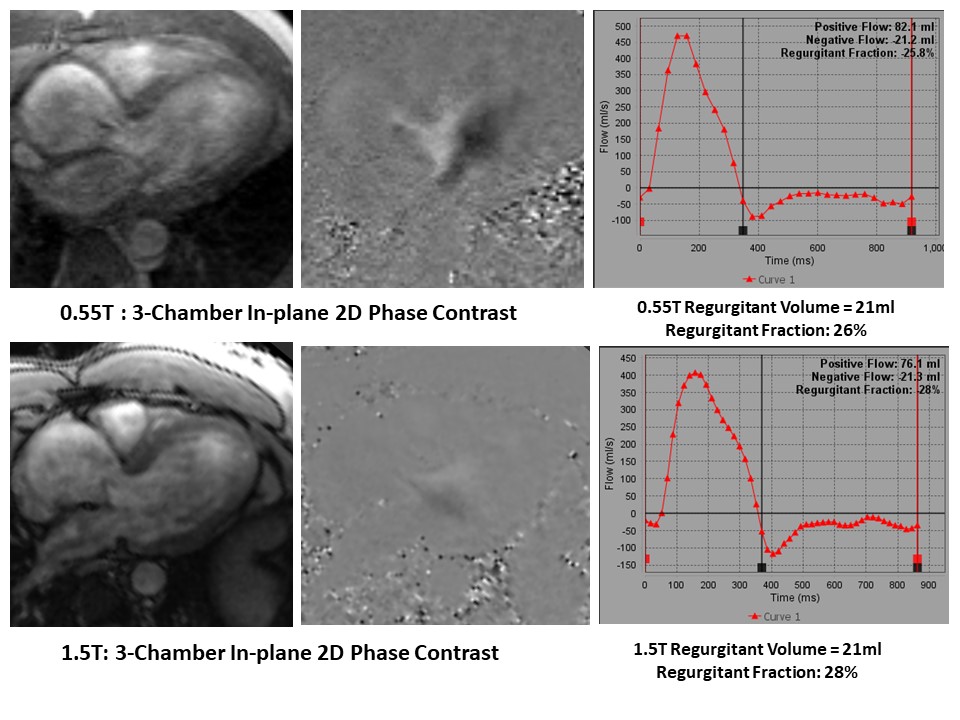
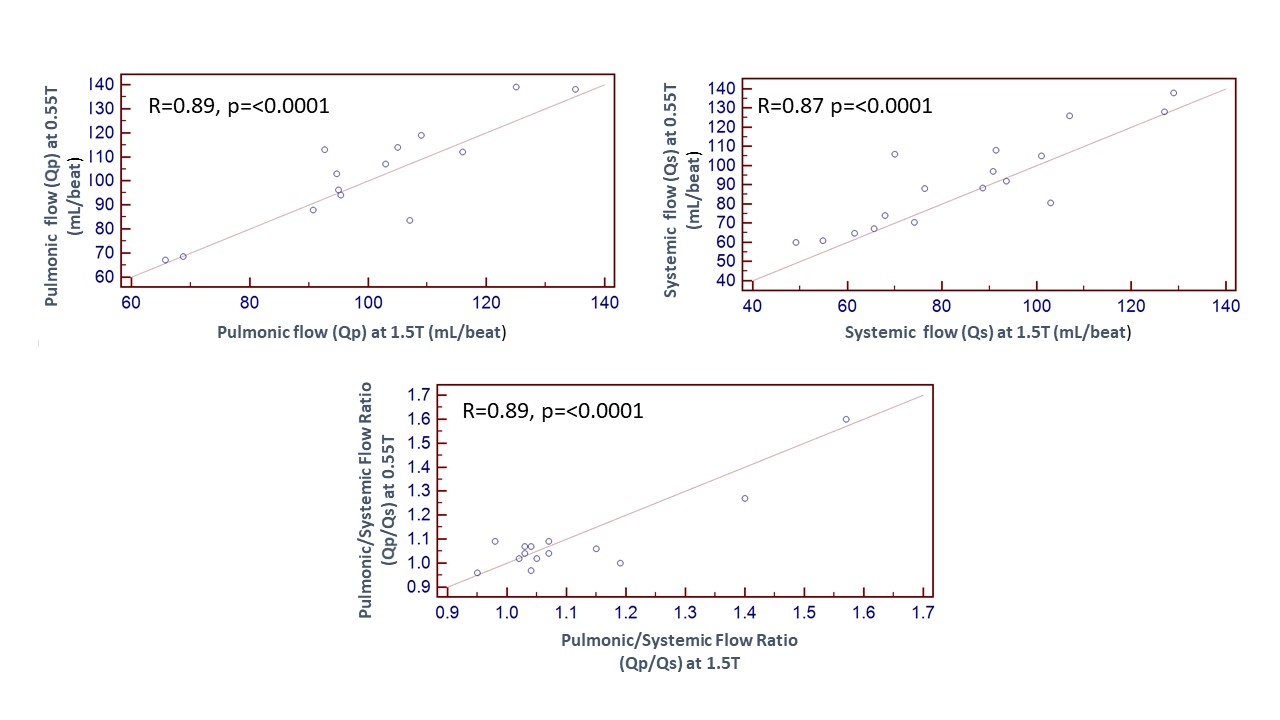
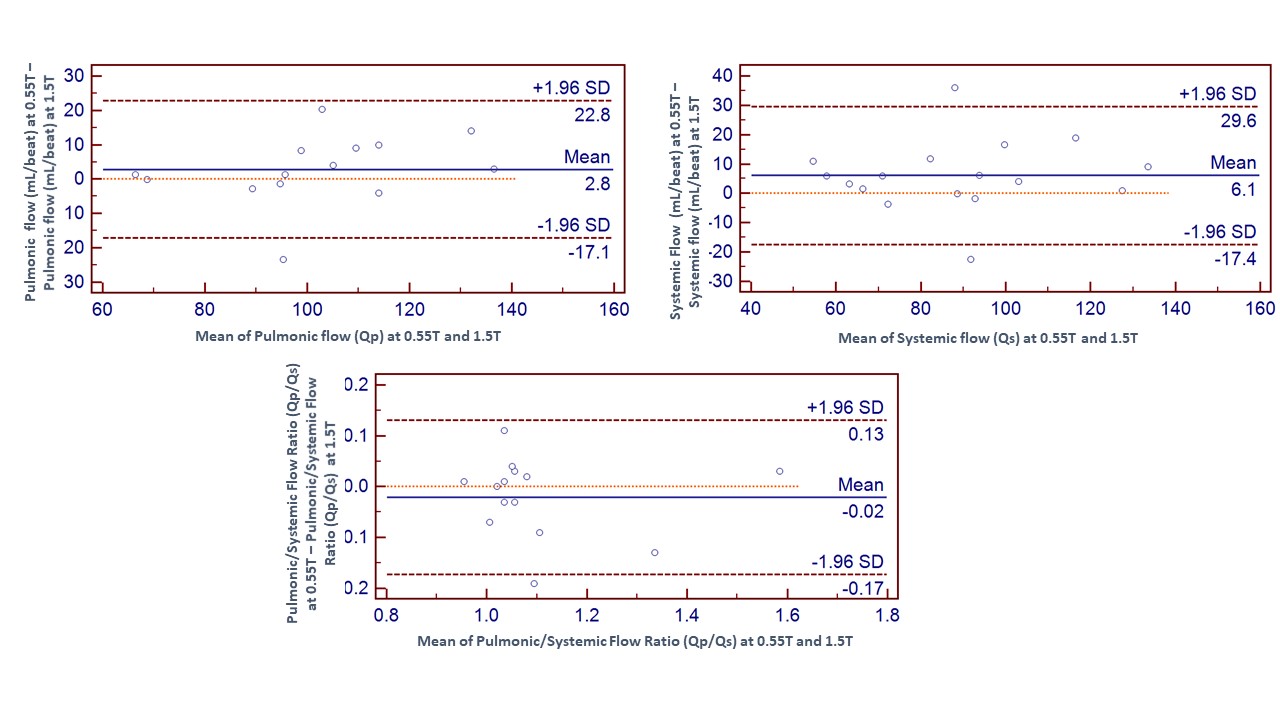
Eighteen subjects (mean age 43 ± 17 years, 11 males) were enrolled in this comparison. Ten of the 18 were healthy subjects, and the remaining eight were clinical patients referred for evaluation of a valvular or shunt issue. Figure 1 illustrates the comparison of aortic and pulmonic flow assessment in a healthy volunteer. Figure 2 provides comparison images of a patient with aortic valve insufficiency, where a diastolic flow jet is visible. When all subjects (pathology and healthy volunteers) were evaluated together, Qp and Qs measured at 0.55T demonstrated high correlation with the measurements performed at 1.5T (R = 0.89 and R = 0.87, respectively; p<0.0001 for both). Qp/Qs also demonstrated high correlation for the total group (R = 0.89, p<0.001) (Figure 3). Bland-Altman analysis (Figure 4) showed reasonable agreement for flow parameters (Qp and Qs) between 1.5T and 0.55T MRI systems. The coefficient of variation for flow parameters was 7.1% for Qp, 10.5% for Qs, and 5% for Qp/Qs.Discussion
In our study, phase-contrast flow assessment using a high-performance 0.55T system was comparable to a conventional 1.5T system. Previous studies have compared flow measurements using 0.35T and 3T in healthy volunteers [5], whereas our study included both healthy volunteers and clinical patients with valvular regurgitation and suspected intracardiac shunts, to assess the diagnostic capabilities of the 0.55T MRI system. Paired flow measurements showed a high degree of correlation and close agreement for both aortic and pulmonic flow measurements. No phase non-linearities caused by concomitant gradients were observed in phase-contrast flow measurements at low field. Image quality was preserved, and the coefficient of variation was within the range between 5-10.5%, demonstrating the suitability of a low-field system for diagnostic cardiovascular MRI.Acknowledgements
We would like to acknowledge the assistance of Siemens Healthcare in the modification of the MRI system for operation at 0.55T under an existing cooperative research agreement (CRADA) between NHLBI and Siemens Healthcare.References
1. Rashid, S., et al., Cardiac balanced steady-state free precession MRI at 0.35 T: a comparison study with 1.5 T. Quant Imaging Med Surg, 2018. 8(7): p. 627-636.
2. Simonetti, O.P. and R. Ahmad, Low-Field Cardiac Magnetic Resonance Imaging: A Compelling Case for Cardiac Magnetic Resonance's Future. Circ Cardiovasc Imaging, 2017. 10(6).
3. Campbell-Washburn, A.E., et al., Opportunities in Interventional and Diagnostic Imaging by Using High-performance Low-Field-Strength MRI. Radiology, 2019: p. 190452.
4. Nayak, K.S., et al., Cardiovascular magnetic resonance phase-contrast imaging. J Cardiovasc Magn Reson, 2015. 17: p. 71.
5. Varghese, J., et al., Cine and flow imaging at 0.35 T and Comparison to 3T. SCMR, 2019: p. P238.
Figures