2255
Effective Orifice Area (EOA) for Evaluation of Aortic Stenosis from 4D Flow MRI1Electrical and Computer Engineering, University of Louisville, Louisville, KY, United States, 2Division of Cardiovascular Medicine, University of Louisville, Louisville, KY, United States, 3Radiology, VA Medical Center, Louisville, KY, United States
Synopsis
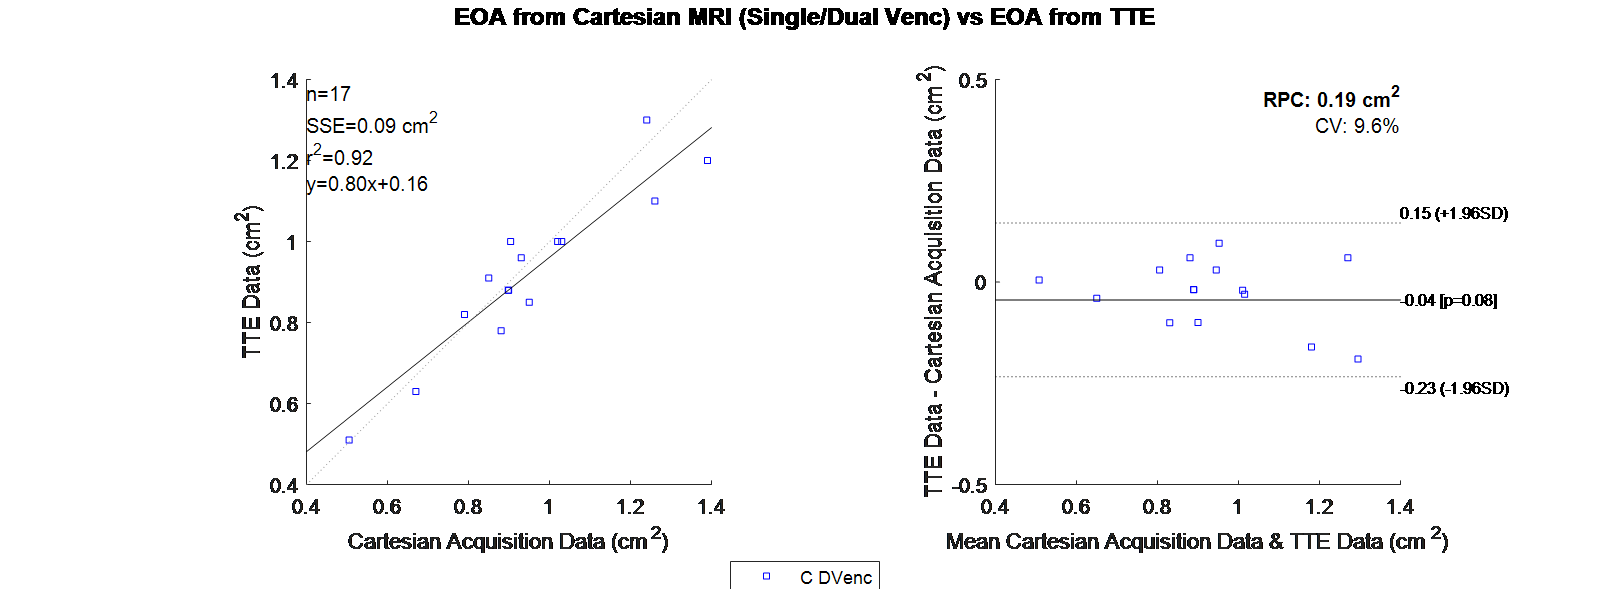
Effective Orifice Area (EOA) is a valuable diagnostic parameter for the determination of the severity of Aortic Stenosis(AS). A 4D Flow based measurement of this parameter was developed, and tested. The method was validated on a rigid phantom, applied to 4 healthy volunteers and 17 patient subjects with moderate to severe AS. The resultant EOA, for patients, was compared to their transthoracic echocardiography (TTE) with Doppler result. The comparison used Bland Altman analysis and linear regression which revealed a bias of 0.04 cm2 and correlation coefficient of 0.92. Showing a high level of concordance between the two modalities.
Introduction
Calcification of aortic valves is the common cause of a chronic and progressive valvular disease called Aortic Stenosis(AS). This calcific disease causing a reduction in leaflet motion[1, 2]. Determination of the AS severity is typically discerned from effective orifice area(EOA), transvalvular pressure gradient(TVPG), ejection time, peak outflow tract velocity, and peak aortic jet velocity. Transthoracic echocardiography(TTE) with Doppler imaging is reliable and has been the standard for evaluation of AS[3]. The objective of this study was to validate a new 4D flow based EOA measurement.Methods
4D flow MRI was performed on two stenotic phantoms, four healthy volunteers, and 17 AS subjects. Software was developed which used contours of the luminal flow area on all slices to measure EOA for all studies. The applied method for EOA calculation is based on the equation below, where SVLVOT is the stroke volume(SV) through the LVOT, and velocity time integral of the aorta(VTIAorta).$$EOA=SV_{LVOT}/VTI_{Aorta}$$
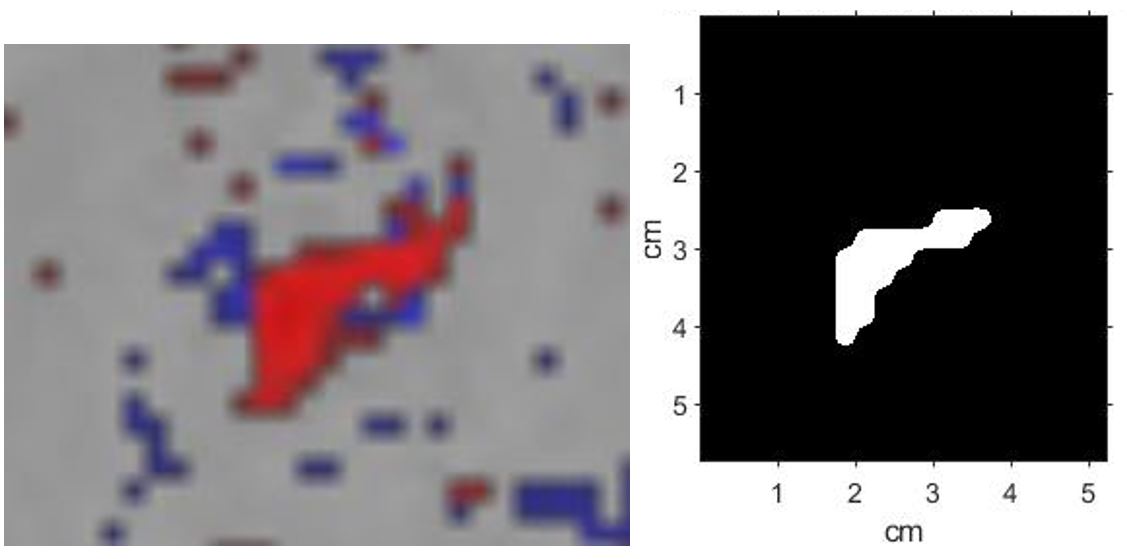
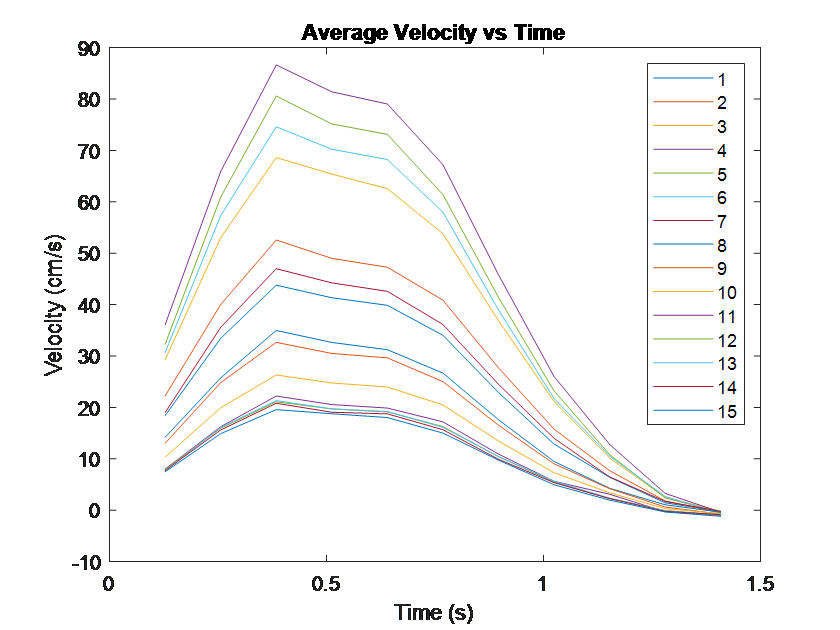
The SV is the total systolic flow volume ejected from the left ventricle, and was calculated via an integral applied to flow out of the aortic valve[4]. First, a mask was determined at the valve location via a velocity threshold(Figure 1). The net flow was then integrated over time to yield total flow through the aortic valve over time corresponding to the stroke volume. The threshold was handpicked by inspecting average velocity plots(Figure 2) across the flow volume for each time point. The generated mask was calculated for each slice with the same threshold and applied uniformly across time. The area generated from the mask was considered the Region of Interest(ROI) for all calculations. The VTI was calculated for each slice distal to the valve. The aortic valve slice was qualitatively determined using GTFlow (Gyrotools, Zurich, Switzerland), and its respective VTI was used for the EOA calculation. The VTIAorta was determined by finding the maximum downstream VTI.
In-vitro validation was performed using a two stenotic flow phantoms in a closed-loop flow system[5]. Both phantoms were straight precision machined acrylic pipes with 2.54 cm diameters which had a Gaussian shaped narrowing. The narrowing was measured via a high resolution CT, simulating a 87% and 75 % area occlusion[5]. A programmable pump capable of generating physiologic flows drives flow in the circuit and a knee coil was used for imaging.
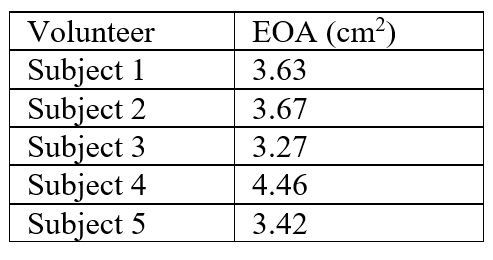
Four healthy volunteers were scanned for further validation. These volunteers had an average age of 25. The healthy volunteers were used to further validate the EOA calculation. A healthy EOA is considered greater than 3.0 cm2[6].
The study of the AS subjects was approved by the Institutional Review Board and all subjects gave informed consent to the imaging study. Subjects demographic information was as follows: all male aged 69 ± 8.6 years old. Five of the patients were diagnosed with mild AS, while the remaining were diagnosed with severe AS. Each subject underwent both a TTE and a 4D Flow MRI study.
4D flow imaging in human subjects was performed by using a Philips Achieva 1.5 T with a 16 channel Torso XL coil. The resolution was 2.5 mm x 2.5 mm x 5 mm, with a field of view of 200 mm x 200 mm x 50 mm. This was acquired over 16 heart phases, with a flip angle of 8 degrees. The Venc = 400 cm/s, TE/TR=2.8/4.1 ms.
Results
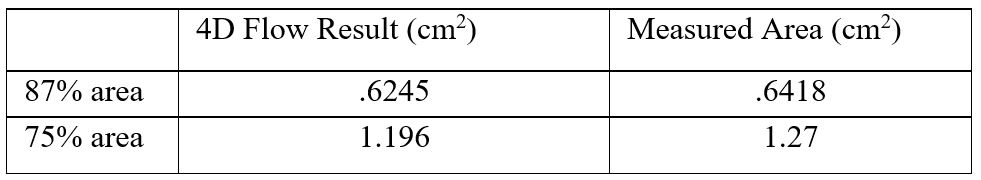
The result of this method for the phantoms can be seen in Table 1. The phantom offers a stable rigid EOA to initially test the method. The method was applied to healthy volunteers, and the results can be seen in Table 2. The volunteers did not have a TTE exam, but all results yielded an EOA consistent with a healthy EOA.Figure 3 compares EOA results from TTE and 4D flow MRI. As shown through a linear regression analysis, the slope and intercept for TTE vs. MRI measurement is 0.8 and 0.16, with a correlation coefficient of 0.92. N represents the number of samples; the Sum of Squared Errors of prediction(SSE) is also reported in each plot. A smaller value represents a stronger fit. $$$R^{2}$$$ is the coefficient of determination, where 1.0 is the best possible fit. Reproducibility coefficient(RPC), is 1.96 * Standard Deviation(SD), and CV is the coefficient of variation, the percent Standard Deviation(SD) of the mean values. For example, in Figure 3 the CV is 9.6%, which implies the average deviation is 9.6% from the accurate data. The p-value is also displayed in the right margin, indicating the probability that an EOA measurement from a TTE measurement would be greater than MRI results.
Conclusion
This abstract demonstrates that 4D flow MRI is accurate in calculating EOA with the continuity equation. Seventeen subjects with AS were scanned with Cartesian 4D flow MRI and the results are highly correlated with TTE Doppler measures of EOA. Bland-Altman analysis revealed a slight underestimation of 4D flow MRI for EOA relative to TTE. Phantom EOA also correlated highly with the true area of the occlusion. Normal volunteer results behaved as expected with EOA being greater than 3 cm2. In conclusion 4D flow MRI provides an effective method for calculation of EOA.Acknowledgements
Funded by NIH (grant: 1R21-HL132263)References
[1] R. O. Bonow, B. A. Carabello, K. Chatterjee, A. C. de Leon, D. P. Faxon, M. D. Freed, W. H. Gaasch, B. W. Lytle, R. A. Nishimura, and P. T. O'Gara, "2008 focused update incorporated into the ACC/AHA 2006 guidelines for the management of patients with valvular heart disease: a report of the American College of Cardiology/American Heart Association Task Force on Practice Guidelines (Writing Committee to revise the 1998 guidelines for the management of patients with valvular heart disease) Endorsed by the Society of Cardiovascular Anesthesiologists, Society for Cardiovascular Angiography and Interventions, and Society of Thoracic Surgeons," Journal of the American College of Cardiology, vol. 52, no. 13, pp. e1-e142, 2008.
[2] R. A. Nishimura, C. M. Otto, R. O. Bonow, B. A. Carabello, J. P. Erwin, R. A. Guyton, P. T. O’gara, C. E. Ruiz, N. J. Skubas, and P. Sorajja, "2014 AHA/ACC guideline for the management of patients with valvular heart disease: a report of the American College of Cardiology/American Heart Association Task Force on Practice Guidelines," Journal of the American College of Cardiology, vol. 63, no. 22, pp. e57-e185, 2014.
[3] J. Garcia, O. R. Marrufo, A. O. Rodriguez, E. Larose, P. Pibarot, and L. Kadem, "Cardiovascular magnetic resonance evaluation of aortic stenosis severity using single plane measurement of effective orifice area," Journal of Cardiovascular Magnetic Resonance, vol. 14, no. 1, p. 1, 2012.
[4] S.-C. Yap, R.-J. v. Geuns, F. J. Meijboom, S. W. Kirschbaum, J. S. McGhie, M. L. Simoons, P. J. Kilner, and J. W. Roos-Hesselink, "A simplified continuity equation approach to the quantification of stenotic bicuspid aortic valves using velocity-encoded cardiovascular magnetic resonance," Journal of Cardiovascular Magnetic Resonance, vol. 9, no. 6, pp. 899-906, 2007.
[5] M. J. Negahdar, M. Kadbi, M. Kendrick, M. F. Stoddard, and A. A. Amini, "4D spiral imaging of flows in stenotic phantoms and subjects with aortic stenosis," Magnetic resonance in medicine, 2015.
[6] J. B. Chambers, "Aortic stenosis," European Journal of Echocardiography, vol. 10, no. 1, pp. i11-i19, 2009.
Figures