2245
Detection of atrial scar using 3D high-resolution dark-blood phase sensitive inversion recovery imaging
Dongyue Si1, Yanfang Wu2, Jie Yin2, Rui Guo3, Jingjing Xiao4, Bowei Liu1, Xue Lin2, Peng Gao2, Deyan Yang2, Quan Fang2, Jianwen Luo1, Daniel A. Herzka5,6, and Haiyan Ding1
1Center for Biomedical Imaging Research (CBIR), Department of Biomedical Engineering, School of Medicine, Tsinghua University, Beijing, China, 2Department of Cardiology, Peking Union Medical College Hospital, Chinese Academy of Medical Sciences & Peking Union Medical College, Beijing, China, 3Department of Medicine, Beth Israel Deaconess Medical Center and Harvard Medical School, Boston, MA, United States, 4Department of Medical Engineering, Xinqiao Hosptial, Army Medical University, Chongqing, China, 5Department of Biomedical Engineering, Johns Hopkins School of Medicine, Baltimore, MD, United States, 6Cardiovascular Interventional Program, National Heart, Lung, and Blood Institute, National Institutes of Health, Bethesda, MD, United States
1Center for Biomedical Imaging Research (CBIR), Department of Biomedical Engineering, School of Medicine, Tsinghua University, Beijing, China, 2Department of Cardiology, Peking Union Medical College Hospital, Chinese Academy of Medical Sciences & Peking Union Medical College, Beijing, China, 3Department of Medicine, Beth Israel Deaconess Medical Center and Harvard Medical School, Boston, MA, United States, 4Department of Medical Engineering, Xinqiao Hosptial, Army Medical University, Chongqing, China, 5Department of Biomedical Engineering, Johns Hopkins School of Medicine, Baltimore, MD, United States, 6Cardiovascular Interventional Program, National Heart, Lung, and Blood Institute, National Institutes of Health, Bethesda, MD, United States
Synopsis
Radiofrequency ablation (RFA) is a first-line treatment for controlling atrial fibrillation (AF). Visualizing fibrotic tissues as well as the surrounding anatomical structure could improve the delivery of therapy. In this work, an independent navigator-gated three-dimensional dark-blood phase-sensitive inversion recovery sequence was developed for atrial visualization. Dark-blood was achieved by optimizing inversion recovery and T2-preparation timing. Preliminary results from in vivo imaging in patients with AF post RFA demonstrate that the proposed technique can clearly visualize the atrial wall and scar formation. Both dark blood contrast and high resolution (1.25×1.25×3 mm3) were achieved.
INTRODUCTION
Atrial fibrillation (AF) is the most common clinically significant cardiac arrhythmia. Isolating the pulmonary veins (PV) by radiofrequency ablation (RFA) has become a first-line treatment for controlling AF. Detailed visualization of atrial fibrosis and continuity of delivered ablation lesions in conjunction with surrounding anatomy could improve the both preprocedural decision making and post-procedural prognosis. 1-4Late gadolinium enhancement (LGE) has been widely used to image myocardial fibrosis. Inversion recovery (IR) or phase-sensitive inversion recovery (PSIR) 5 are the most widely used sequences for LGE. However, due to the extremely thin wall,1 imaging the atrium is still challenging. In recent years, dark-blood PSIR imaging in two- or three-dimensions (2D or 3D) using either T2-IR or magnetization transfer-IR preparation have been proposed.6-8 Superior contrast between myocardium and blood could improve delineation between the atrial wall and the blood pool, increasing sensitivity to identify fibrosis.
The aim of this study was to develop an independent navigator-gated9 3D dark-blood phase-sensitive inversion recovery (DB-PSIR) sequence for atrial imaging. We hypothesize that the combination of dark-blood contrast and high resolution achievable with 3D imaging can better visualize atrial tissue in AF patients post RFA.
METHODS
Pulse sequenceFigure 1 shows the diagram of the proposed DB-PSIR sequence. Two ECG-triggered multi-shot 3D volumes are interleaved acquired using spoiled gradient echo (SPGR) sequence. The first volume is prepared with the combination of IR and T2-preparation (T2PREP) pre-pulses to null normal myocardium and blood simultaneously. The durations between IR and T2PREP (TD1) and between T2PREP and imaging (IMG) (TD2) are calculated using Bloch equation simulations. The second volume is the phase refence for PSIR reconstruction (REF)5. Before data acquisition, fat suppression and an independent respiratory navigator are performed. Independent navigators for the two volumes separately gate the corresponding volumes with their own training templates ensuring a motion-compensated reference volume and high scan efficiency9.
In vivo experiments
As approved by the local institutional review board, three AF patients (2 males, 60±1 yrs) were recruited 1-3 mo post RFA. Both independent navigator-gated 3D PSIR9 and the proposed 3D DB-PSIR sequences were acquired in axial orientation at 3T (Philips Ingenia CX) 10 and 20 mins after contrast (Gd‐DTPA, Magnevist, 0.2mmol/kg) injection, respectively. Typical imaging parameters were: FOV 280×280×100 mm3, TR/TE 5.2/2.6 ms, T2PREP echo time (TE) 30ms, voxel size 1.25×1.25×3 mm3 reconstructed into 0.73×0.73×1.5 mm3, SENSE acceleration factor 1.875, FA 18° for IMG and 10° for REF, acceptance window 5 mm. The ECG trigger delay (Ttrigger) was determined from cine of the atrium. T1 values of the normal myocardium and blood pool were measured by modified look‐locker inversion recovery (MOLLI) scouts10 and incorporated into simulations. Corresponding T2 values were obtained from literature, and set to 50 and 250 ms, for myocardium and blood respectively6.
Regions of interest (ROIs) were manually defined on scar in atrium, blood and remote ventricular myocardium. Both endo- and epi-myocardium were carefully avoided. The contrast to noise ratio (CNR) were measured as the difference between mean signal intensity between tissues over the standard deviation of background noise.
RESULTS
Figure 2 showed the representative images of 3D PSIR and the proposed DB-PSIR. The thin atrial wall was well delineated from DB-PSIR images. A thin tissue layer between the atrium and aorta could be appreciated which was difficult to identify from 3D PSIR (red arrow). The scar to myocardium CNR in DB-PSIR was lower than that in PSIR (68.81 vs. 123.21), but the corresponding scar to blood CNR in DB-PSIR was much higher than in PSIR (67.01 vs. 0.55). Figure 3 showed the finding of fibrosis tissue around the left inferior pulmonary vein. Corresponding reformatted images demonstrate RF ablation lesion. Again, DB-PSIR depicted the RFA lesion with superior contrast from both atrial wall and blood pool.DISCUSSION
In this study, an independent navigator gated 3D DB-PSIR sequence was developed and tested in vivo. The preliminary result is promising by providing the detectable contrast between normal myocardium and scar tissue on the atrium. The dark blood successfully removes the contamination from adjacent blood signal. Clear differentiation of thin atrial wall can be achieved with high spatial resolution. The independent navigators on the IR-T2PREP prepared volume and reference volume presented both robust PSIR reconstruction with improved reference motion compensation and time efficiency. Minor inflow artifacts in the right PV blood pool (yellow arrows Fig. 2) result from navigator excitation on the right hemidiaphragm3. These can be addressed by placing the navigator beam away from the right PV or performing the navigator after acquisition.CONCLUSION
The proposed independent navigator-gated 3D DB-PSIR sequence had an improved contrast between atrial myocardium and blood. The atrial wall could be clearly delineated and scar from RF ablation lesions visualized. Differentiation of fibrotic tissue from normal myocardium on atrium was feasible in AF patients post RFA.Acknowledgements
No acknowledgement found.References
- Kolandaivelu A. Role of Cardiac Imaging (CT/MR) Before and After RF Catheter Ablation in Patients with Atrial Fibrillation. J Atr Fibrillation. 2012; 20;5(2):523
- Akoum N, WilberD, Hindricks G, Jais P, Cates J, Marchlinski F, Kholmovski E, Burgon N, Hu N, Mont L, Deneke T, Duytschaever M, Neumann T, Mansour M, Mahnkopf C, Hutchinson M, Herweg B, Daoud E, Wissner E, Brachmann J, Marrouche NF. MRI assessment of ablation-induced scarring in atrial fibrillation: Analysis from the DECAAF study. Journal of Cardiovascular Electrophysiology, 2015;26(5), 473–480.
- Peters DC, Wylie JV, Hauser TH, Kissinger KV, Botnar RM, Essebag V, Josephson ME, Manning WJ. Detection of Pulmonary Vein and Left Atrial Scar after Catheter Ablation with Three-dimensional Navigator gated Delayed Enhancement MR Imaging: Initial Experience. Radiology, 2007;243(3), 690–695.
- Taclas JE, Nezafat R, Wylie JV, Josephson ME, Hsing J, Manning WJ, Peters DC. Relationship between intended sites of RF ablation and post-procedural scar in AF patients, using late gadolinium enhancement cardiovascular magnetic resonance, Heart Rhythm, 2010 (7), 489-496
- Kellman P, Arai AE, McVeigh ER, Aletras AH. Phase-sensitive inversion recovery for detecting myocardial infarction using gadolinium-delayed hyperenhancement. Magn Reson Med. 2002;47(2):372-383
- Kellman P, Xue H, Olivieri LJ, Cross RR, Grant EK, Fontana M, Ugander M, Moon JC, Hansen MS. Dark blood late enhancement imaging. J Cardiovasc Magn Reson. 2016;7;18(1):77
- Kim HW, Rehwald WG, Jenista ER, Wendell DC, Filev P, van Assche L, Jensen CJ, Parker MA, Chen EL, Crowley ALC, Klem I, Judd RM, Kim RJ. Dark-Blood Delayed Enhancement Cardiac Magnetic Resonance of Myocardial Infarction. JACC Cardiovasc Imaging. 2018;11(12):1758-1769
- Ginami G, Lòpez K, Mukherjee RK, Neji R, Munoz C, Roujol S, Mountney P, Razavi R, Botnar RM, Prieto C. Non-contrast enhanced simultaneous 3D whole-heart bright-blood pulmonary veins visualization and black-blood quantification of atrial wall thickness. Magn Reson Med. 2019;81(2):1066-1079
- Lee S, Schär M, Zviman M, Sena-Weltin V, Harouni A, Kozerke S, McVeigh E, Halperin H, Herzka D. Free breathing independent respiratory navigator-gated imaging: concurrent PSIR and T2-weighted 3D imaging of the left ventricle. In Proceedings of the 19th Annual Meeting of ISMRM, Montreal, Canada, 2011. p 19.
- Messroghli DR, Radjenovic A, Kozerke S, Higgins DM, Sivananthan MU, Ridgway JP. Modified look-locker inversion recovery (MOLLI) for high-resolution T 1 mapping of the heart. Magn Reson Med. 2004;52:141–146
Figures
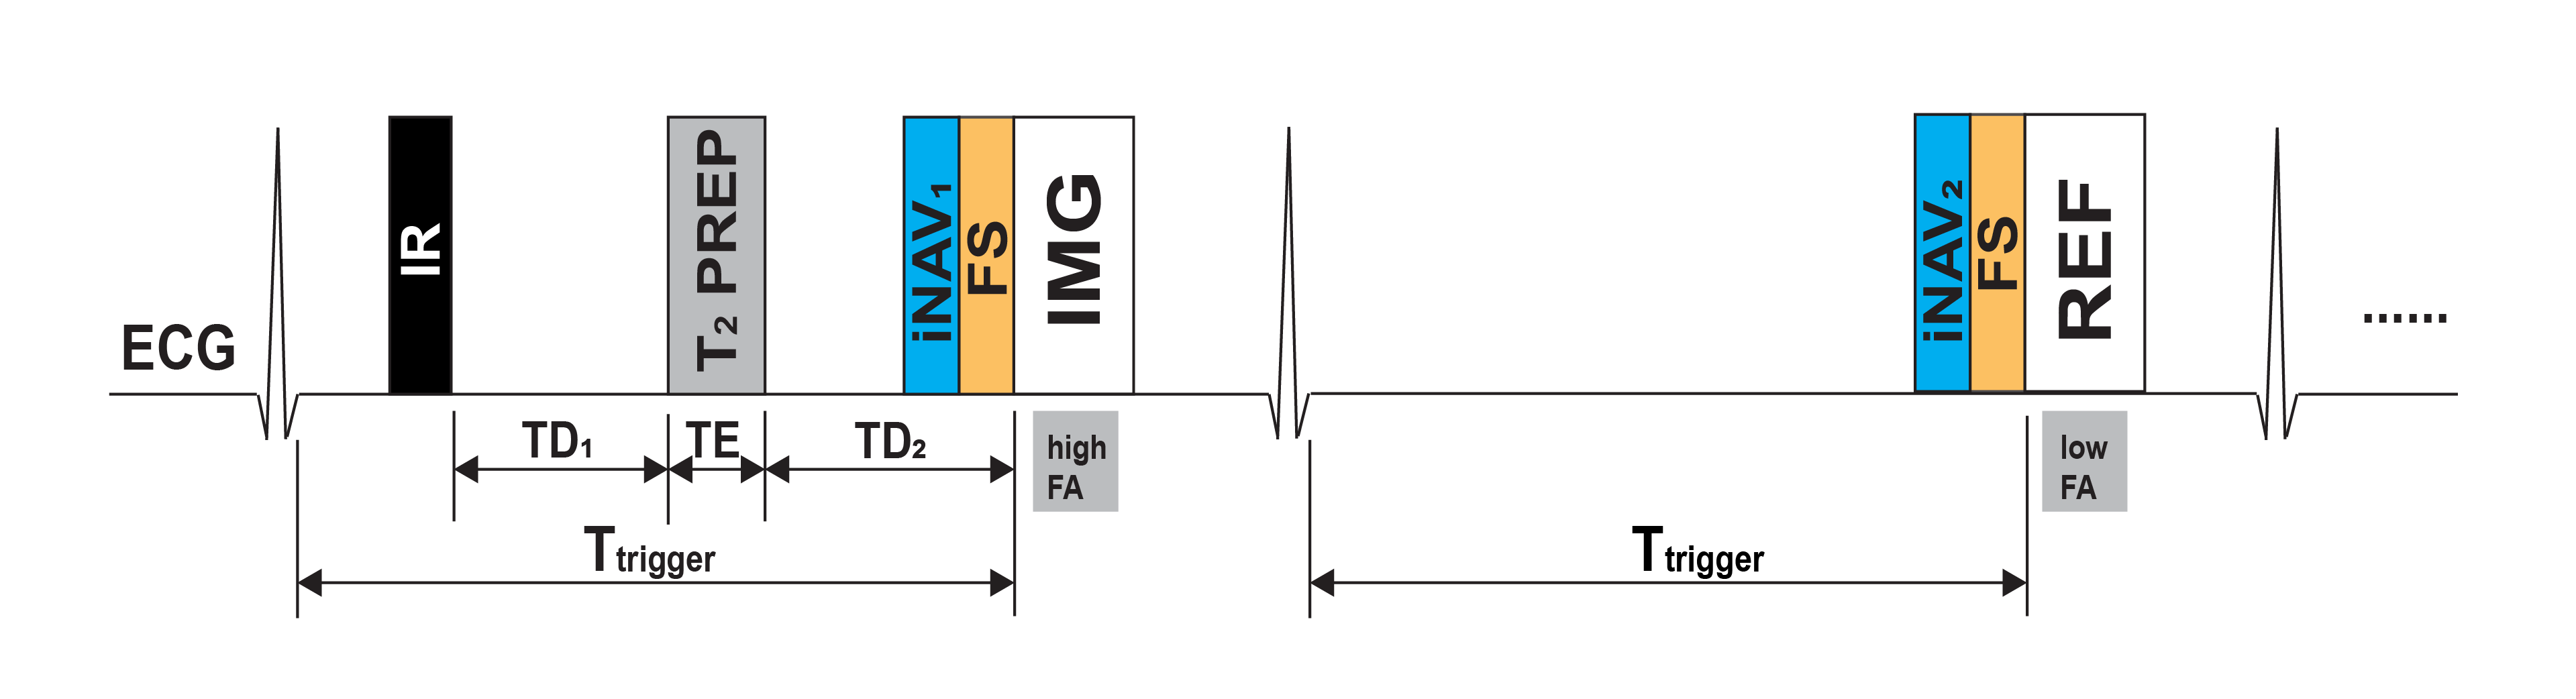
Figure 1. Diagram for the proposed DB-PSIR sequence.
Inversion recovery (IR) and a T2 preparation (T2PREP)
pre-pulses were used for the first imaging volume (IMG), with contrast determined
by the delay time from IR to T2PREP (TD1) and the delay
time from T2PREP to IMG (TD2). Both the IMG and the
reference Volume (REF) were acquired at mid-diastole when the atrium is
relatively static (Ttrigger). FS: Fat suppression, iNAV1
and iNAV2: independent respiratory navigators, FA: flip angle.
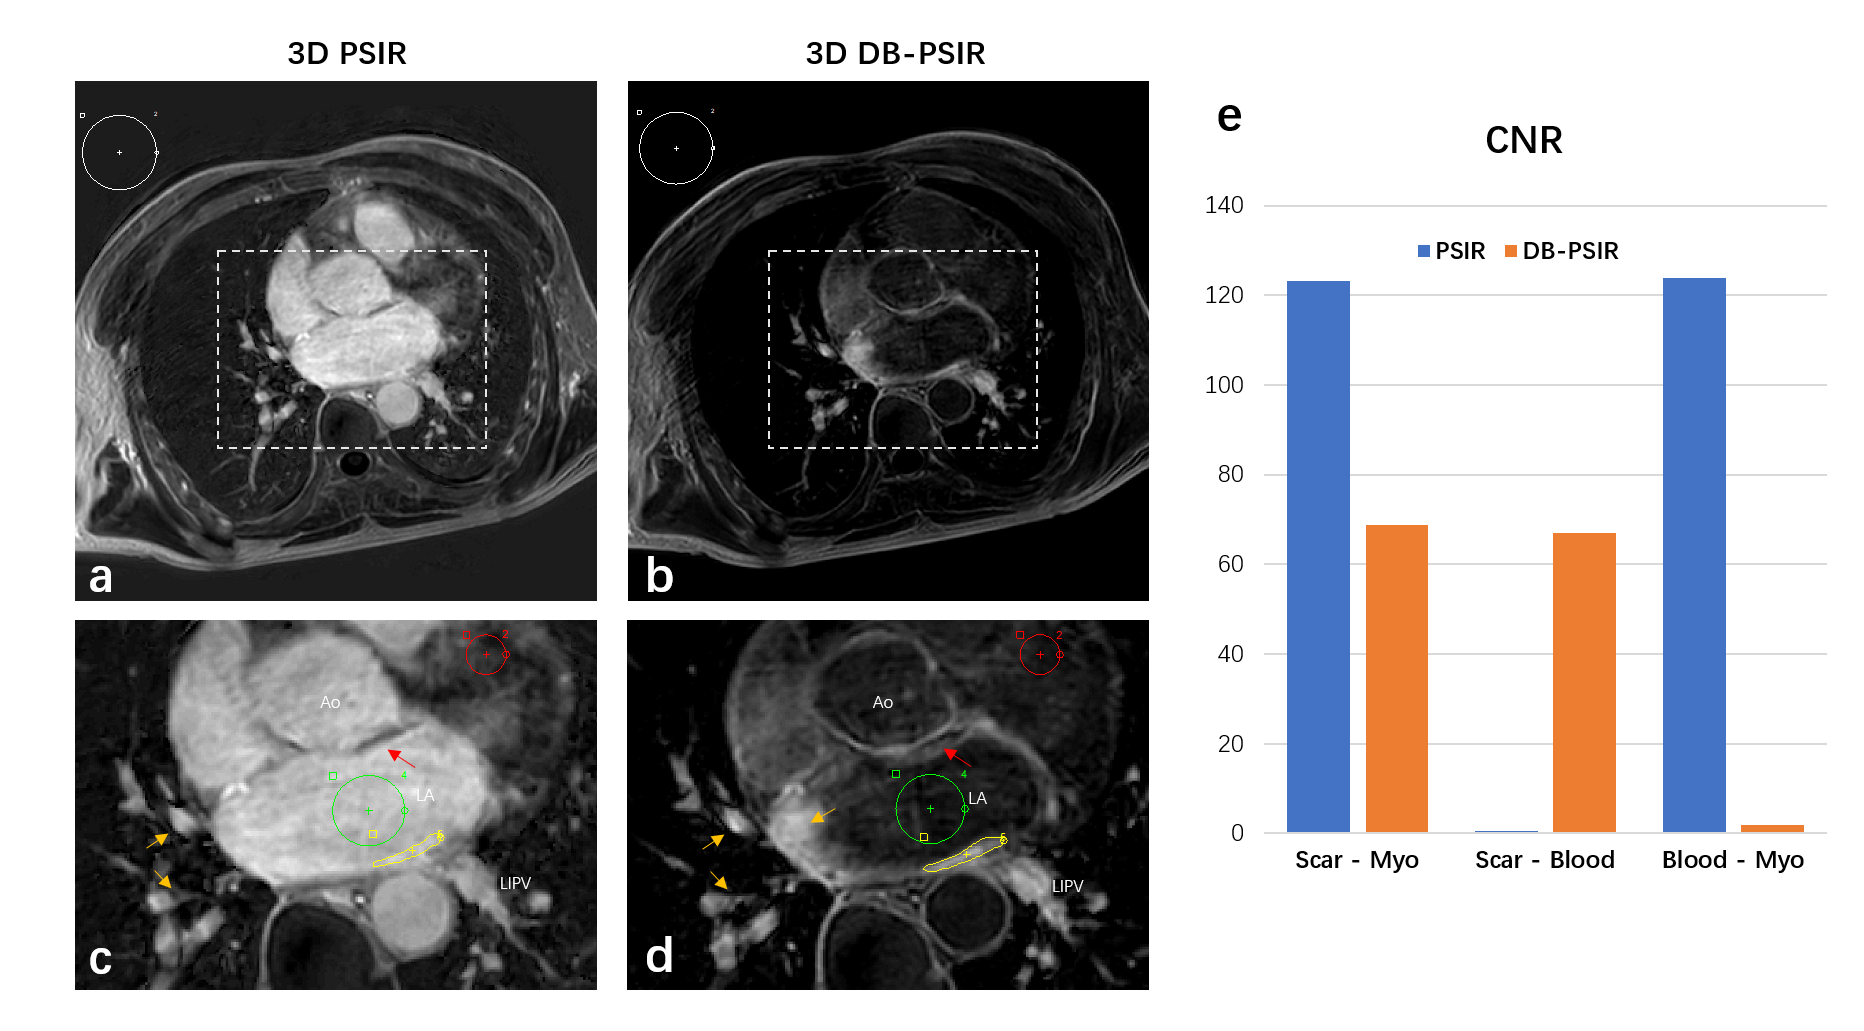
Figure 2. Representative axial slice of 3D PSIR (a, c) and the proposed 3D DB-PSIR (b, d). The mean signal intensity of scar, blood and myocardium were measured in yellow, green and red ROIs. Background ROI in white was defined for contrast (CNR) calculation. Magnified images (c and d) demonstrate location of ROIs. The thin tissue layers between the atrium and aorta are indicated with red arrows. Inflow artifacts from navigator restoration indicated with yellow arrows. (e) was the tissue CNR comparison from PSIR and DB-PSIR. LA: Left Atrium, LIPV: Left inferior pulmonary vein, Ao: Aorta.
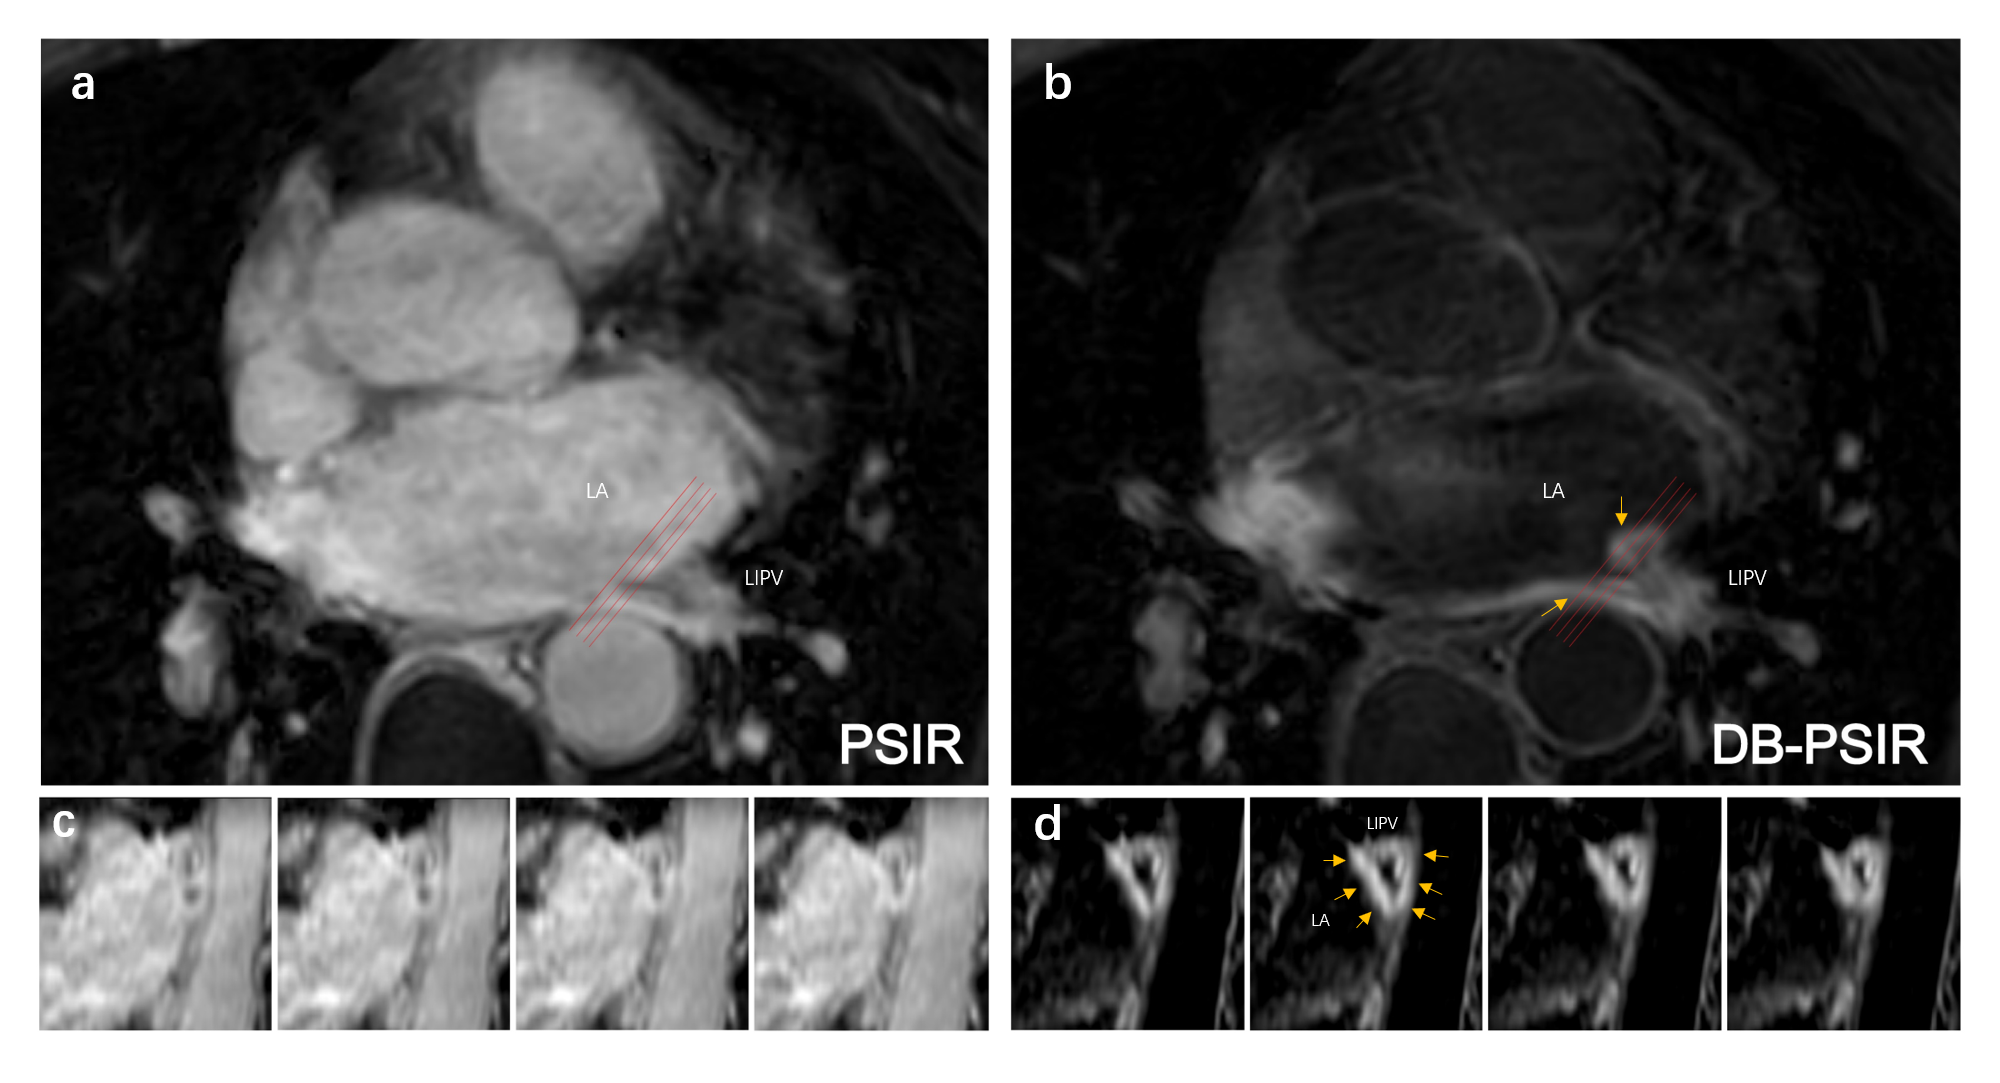
Figure 3. The images of the left inferior
pulmonary vein from PSIR (a, c) and DB-PSIR (b, d). Inset images were reformatted
along with the orientation of the red lines. Scar is indicated with yellow
arrows. LA: Left Atrium, LIPV: Left inferior pulmonary vein.