2242
Noninvasive Cardiac Chamber Blood Oxygenation Measurements: T2 and QSM approaches.
Yan Wen1,2, Jonathan W. Weinsaft3, Thanh D. Nguyen2, Jiwon Kim3, Yi Wang4,5, and Pascal Spincemaille2
1Meinig School of Biomedical Engineering, Cornell University, new york, NY, United States, 2Radiology, Weill Cornell Medicine, New York, NY, United States, 3Medicine, Weill Cornell Medicine, New York, NY, United States, 4Meinig School of Biomedical Engineering, Cornell University, New York, NY, United States, 5Radiology, Weill Cornell Medicine, new york, NY, United States
1Meinig School of Biomedical Engineering, Cornell University, new york, NY, United States, 2Radiology, Weill Cornell Medicine, New York, NY, United States, 3Medicine, Weill Cornell Medicine, New York, NY, United States, 4Meinig School of Biomedical Engineering, Cornell University, New York, NY, United States, 5Radiology, Weill Cornell Medicine, new york, NY, United States
Synopsis
Previous studies have demonstrated noninvasive cardiac chamber blood oxygenation measurement using T2 and QSM. This work shows the initial comparison between the two approaches for such measurements in healthy volunteers.
INTRODUCTION
Differential right ventricle (RV) to left ventricle (LV) oxygen saturation ($$${\Delta}SaO_2$$$) measures the oxygenation difference between the blood in RV and LV, which is an important indicator of cardiopulmonary function for assessing cardiac function in heart failure patients, and to measure shunt fractions in patients with congenital or acquired heart disease. Cardiac quantitative susceptibility mapping (QSM) is an emerging technique for non-invasive quantification of $$${\Delta}SaO_2$$$ (1,2). Here, we present our initial results comparing QSM based $$${\Delta}SaO_2$$$ measurements with T2 derived $$${\Delta}SaO_2$$$ measurements in healthy subjects.METHODS
Eight healthy volunteers were scanned on a commercial GE 3.0T scanner with both T2 mapping and QSM to measure $$${\Delta}SaO_2$$$.T2 approach: A breath-hold ECG-triggered 2D single-shot T2 prepared sequence (3), with typical scan parameters of TE/TR=1.2ms/2.8ms, 3.1x3.1x10 mm3 resolution, 40s scan time was used to acquire a series T2 weighted images at different inversion spacings ( =12, 15, 20, and 25 ms) and different number of refocusing pulses (0, 2, 4, 8, 12). ARLO (4) was used to fit T2. The T2 maps were then fit to the Luz-Meiboom model:
$$\frac{1}{T_{2b}}=\frac{1}{T_{2O}}+(Pa)(1-Pa)\tau_{ex}[(1-\frac{\%SbO_2}{100})\alpha\omega_0]^2\times(1-\frac{2\tau_{ex}}{\tau_{180}}tanh\frac{\tau_{180}}{2\tau_{ex}})\space\space\space\space\space\space\space\space\space\space\space\space\space[1]$$
where $$$T_{2b}$$$ is the measured blood T2, $$$T_{2O}$$$ is the T2 of fully oxygenated blood, $$$Pa$$$ is approximately hematocrit, $$$\tau_{ex}$$$ is the water proton exchange time between erythrocytes and plasma, $$$\%SbO_2$$$ is the oxygen saturation, $$$\alpha$$$ is a susceptibility and geometry dependent parameter, and $$$\omega_0$$$ is the proton resonance frequency. To obtain the RV oxygen saturation, $$$SaO_{2,RV}$$$, a joint-processing of all unknown model parameters ( $$$T_{2O}$$$, $$$\tau_{ex}$$$ , $$$\%SbO_2$$$ , and $$$\omega_0$$$ ) was used while assuming a 98% LV oxygen saturation (3), so that $$${\Delta}SaO_2=98%-SaO_{2,RV}$$$.
QSM approach: A free-breathing ECG-triggered Navigator gated 3D multi-echo GRE sequence with full first order flow compensation was used for QSM data acquisition. Typical scan parameters were: TE1/$$$\Delta$$$TE=2.3ms/3.6ms, #TE=5, TR=20ms, 2x2x5mm3, scan time 4.7±1.1minutes. The QSM maps were reconstructed using the preconditioned total field inversion algorithm with imposed blood pool uniformity regularizations as follows:
$$y^*=argmin_y\frac{1}{2}{\parallel}w(f-d*Py){\parallel}^2_2+{\lambda\parallel}M_G{\triangledown}Py{\parallel}_1+{\lambda_{RV}\parallel}M_{RV}P(y-\overline{y}^{RV}){\parallel}^2_2+{\lambda_{LV}\parallel}M_{LV}P(y-\overline{y}^{LV}){\parallel}^2_2$$
The first two terms are the data fidelity term and structure consistency regularization term, respectively, where $$$w$$$ is the SNR weighting, $$$f$$$ is the total field, $$$D$$$ is the dipole kernel, $$$*$$$ is the convolution operator, $$$P$$$ is the preconditioner, $$$\lambda$$$ is the regularization parameter, $$$M_G$$$ is a binary edge mask constructed, $$$\triangledown$$$ is the gradient operator. The final QSM map, $$$\chi$$$, is then $$$\chi=Py^*$$$. The last two terms constrain the susceptibility variation within the RV and the LV blood pools, where $$$\lambda_{RV}$$$ and $$$\lambda_{LV}$$$ are regularization parameters, $$$M_{RV}$$$ and $$$M_{LV}$$$ are the mask for RV and LV obtained through manual segmentation on the GRE images. $$$y-\overline{y}^{RV}$$$ and $$$y-\overline{y}^{LV}$$$ are the average susceptibility over the RV and LV blood pools, respectively. The differential susceptibility between RV and LV blood pools ) was then converted to blood oxygenation difference ($$${\Delta}SaO_2$$$) using $$${\Delta}SaO_2=\frac{-\Delta\chi}{4H\chi_{eoxyheme}}$$$.
Statistical methods: Pearson correlation coefficients, Deming linear regression, and the Bland Altman plots were used to test the difference between the T2 and QSM $$${\Delta}SaO_2$$$ measurements.
RESULTS
T2 maps and free-breathing QSM were successfully acquired in all 8 healthy volunteers. Figure 1 shows the T2 and the QSM maps in a representative case. On the T2 maps, the T2 values in both RV and LV decrease with increasing , as the Luz-Meiboom model predicts. Note that the T2 values in the heart chambers are not homogenous. On QSM, susceptibility is higher in the RV than in the LV due to higher deoxyheme concentration in the RV. Figure 2 shows the resulting oxygen saturation maps from the two approaches. As shown in Figure 3, linear regression between the $$${\Delta}SaO_2$$$ measured with T2 and with QSM returned a slope=0.84 and R2=0.82. Bland Altman plot shows a bias=2.9% and limits of agreement=4.2%.Point out image quality issuesDISCUSSION
In the 8 healthy volunteers, $$${\Delta}SaO_2$$$ measured using T2 linearly correlated with the $$${\Delta}SaO_2$$$ from QSM (slope=0.84, r=0.82), with a small bias (2.9%). The known LV oxygenation decrease during a 40 seconds breath hold (5) compared to the assumed 98% oxygen saturation level may have contributed to this bias. A limitation for the T2 approach is that the Luz-Meiboom model fitting requires careful empirical selections of initial guesses and bounds for the fitting parameters, as it is mathematically impossible to separate and in Eq.1. In this study, we followed the recommendations from a previous study on 1.5T (3), but these initial guesses and bounds may not be optimal for our 3T experiments. As the result, at least 1 bound was active for all 8 datasets. In addition, B1 inhomogeneity and blood flow artifacts may also have affected our T2 measurements, as observed by the inhomogeneous T2 values in the heart chamber blood. However, the scan time for the T2 sequence is shorter than the QSM sequence. [yw1]Pro and cons for each methodCONCLUSION
This initial comparison shows that the $$${\Delta}SaO_2$$$ measurements from T2 and QSM agree reasonably well in healthy volunteers and QSM represents a more rigorous approach to $$${\Delta}SaO_2$$$ quantification.Acknowledgements
This work was supported in part from NIH grant R01HL128278, R01NS072370, R01NS090464, R01NS095562, and R01CA181566.References
1. Wen Y, Nguyen TD, Liu Z, Spincemaille P, Zhou D, Dimov A, Kee Y, Deh K, Kim J, Weinsaft JW, Wang Y. Cardiac quantitative susceptibility mapping (QSM) for heart chamber oxygenation. Magn Reson Med 2018;79(3):1545-1552. 2. Wen Y, Weinsaft J.W., Nguyen T.D., Liu Z, Horn E.M., Singh H, Kochav J, Eskreis‐Winkler S, Deh K, Kim J, Prince M.R., Wang Y, Spincemaille P. Free Breathing Three-Dimensional Cardiac Quantitative Susceptibility Mapping for Differential Cardiac Chamber Blood Oxygenation – Initial Validation in Patients with Cardiovascular Disease inclusive of Direct Comparison to Invasive Catheterization. Journal of Cardiovascular Magnetic Resonance. (In press) 3. Varghese J, Potter LC, LaFountain R, Pan X, Raman SV, Ahmad R, Simonetti OP. CMR-based blood oximetry via multi-parametric estimation using multiple T2 measurements. Journal of Cardiovascular Magnetic Resonance 2017;19(1):88. 4. Pei M, Nguyen TD, Thimmappa ND, Salustri C, Dong F, Cooper MA, Li J, Prince MR, Wang Y. Algorithm for fast monoexponential fitting based on Auto-Regression on Linear Operations (ARLO) of data. Magnetic resonance in medicine 2015;73(2):843-850. 5. Sasse SA, Berry RB, Nguyen TK, Light RW, Kees Mahutte C. Arterial Blood Gas Changes During Breath-holding From Functional Residual Capacity. Chest 1996;110(4):958-964.Figures
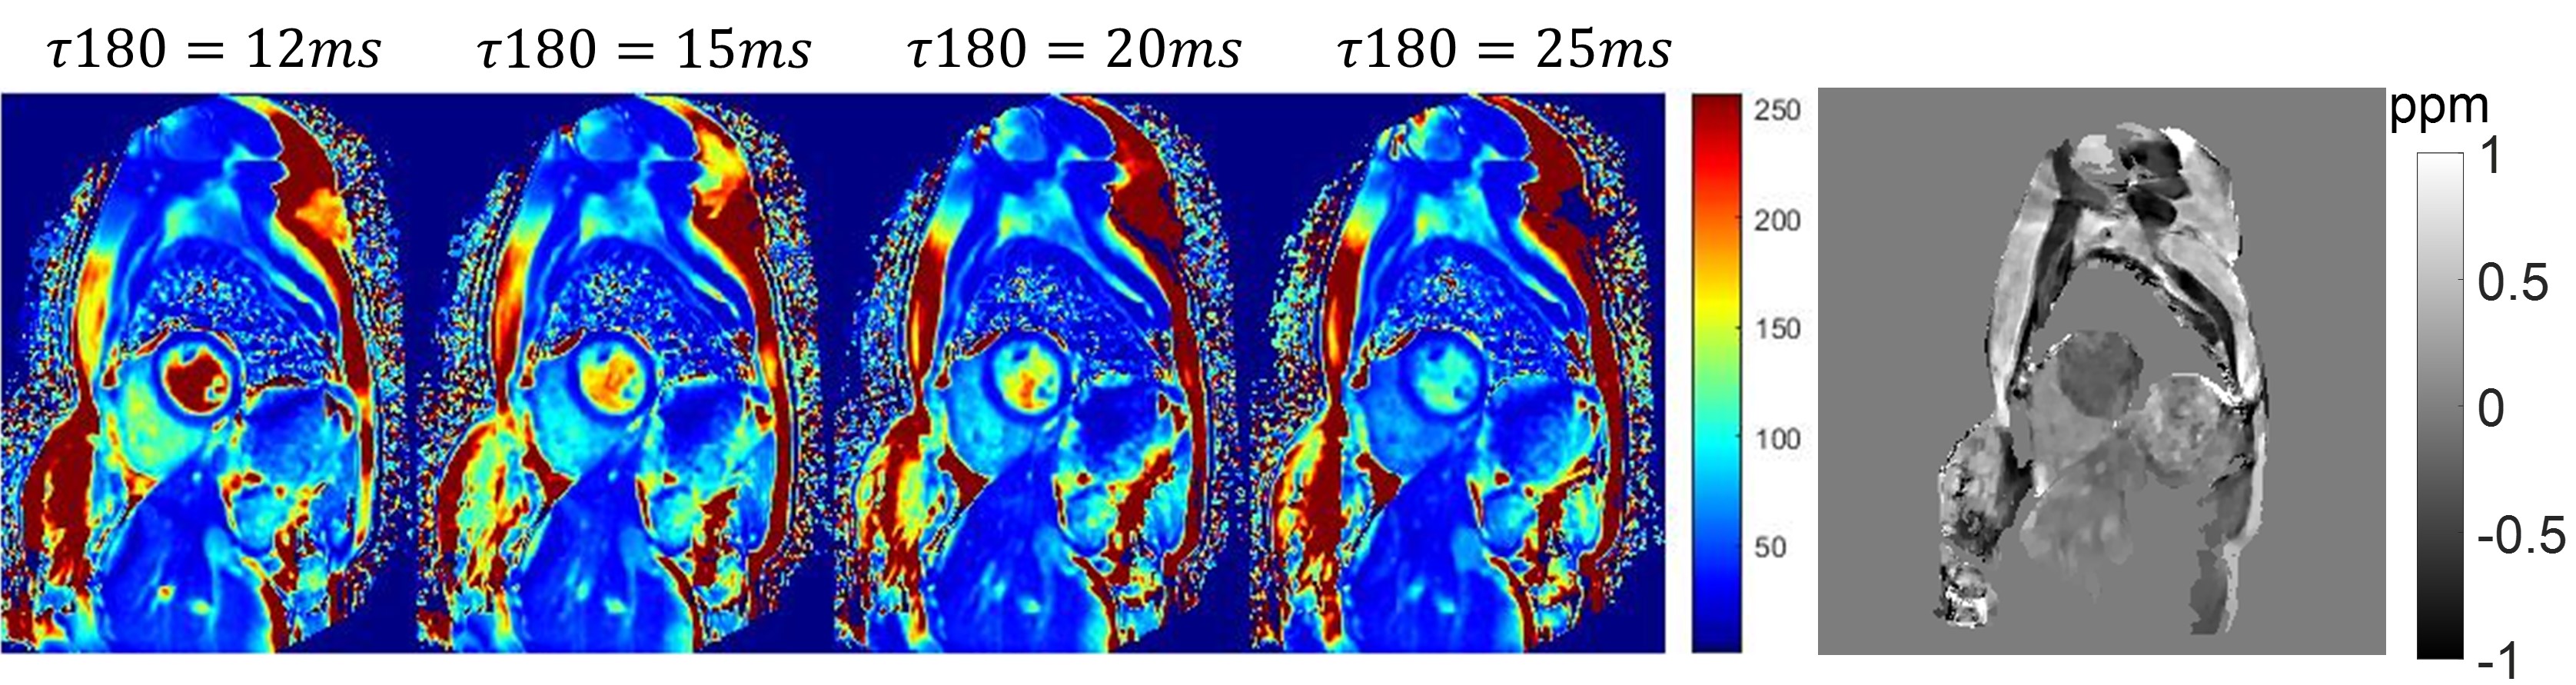
Figure 1: Top row:
the 4 T2 maps acquired with the 4 different T180 and the QSM from a
healthy volunteer.
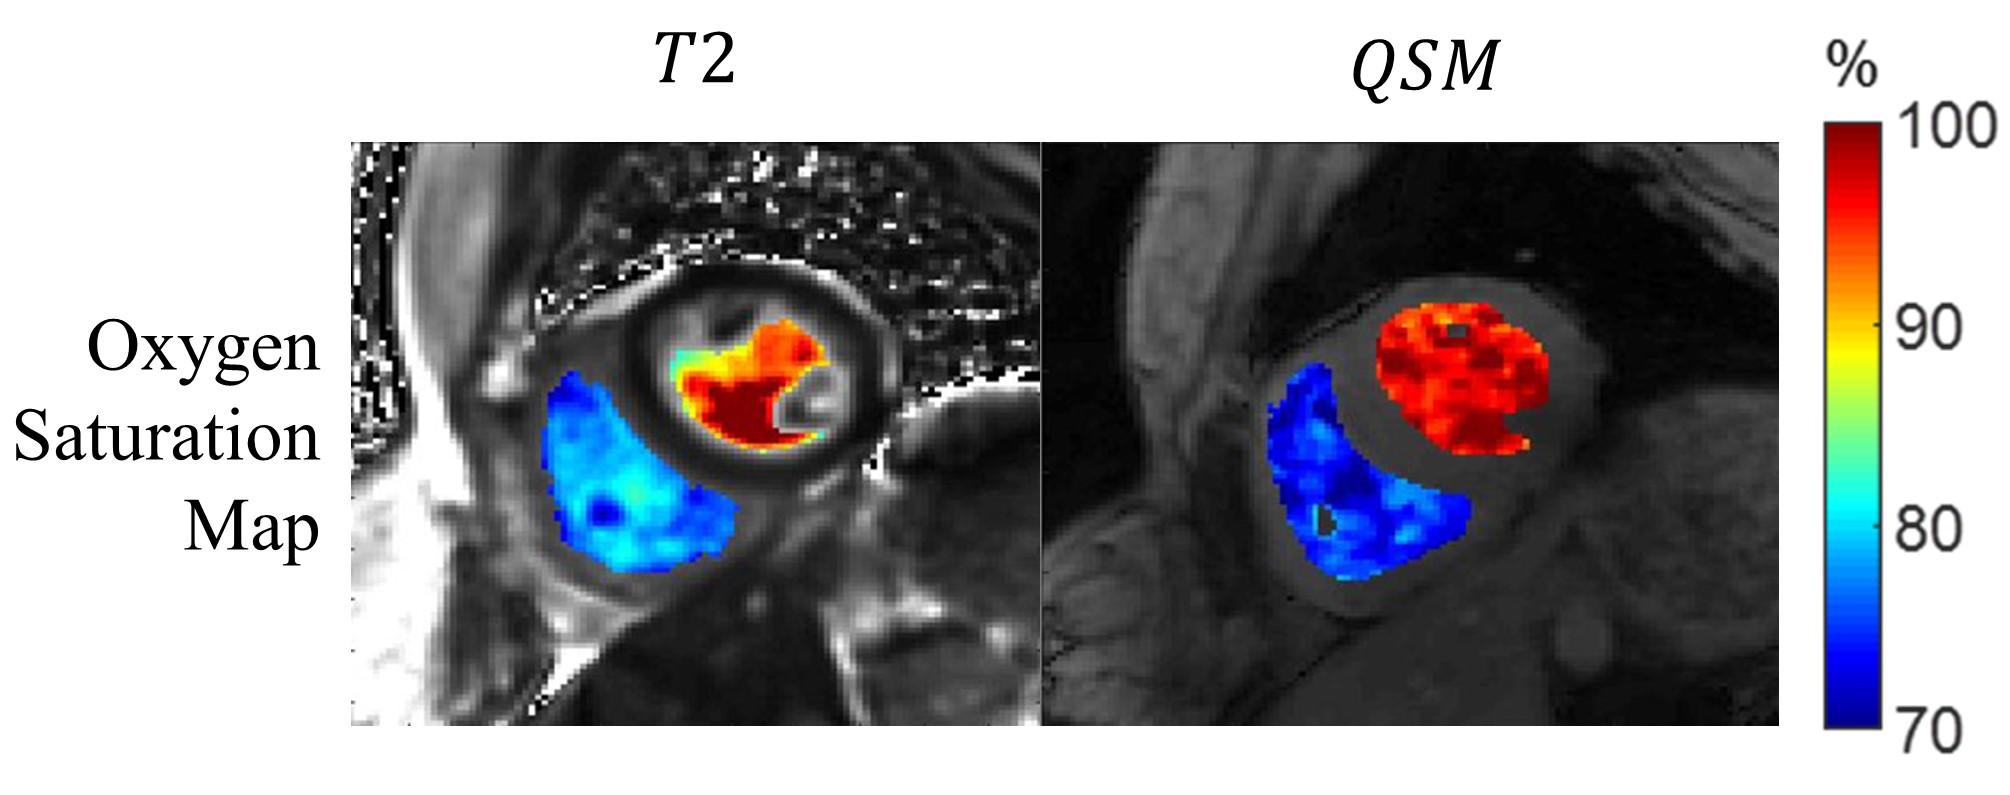
Figure 2: The
oxygen saturation map obtained from T2 and QSM.
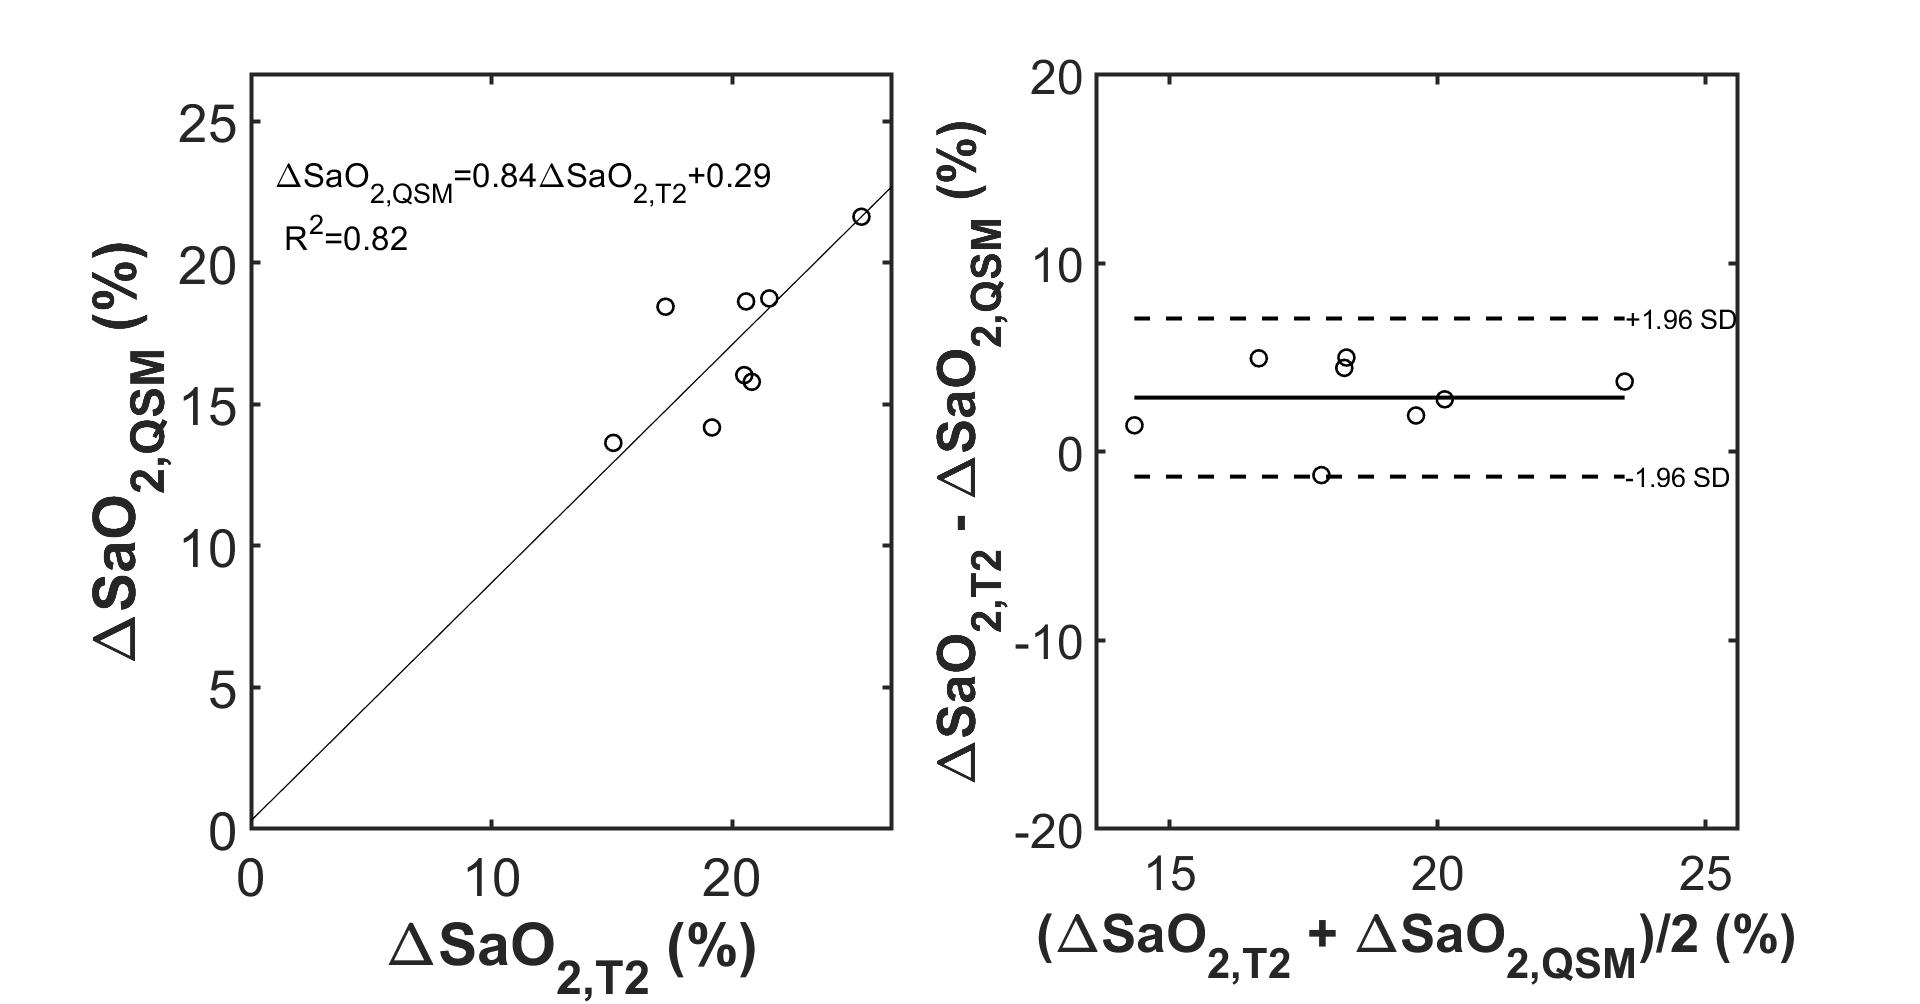
Figure 2. Scatter plot showing a linear relationship
between T2 based $$${\Delta}SaO_2$$$ and QSM
based $$${\Delta}SaO_2$$$ with good correlation. Bland Altman plots shows a small
bias between the two methods for measuring $$${\Delta}SaO_2$$$.