2233
Time-resolved tracking of the atrioventricular plane displacement in long-axis cine images with residual neural networks1Department of Radiology and Biomedical Imaging, Yale University, New Haven, CT, United States, 2Department of Electrical Engineering, Universidad de Ingenieria y Tecnologia, Lima, Peru, 3Department of Clinical Physiology, Lund University, Lund, Sweden, 4Department of Biomedical Engineering, Lund University, Lund, Sweden, 5Wallenberg Center for Molecular Medicine, Lund University, Lund, Sweden
Synopsis
Diastolic dysfunction is assessed by measurement of mitral annular (MA) early diastolic velocity (e’), commonly performed in echocardiography. Similar measurements can be obtained with valvular plane tracking in MRI long-axis cines. These measurements have been validated and have good reproducibility, yet manual MA points annotations are required. In this work we present a machine learning convolutional neural network with a residual architecture for automatic annotation of MA points in MRI long-axis cine images of the 2 and 4-chamber views. The landmark tracking allowed a fast and accurate evaluation of diastolic parameters improving the clinical applicability of MRI for diastolic assessment.
Introduction
Atrioventricular plane displacement (AVPD) measurement (Figure 1) is a clinically relevant biomarker, but not often measured by MRI. Its measurement yields peak displacement (PD) and the mitral annular (MA) early diastolic velocity (e’), a key metric of diastolic function [1]. AVPD can be employed to enable slice-following for assessment of valvular flow with a phase-contrast sequence, either retrospectively [2] or prospectively [3]. The AVPD evaluation demands a precise annotation of the MA points in cardiac MR long-axis cine images of the 2 and 4-chamber views. However, manual annotation is time-consuming, laborious and prone to errors, even with significant improvements in speed and accuracy by feature tracking [4]. A fully automated, fast, and accurate method for AVPD tracking is lacking. In this study we have developed a machine learning approach for MA point tracking. We hypothesized that the derived clinical parameters obtained with automated valve tracking would be comparable to those obtained with manual annotations.Methods
One hundred patients (33 females, age 52±14 years), scanned on a 1.5T clinical scanner (Siemens Healthcare, Erlangen) for diverse clinical indications were retrospectively enrolled in an IRB-approved study. CMR images were acquired with a balanced steady-state-free-precession (bSSFP) sequence with 30 timeframes per cardiac cycle, spatial resolution was 2 x 2 x 8 mm3, TR / TE / Θ: 3ms / 1.5ms / 60°. The software Segment [4] was used to manually annotate the mitral annular points in all patient data as a reference.A convolutional neural network (CNN) with a residual network of 50 layers (ResNet50) [5], with 25.5 million parameters, was adapted to perform a regression task for both points in each image (Figure 2), using MATLAB’s deep learning toolbox. The method uses two trained networks and follows a 2-step deep learning pipeline (Figure 3). Step 1 uses a trained network to predict the MA points in the first timeframe of the cine series, with an accuracy sufficient to use the MA locations to reorient the long-axis cines into a standardized orientation, as part of the pre-processing. Step 2 uses a trained network to locate the MA points in all pre-processed frames, with a high accuracy, which are then reconverted to their original coordinates. Eighty-four patients were used for training and validation of the two networks, and 16 patients were used for testing. In addition to reorientation, pixel intensities were normalized with median and interquartile range. Training data augmentation was performed 10 times by scaling ±10%, rotating ±10° and translating ±3 pixels. PD and e’ were obtained from the AVPD curves as previously described [1].
Results
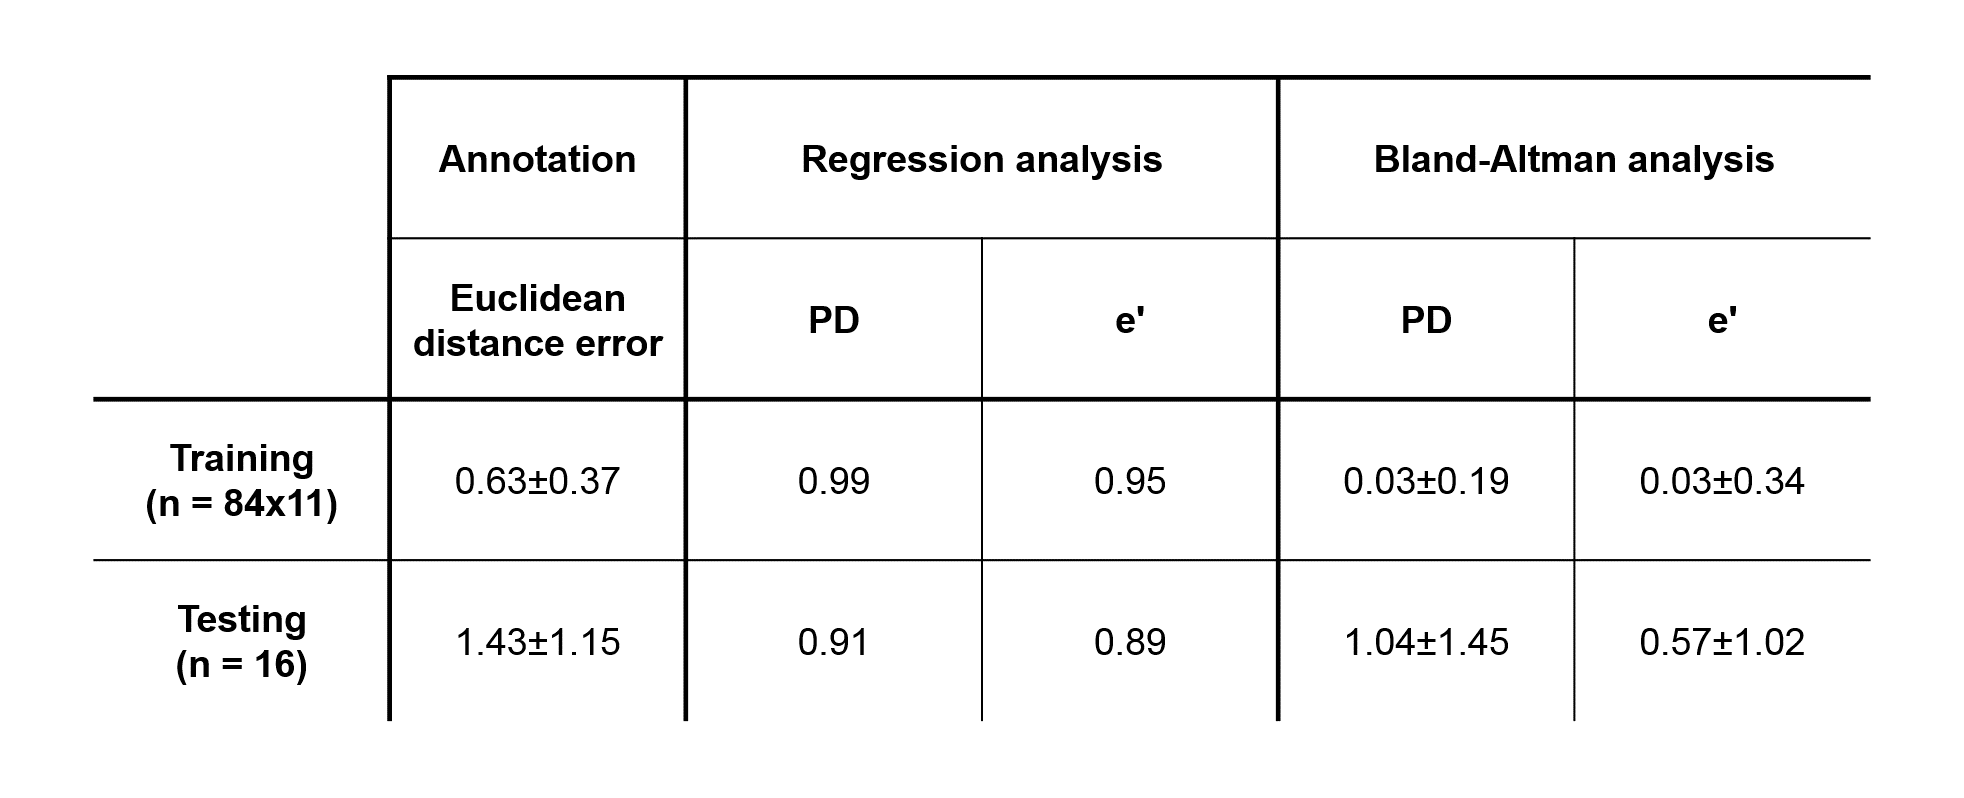
Figure 3 presents the algorithm results in one subject. Overall, the differences between the proposed method and ground truth annotations were (mean±2SD) 1.04±1.45 mm (R = 0.91) and 0.57±1.02 cm/s (R = 0.89), for PD and e’, respectively. The regression and Bland-Altman plots are shown in Figure 4. Table 1 further displays the Euclidean distance error for each point in both two and four chamber views. Training of each ResNet50 took 6 hours for 5 epochs. Automatic MA points tracking of a dataset took around 1 second, as compared to approximately 20 minutes for manual annotation.Discussion and Conclussion
The proposed machine learning method, trained with 84 patient cine data sets, allowed a fast and accurate tracking of the MA points even in subtle changes, relevant for velocity analysis, that are difficult to manually track. Quantitative analysis using derived clinical parameters and Euclidean distance error showed that the agreement between predicted and manual annotations was good and on par with human level performance. MA tracking on 2 and 4-chamber cines showed similar accuracy. Future work would include more data, and a hybrid model with a recurrent network architecture, to learn time dependency. In conclusion, a machine learning approach for automatic delineation of MA points for AVPD evaluation in CMR long-axis cine images was developed. The method is able to carefully track these points with high accuracy and in a timely manner. This will improve the feasibility of MRI methods which rely on valve tracking, such as measurement of e’, or slice-following phase-contrast, and increase their utility in a clinical setting.Acknowledgements
No acknowledgement found.References
1. Seemann F, Baldassarre LA, Llanos‐Chea F, Gonzales RA, Grunseich K, Hu C, Sugeng L, Meadows J, Heiberg E, Peters DC. Assessment of diastolic function and atrial remodeling by MRI–validation and correlation with echocardiography and filling pressure. Physiological reports. 2018 Sep;6(17):e13828.
2. Roes SD, Hammer S, van der Geest RJ, Marsan NA, Bax JJ, Lamb HJ, Reiber JH, de Roos A, Westenberg JJ. Flow assessment through four heart valves simultaneously using 3-dimensional 3-directional velocity-encoded magnetic resonance imaging with retrospective valve tracking in healthy volunteers and patients with valvular regurgitation. Investigative radiology. 2009 Oct 1;44(10):669-75.
3. Seemann F, Heiberg E, Carlsson M, Gonzales RA, Baldassarre LA, Qiu M, Peters DC. Valvular imaging in the era of feature‐tracking: A slice‐following cardiac MR sequence to measure mitral flow. Journal of Magnetic Resonance Imaging. 2019 Oct.
4. Seemann F, Pahlm U, Steding-Ehrenborg K, Ostenfeld E, Erlinge D, Dubois-Rande JL, Jensen SE, Atar D, Arheden H, Carlsson M, Heiberg E. Time-resolved tracking of the atrioventricular plane displacement in Cardiovascular Magnetic Resonance (CMR) images. BMC medical imaging. 2017 Dec;17(1):19.
5. Heiberg E, Sjögren J, Ugander M, Carlsson M, Engblom H, Arheden H. Design and validation of Segment-freely available software for cardiovascular image analysis. BMC medical imaging. 2010 Dec;10(1):1.
6. He K, Zhang X, Ren S, Sun J. Deep residual learning for image recognition. In Proceedings of the IEEE conference on computer vision and pattern recognition 2016 (pp. 770-778).
Figures