2230
A Machine Learning Approach to Left Ventricle Mesh Prediction from Multi-Slice MR Images1Institute for Biomedical Engineering, University and ETH Zurich, Zurich, Switzerland
Synopsis
There has been considerable success applying deep learning to cardiac MRI segmentation. However, segmentation masks have several shortcomings. In particular, they are discrete (voxel-based) representations of continuous anatomy, and are hence not suitable for use in biomechanical simulation. Mesh representations can potentially overcome both of these drawbacks. We demonstrate an approach to predicting left-ventricular (LV) meshes from short-axis MR images. The proposed approach: (i) works robustly on data with differing slice numbers, slice thicknesses, and left-ventricular coverage, (ii) has no test-time optimisation loop, but rather directly predicts the mesh from a mask, and, (iii) generalises to real data with pathology.
Introduction
Many methods exist for producing voxalised segmentation masks. Here we focus instead on predicting shape meshes, which are continuous, and therefor suitable for use in biomechanical simulation. Such simulation of the heart has significant potential, especially if patient-specific models can be easily created. Extracting accurate simulation-ready meshes from cardiac MR images is a key step in the progression towards personalised cardiac healthcare. Previous work1 has shown the potential for cardiac mesh prediction using neural networks. However, here we are interested in predicting a volumetric meshes suitable for biomechanical simulation. Additionally, we explicitly consider multi-slice data, partial ventricle coverage, and explore generalisation to real (pathological) data.Methods
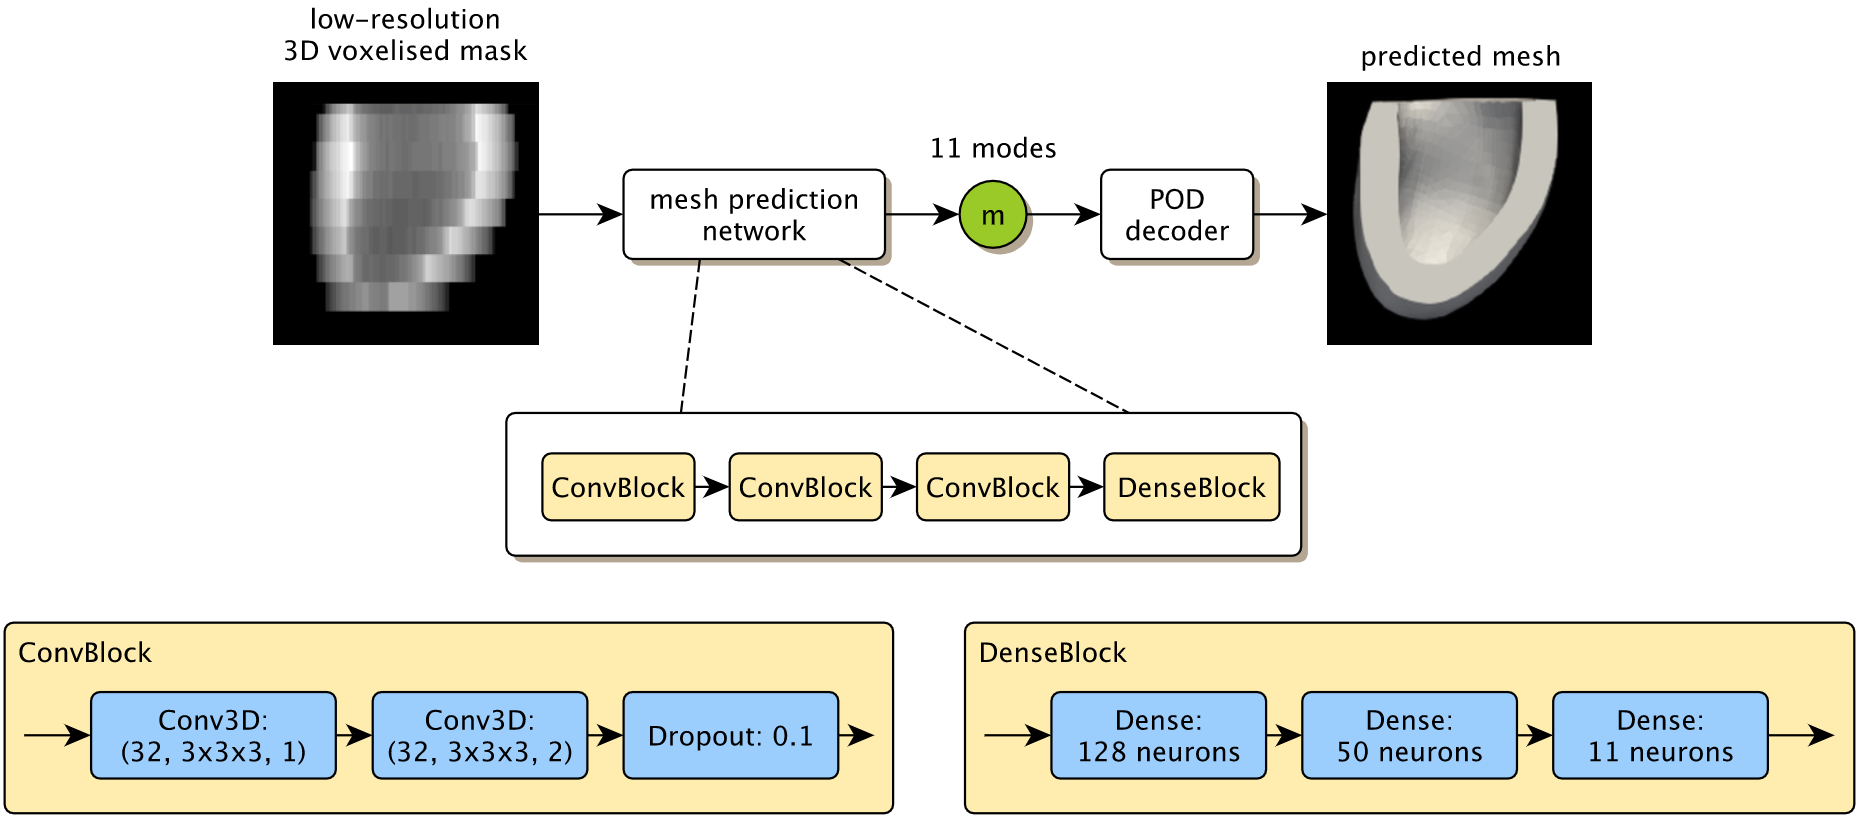
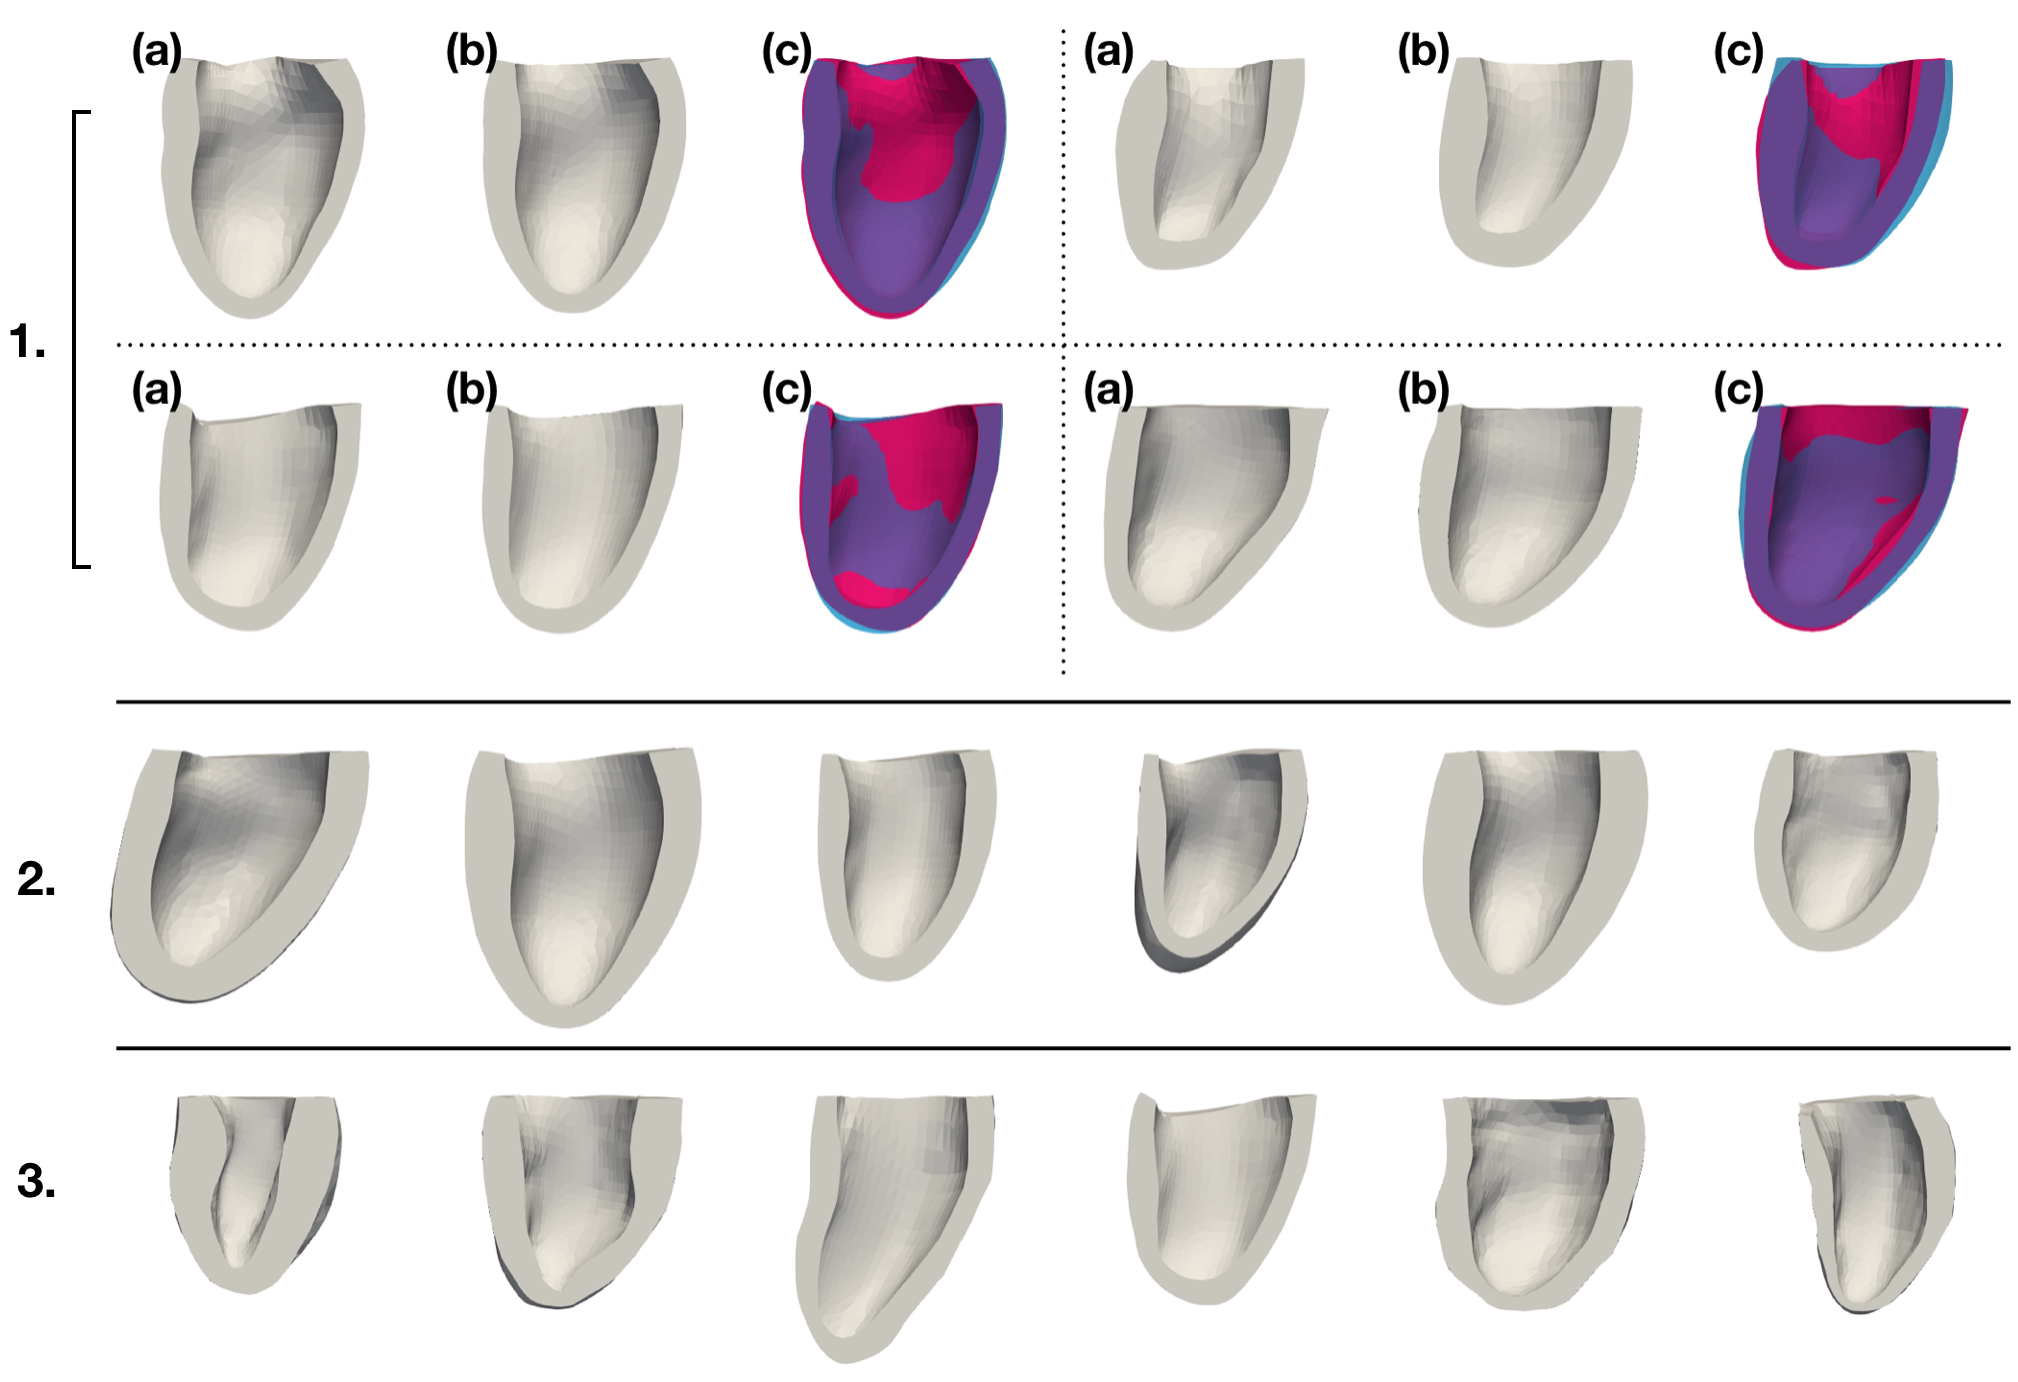
As existing segmentation methods already produce high-quality mask predictions, we propose a network to predict meshes directly from voxalised mask data (Fig.1). For mesh representation we use a volumetric mesh suitable for simulation composed of 6066 points with a fixed connectivity. As previously demonstrated2 we use Proper Orthogonal Decomposition (POD) to define 11 'modes' that capture the expected variation of cardiac shapes to within approximately 2mm accuracy. Our network predicts the weights of these 11 modes, which we then convert to a cardiac mesh with the POD model.We make use of the MMWHS dataset3-5 which provides 40 labelled 3D cardiac volumes (20 MR, 20 CT). We take the myocardium mask from 35 of these volumes (five volumes were not usable due to quality) and cut them below the outflow tract of the LV with a plane parallel to the mitral valve. Then a reference mesh is registered into all shapes using an approximation of prolapse ellipsoid coordinate system6. We apply POD to all meshes, and retain 11 modes. Example reconstructions of the meshes using the POD model are shown in Fig.2.1. As can be seen the 11-mode POD is able to accurately capture the myocardium shape.
We use two approaches to expand out training set. Firstly, by sampling from a generative model obtained by fitting a Gaussian distribution to the modes of the original 35 meshes (Fig.2.2). We create the corresponding mask by "filling" the mesh and rendering it to a voxelized grid. We call this the "synthetic data". Secondly, we apply augmentation to the 35 original shapes. We perform heuristic warping/scaling on the meshes (and their masks), then recalculate the modes for the deformed mesh. These modes then serve as the labels for the deformed mask. We call this the "augmented data".
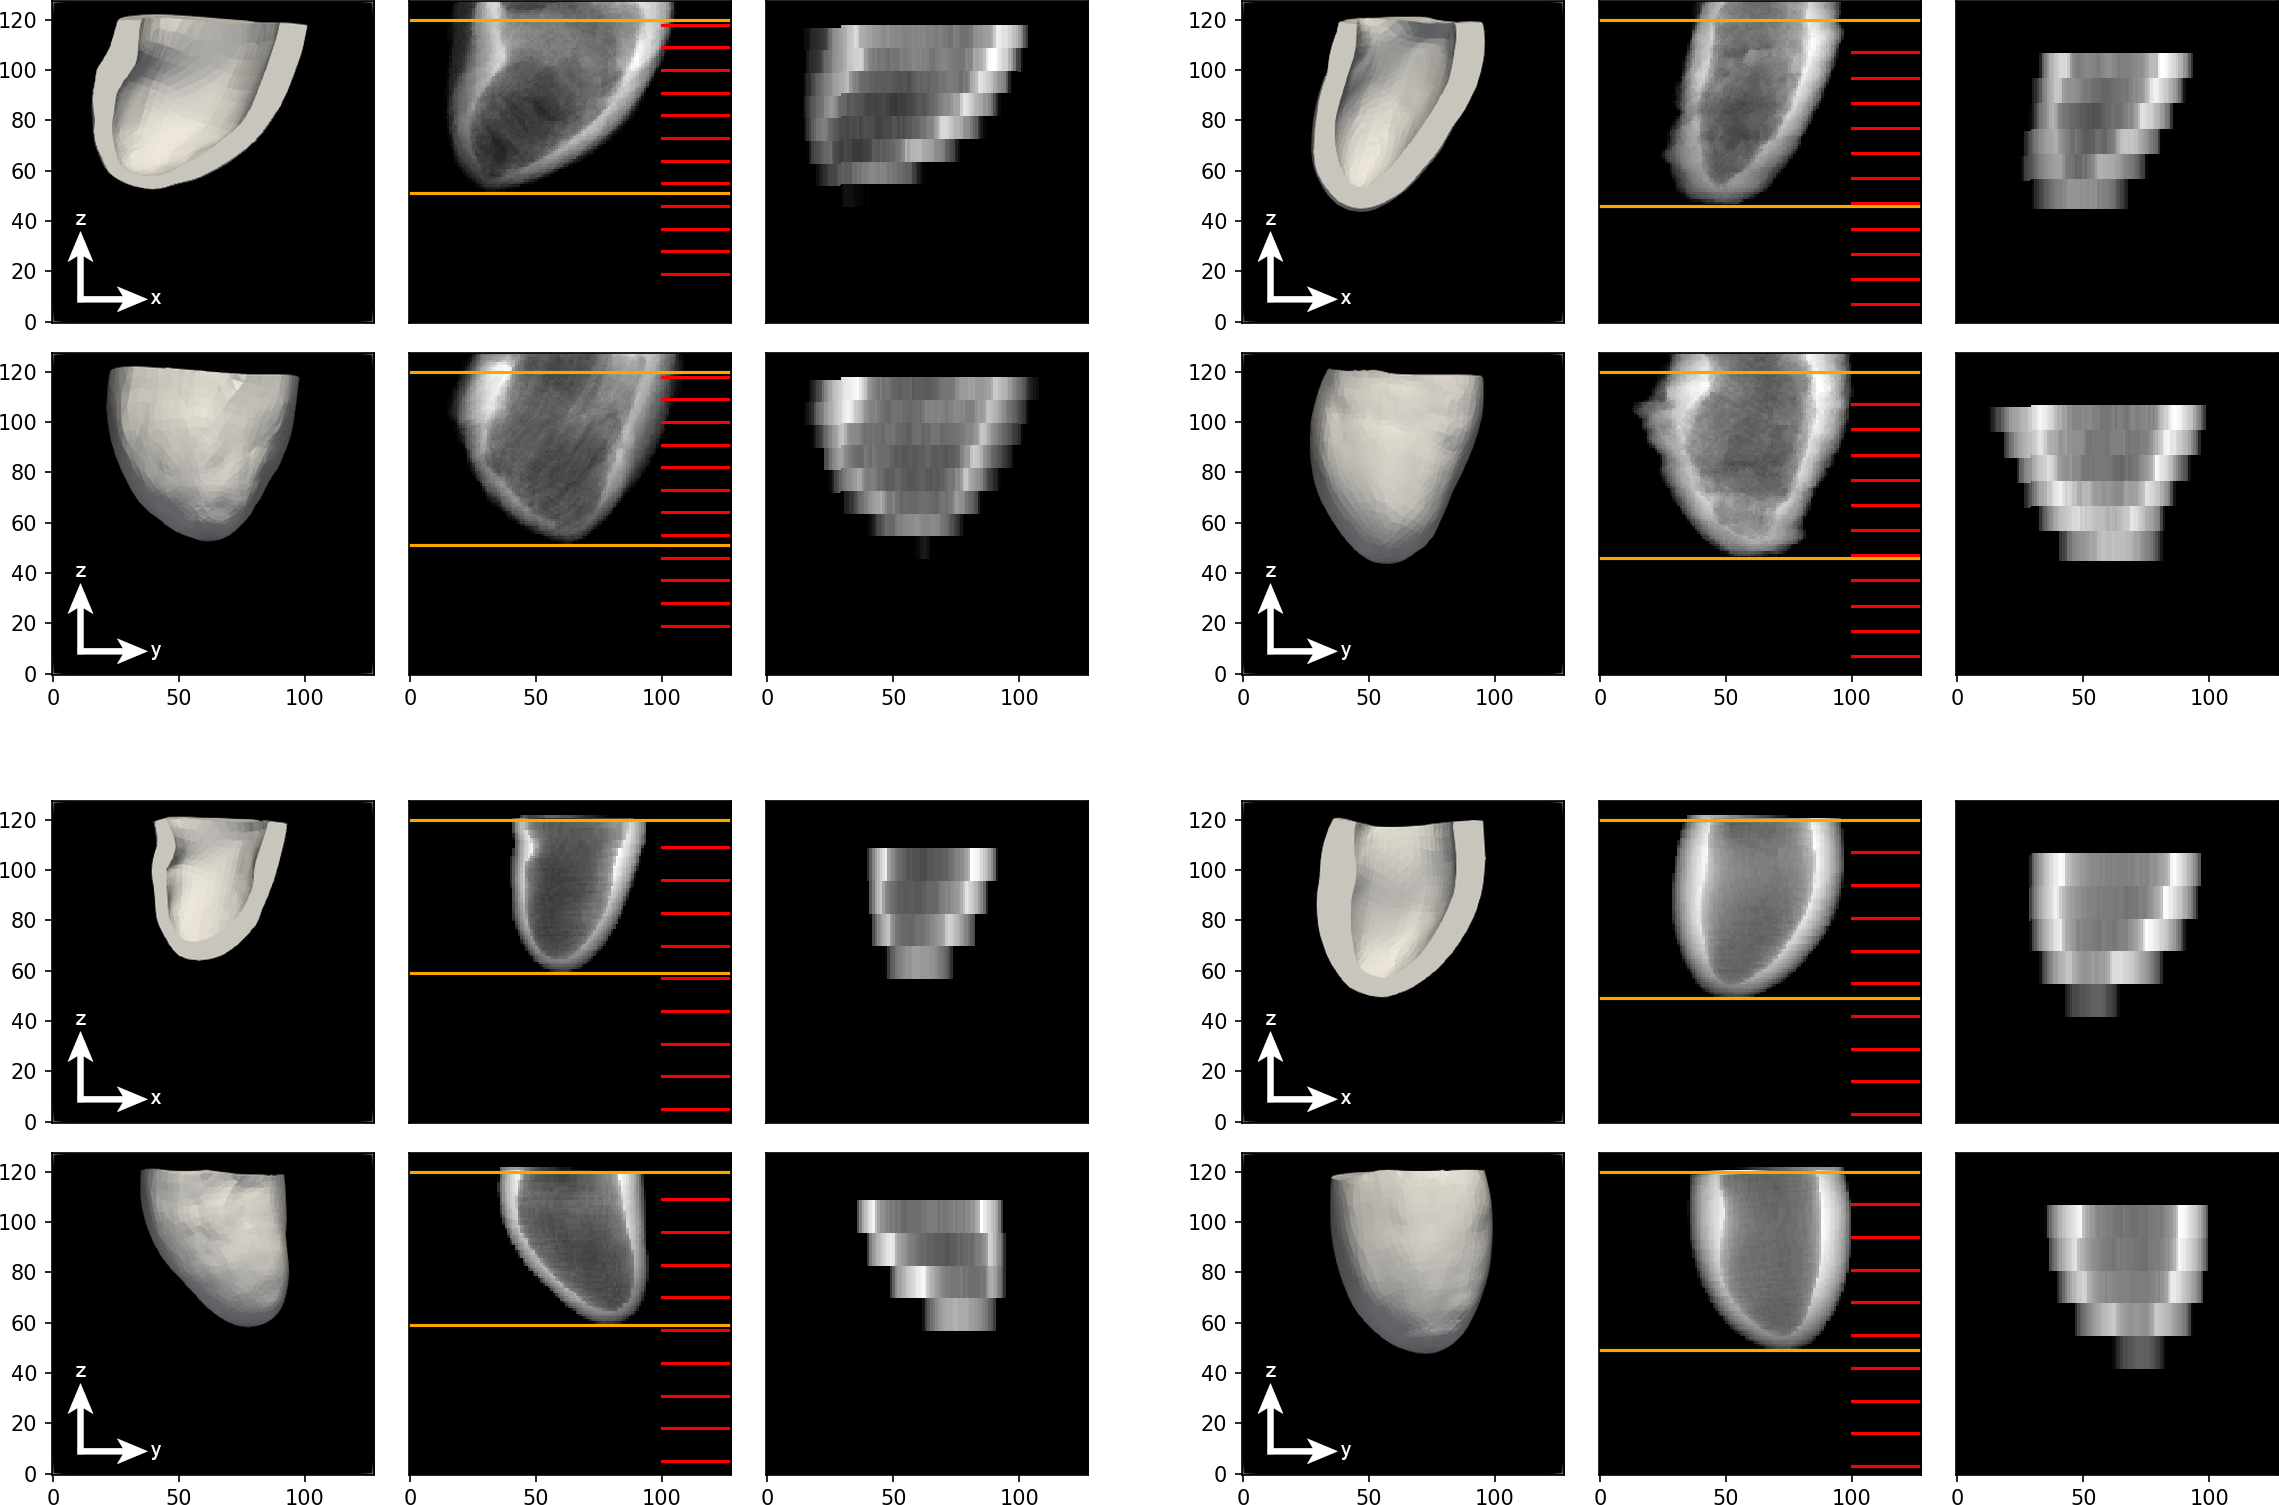
Using both approaches we generate 2800 diverse high resolution masks, all of size 128×128×128 with 1mm isotropic resolution. We then artificially down-sample the data in the long axis direction, choosing a random number of slices (5-12), slice thicknesses (8-14mm), and initial slice position. We only allow combinations of these choices that result in at least 75% ventricle coverage in the down-sampled image. This process results in varied mask volumes, however the number of long axis slices and the z-resolution differ between masks. To create a standardised input for the network we up-sample the low resolution masks to 32 4mm slices. Examples are shown in Fig.3.
Our network architecture is shown in Fig.1. The architecture was designed with few weights to alleviate over-fitting issues. The exact architecture and hyper-parameters were chosen through a simulated annealing7 inspired parameter search (evaluating on validation data). The final network was trained for 40 epochs using Adam8 to minimise the mean-squared-error (MSE) between the ground truth and predicted mesh (although the network only predicts the modes, mesh reconstruction using the POD was performed inside the loss function).
Results
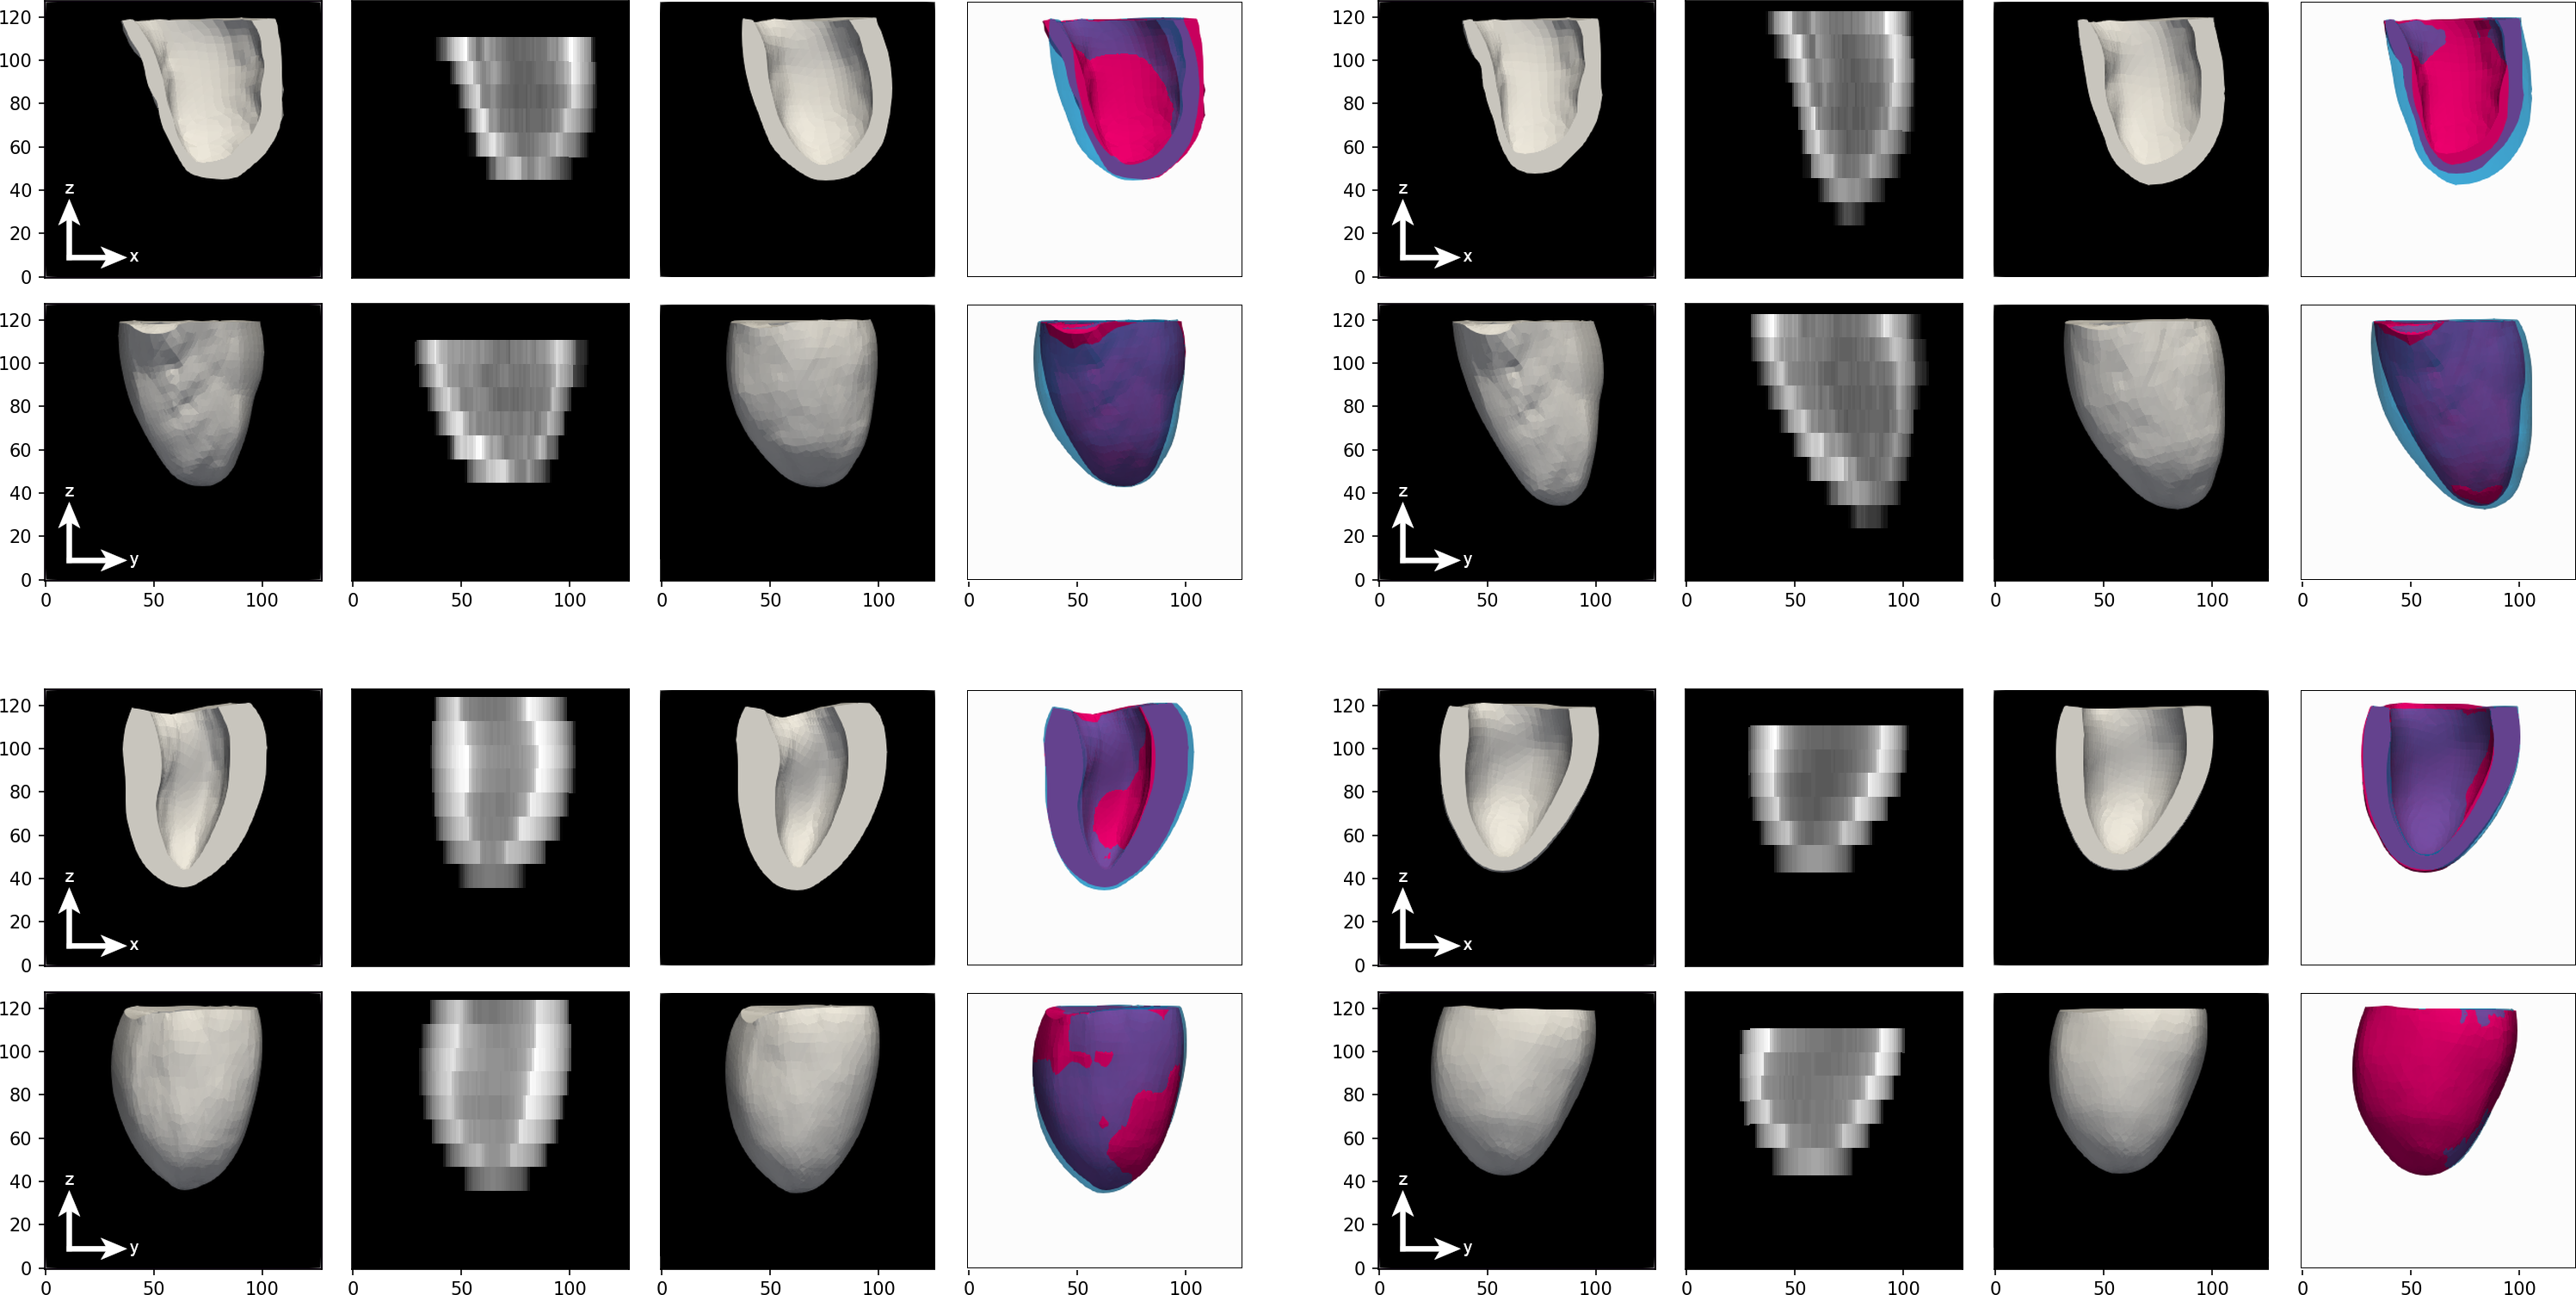
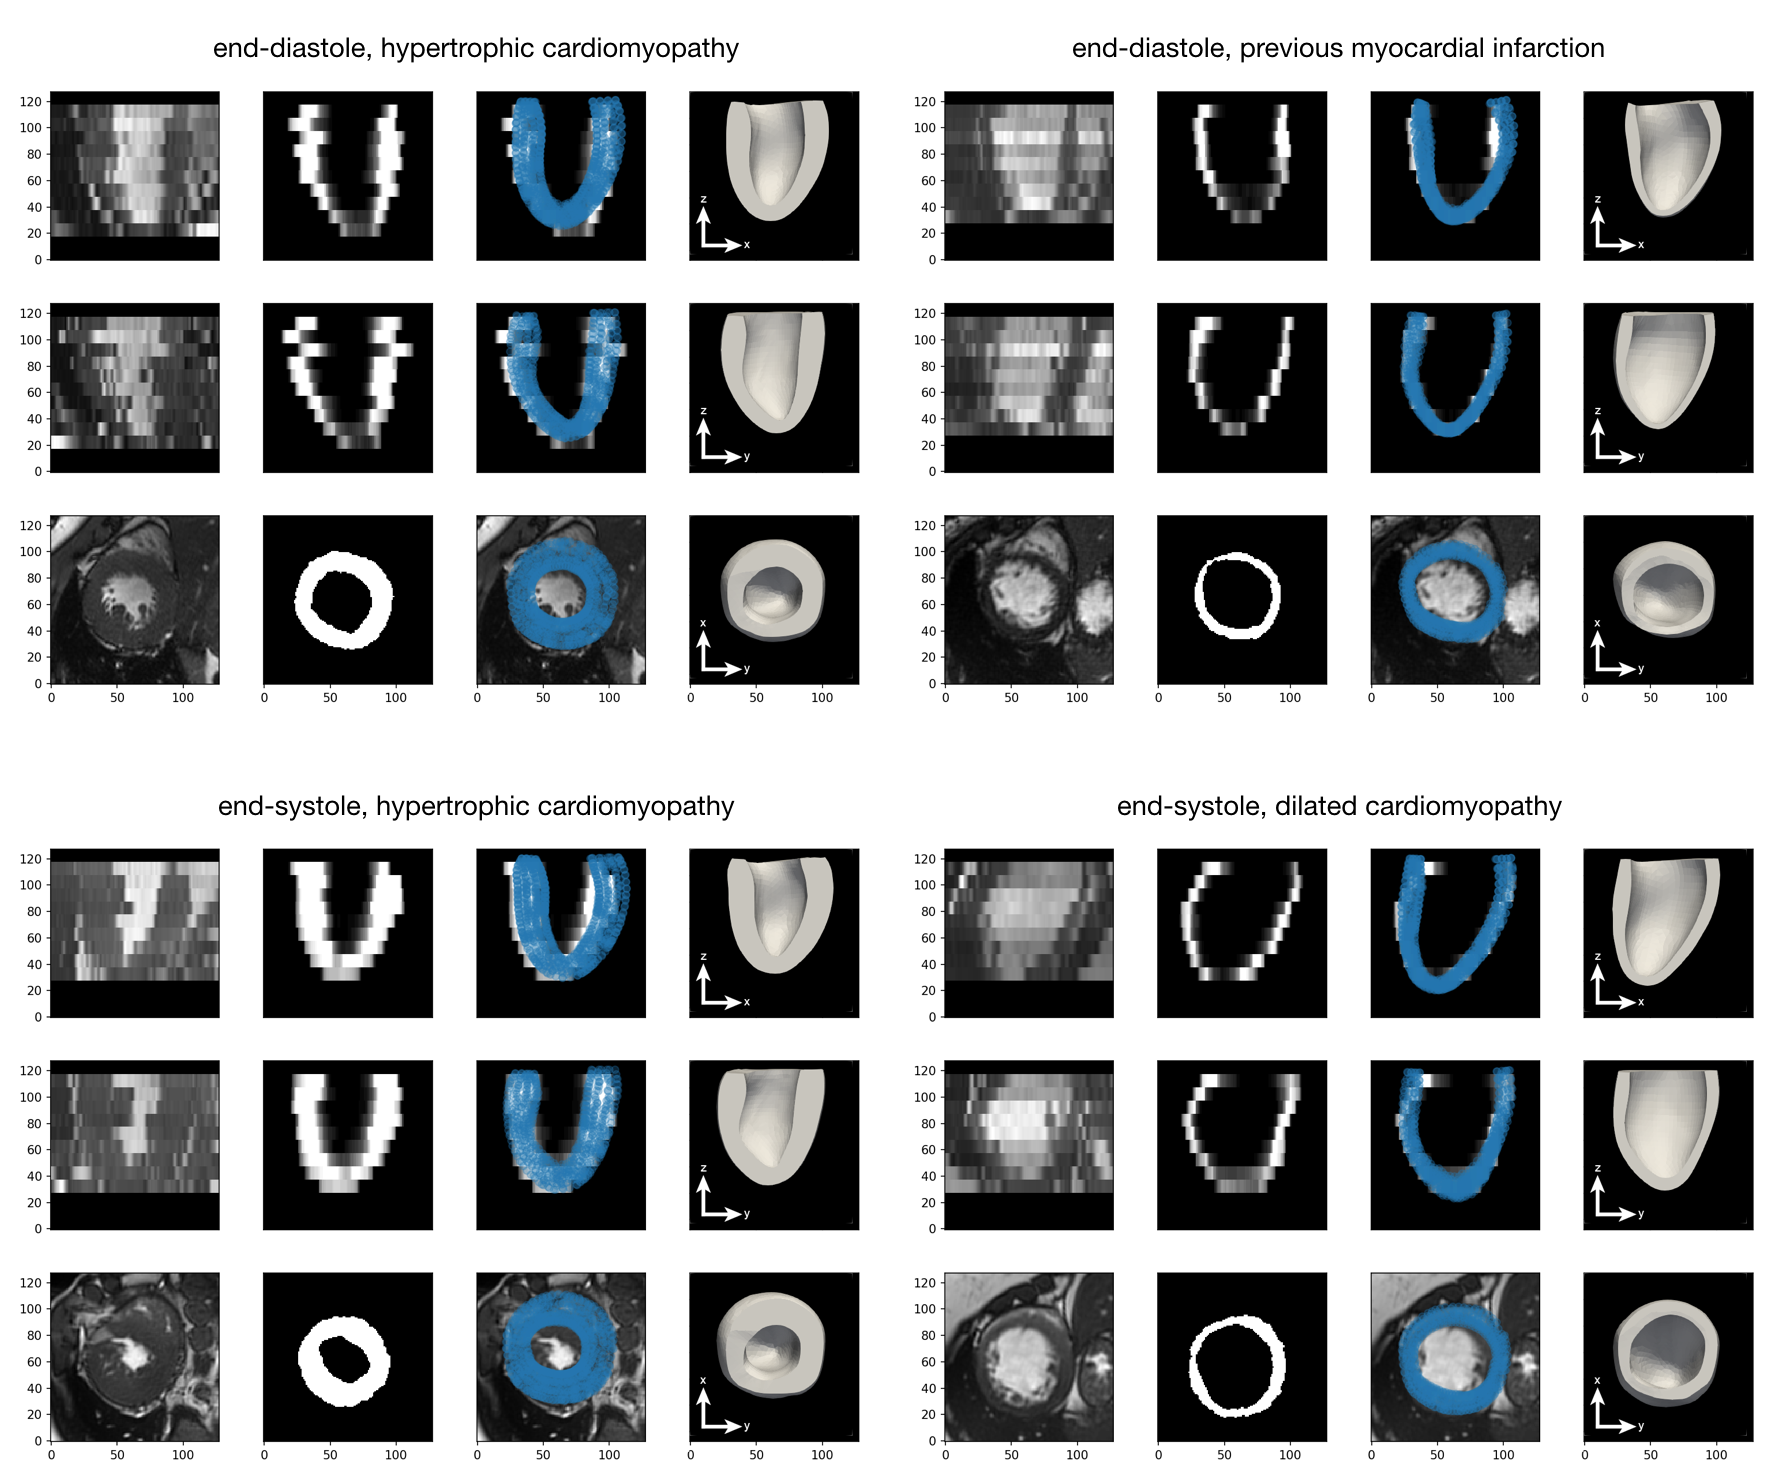
The network takes 30 minutes to train on a single GPU. We tested the network on a held-out test sets of augmented and synthetic data, achieving an average MSE of 10.06mm and 6.69mm respectively. Thus, the average mesh point was approximately 3.2mm (2.6mm) away from the ground truth. However, as can be seen in the qualitative results, the errors are not uniformly distributed, but rather tend to occur at the base or apex. Examples predictions are shown in Fig.4. To evaluate generalisation performance of our approach we also tested the model on the ACDC dataset9, which consists of short-axis MRI from 100 patients with varying cardiac conditions. The lack of ground truth meshes and presence of slice misalignment make quantitative evaluation hard for this dataset, thus we give qualitative examples in Fig.5.Discussion and Conclusion
Our results demonstrate the potential for fast, resolution agnostic prediction of meshes suitable for simulation. Specifically, a model trained from a small number of cardiac shapes (35) can produce accurate mesh predictions for both synthetic and real data. Moreover, we have shown that the model is robust to slice misalignment and abnormal cardiac morphologies, neither of which were seen during training. Accurate mesh prediction opens a number of research directions: For example, the model can be directly extended to produce a probability distribution over meshes, rather than a single prediction, allowing characterisation of the uncertainty. Further, exploration with the model could allow a quantitative characterisation of the relationship between ventricle coverage, slice thickness, number of slices, and mesh prediction accuracy.Acknowledgements
No acknowledgement found.References
- Xu H, Zacur E, Schneider JE, Grau V. Ventricle Surface Reconstruction from Cardiac MR Slices Using Deep Learning. InInternational Conference on Functional Imaging and Modeling of the Heart 2019 Jun 6 (pp. 342-351). Springer, Cham.
- Buoso S, Manzoni A, Alkadhi H, Plass A, Quarteroni A, Kurtcuoglu V. Reduced-order modeling of blood flow for noninvasive functional evaluation of coronary artery disease. Biomechanics and Modeling in Mechanobiology. 2019 Jun 19:1-5.
- Zhuang X, Shen J. Multi-scale patch and multi-modality atlases for whole heart segmentation of MRI. Medical image analysis. 2016 Jul 1;31:77-87.
- Zhuang X. Challenges and methodologies of fully automatic whole heart segmentation: a review. Journal of healthcare engineering. 2013;4(3):371-407.
- Zhuang X, Rhode KS, Razavi RS, Hawkes DJ, Ourselin S. A registration-based propagation framework for automatic whole heart segmentation of cardiac MRI. IEEE transactions on medical imaging. 2010 Apr 8;29(9):1612-25.
- Doste R, Soto-Iglesias D, Bernardino G, Sebastian R, Giffard-Roisin S, Cabrera-Lozoya R, Sermesant M, Berruezo A, Sánchez-Quintana D, Camara O. A rule-based method to model myocardial fiber orientation for simulating ventricular outflow tract arrhythmias. InInternational Conference on Functional Imaging and Modeling of the Heart 2017 Jun 11 (pp. 344-353). Springer, Cham.
- Van Laarhoven PJ, Aarts EH. Simulated annealing. In Simulated annealing: Theory and applications 1987 (pp. 7-15). Springer, Dordrecht.
- Kingma DP, Ba J. Adam: A method for stochastic optimization. arXiv preprint arXiv:1412.6980. 2014 Dec 22.
- Bernard O, Lalande A, Zotti C, Cervenansky F, Yang X, Heng PA, Cetin I, Lekadir K, Camara O, Ballester MA, Sanroma G. Deep learning techniques for automatic MRI cardiac multi-structures segmentation and diagnosis: Is the problem solved?. IEEE transactions on medical imaging. 2018 May 17;37(11):2514-25.
Figures