2220
Evaluation of carotid lumen segmentation on bifurcation geometry quantification1Department of Biomedical Engineering, Beijing Institute of Technology, Beijing, China, 2Tsinghua University, Beijing, China, 3Fujian Medical University Union Hospital, Fujian, China
Synopsis
To evaluate carotid lumen segmentation results on bifurcation geometry quantification, bifurcation angle and mean centerline distance were calculated. The intra-class correlation coefficient (ICC), linear regression and Bland-Altman plot of bifurcation angle, as well as the mean centerline distance indicated that the segmentation results had strong correlation with golden standard. The segmentation results could be used on geometry quantification.
Introduction
Geometric characteristics of carotid artery, which play important roles in local hemodynamic analysis, are closely associated with progression of atherosclerotic disease.1 Time-of-flight MR angiography (TOF-MRA) has been validated as an efficient imaging technique in evaluation of vascular morphology. Accurate evaluation of morphological changes at carotid artery relies on precise delineation of lumen contour in TOF-MRA.2 A semi-automatic method for segmentation of carotid artery has been developed using a modified level set with adaptive threshold (DATLS).3 This study investigated the feasibility of DATLS on geometry quantification of carotid artery.Methods
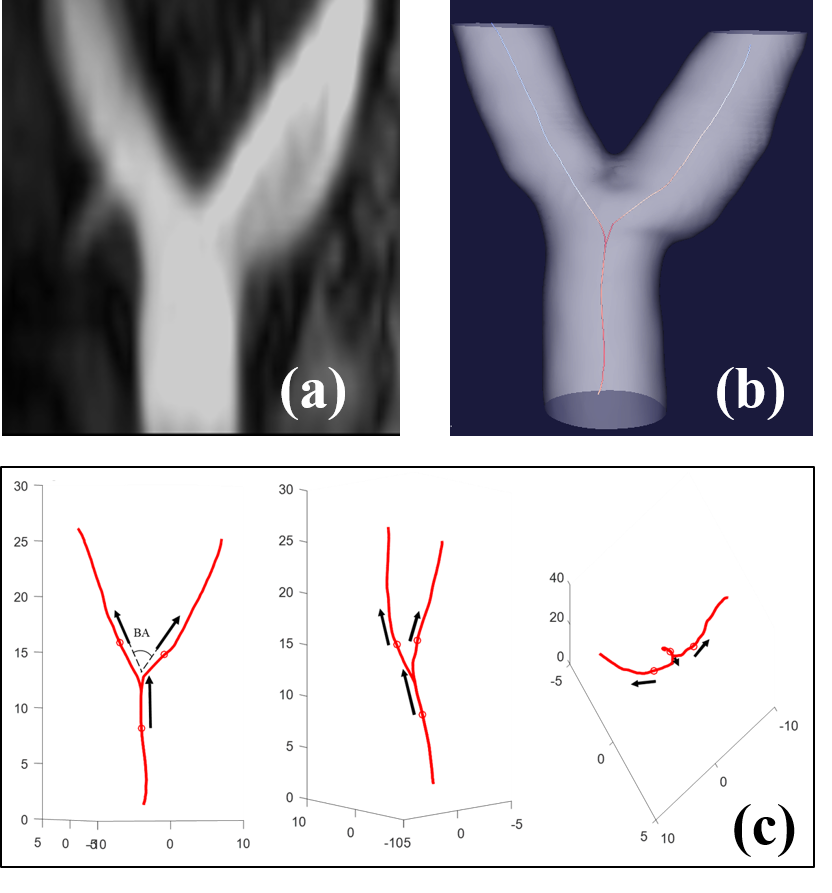
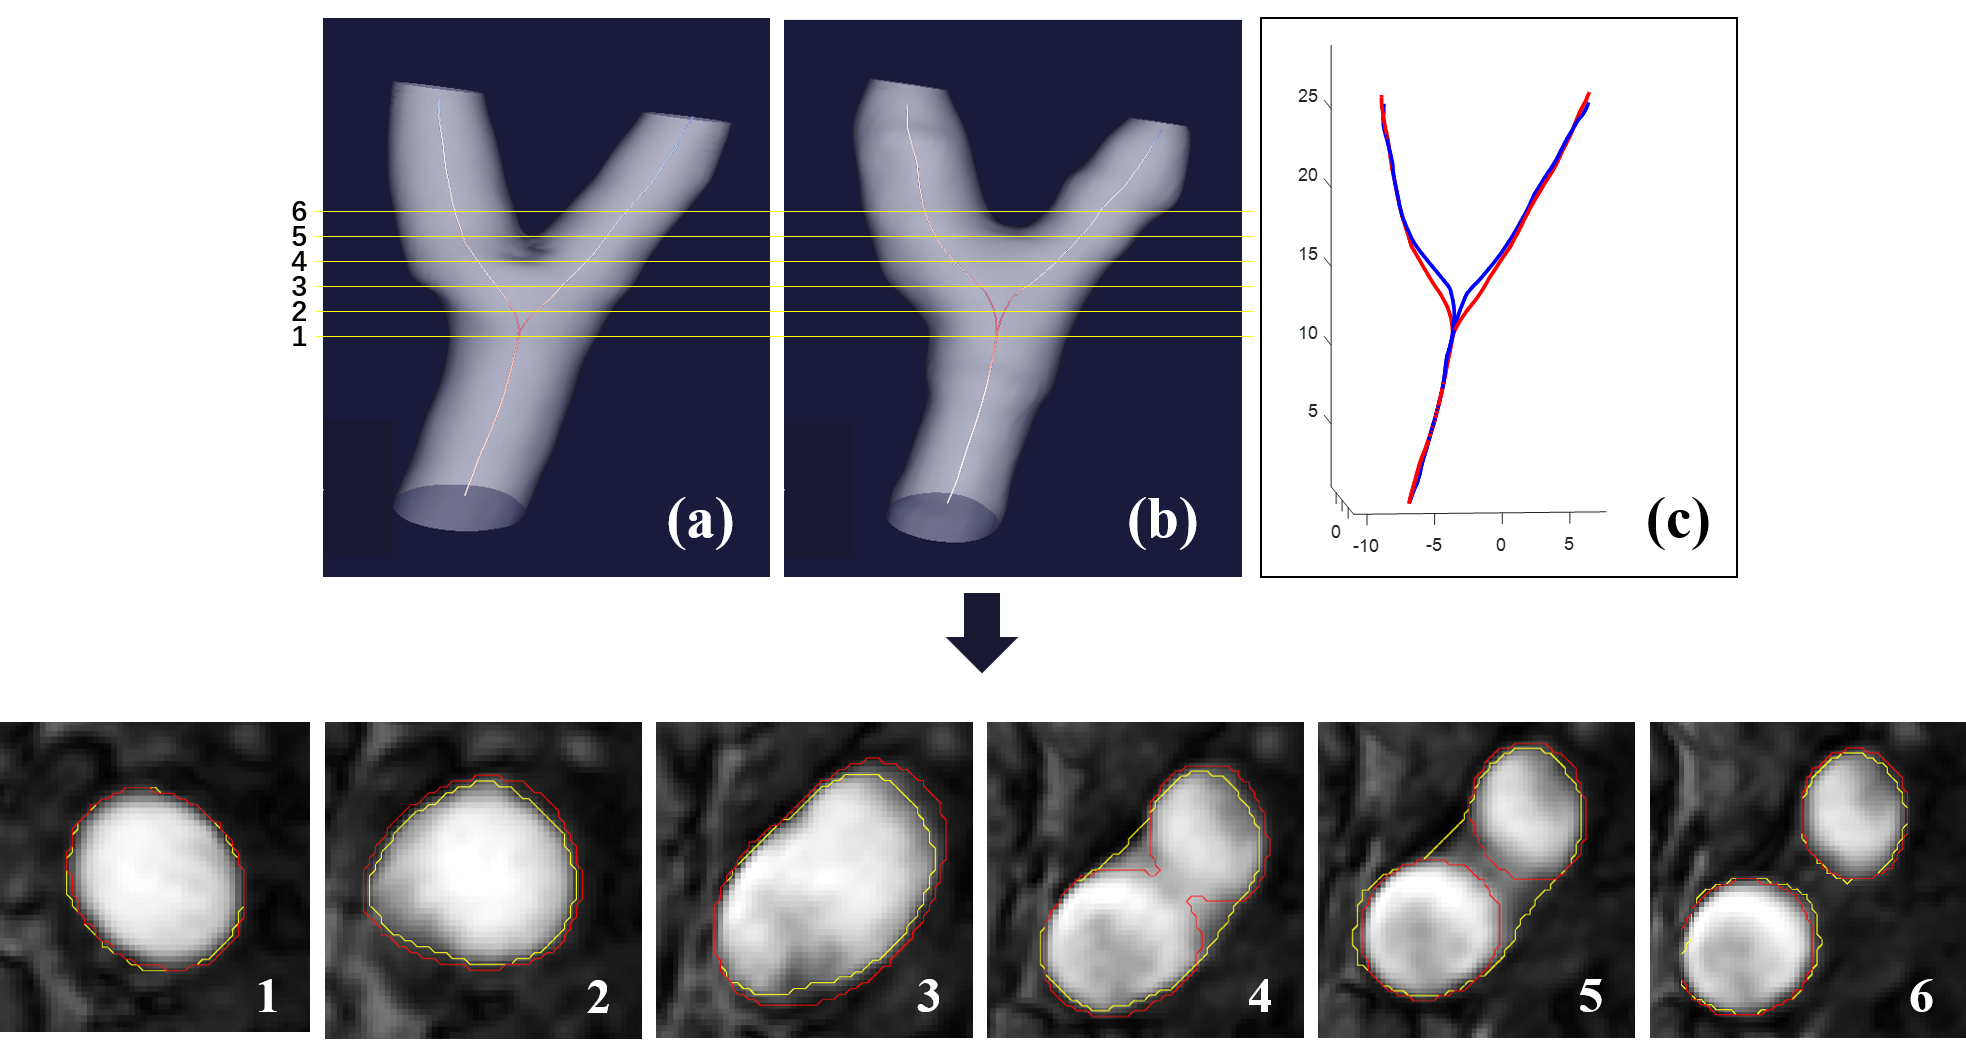
Dataset: A total of 283 carotid arteries from a study of Chinese Atherosclerosis Risk Evaluation (CARE II) were analyzed.4 All images were acquired on 3.0 Tesla MR scanner in accordance to a standard protocol. Data Analysis: In each carotid artery, lumen contour was segmented using DATLS. Centerline and bifurcation angle (BA) were calculated using VMTK (Version 1.3). The lumen contours of each carotid artery manually delineated by two experienced radiologists were considered as golden standard for validation. Statistical analysis: Dice Similarity Coefficient (DSC), Mean Contour Distance (MCD_contour) and Hausdorff Distance (HD) were used to evaluate the segmentation accuracy of DATLS. Mean Centerline Distance (MCD_centerline) was calculated to evaluate centerlines extraction. For BA evaluation, Intra-class correlation coefficient (ICC) among different groups was analyzed, and Bland-Altman analysis and linear regression were performed between the golden standard and result segmented with DATLS. Additionally, inter- and intra- reproducibility were evaluated. All statistical analyses were conducted with SPSS 25.0 (IBM Inc. USA).Results
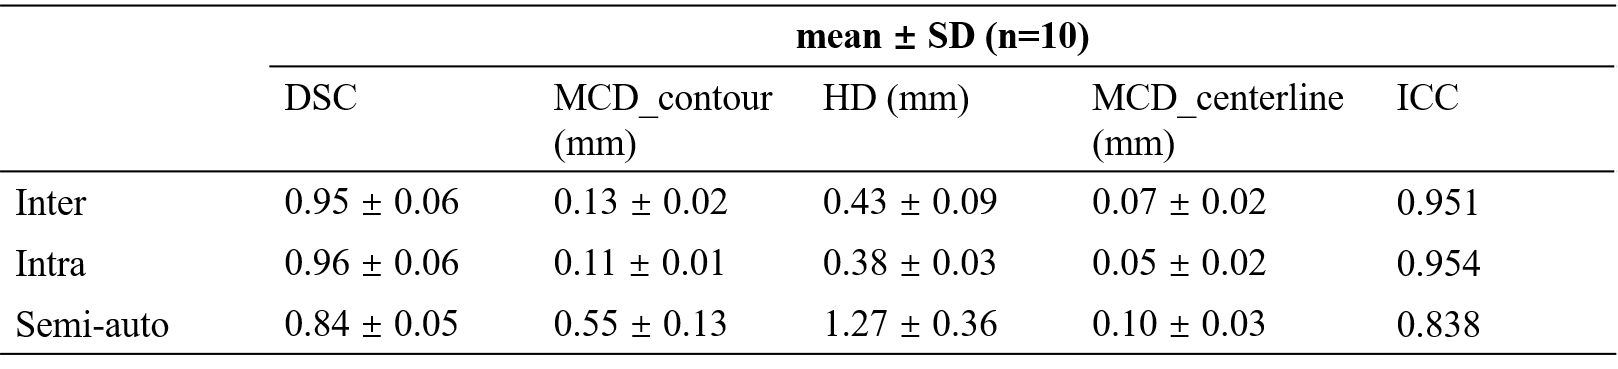
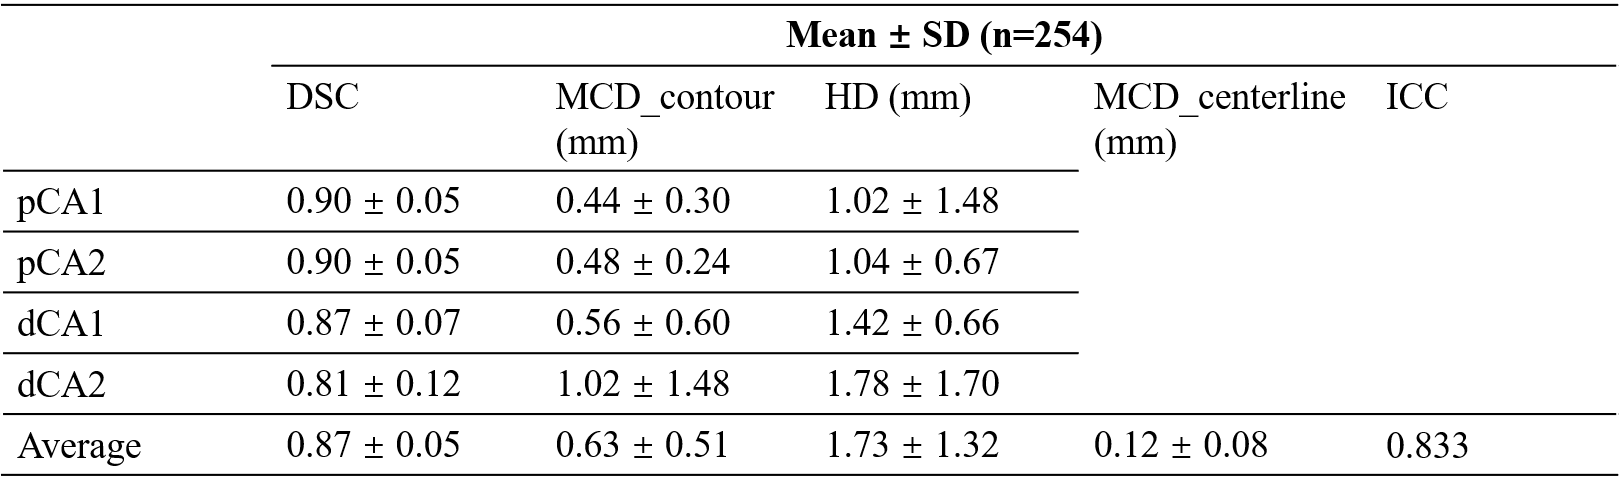
For the sets of 10 carotid arteries, the average centerline distance between golden standard and segmentation result was 0.10 ± 0.03mm, which was larger than the inter observer reproducibility (0.07 ± 0.02 mm) and intra reproducibility (0.05 ± 0.02 mm). The ICC was lower than inter observer reproducibility (semi-auto vs. inter = 0.838 vs. 0.951) and intra observer reproducibility (semi-auto vs. intra = 0.838 vs. 0.954). The evaluation by DSC, MCD_contour and HD were shown in Table 1.Among 283 segmented carotid arteries, twenty-nine cases failed in BA calculation using VMTK. The performance of DATLS on 254 carotid arteries was shown on Table 2. The average of DSC, MCD_contour, HD and MCD_centerline were 0.87 ± 0.05, 0.63 ± 0.51 mm, 1.73 ± 1.32 mm and 0.12 ± 0.08 mm, respectively. The ICC was 0.833.
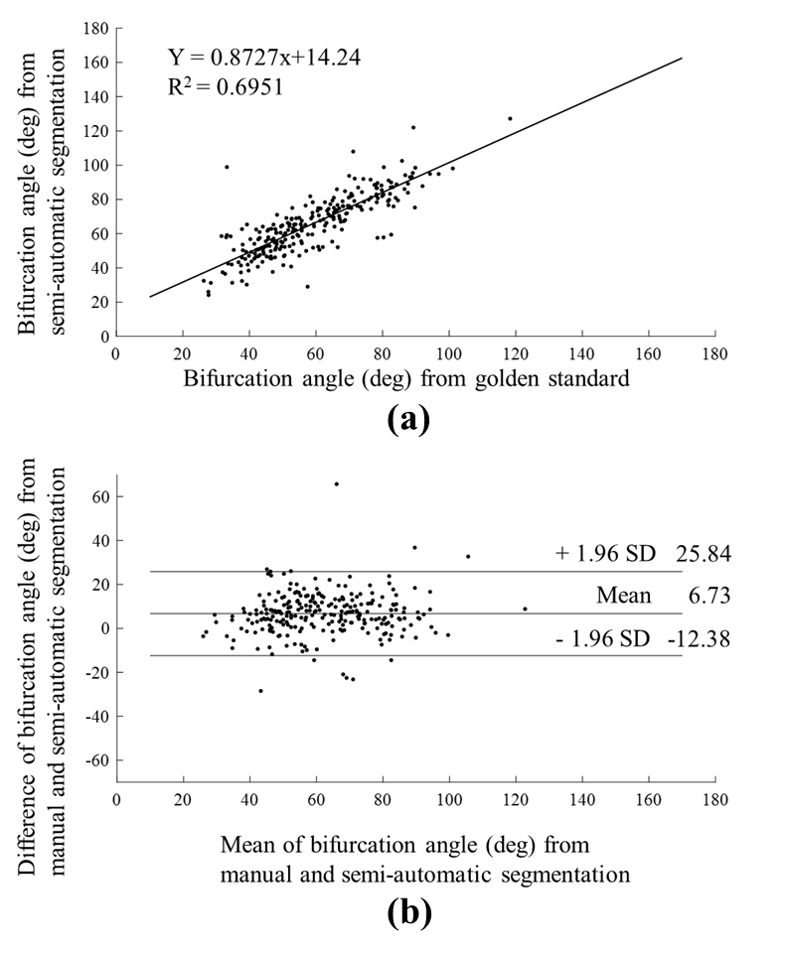
The plot of linear regression on the bifurcation angles between golden standard and segmentation results of 254 carotid arteries was shown on Figure 2, the equation was y = 0.8727x+14.24 (R2 = 0.6951). The Bland-Altman plot was shown on Figure 2.
Discussion
In this study, the performance of DATLS was evaluated via comparing the variability of BA and centerline. Our results exhibited that DATLS had strong correlation with the golden standard on bifurcation geometry quantification. As was shown on Table 1, the segmentation accuracy on four segments are different. Since blood signals are impacted by velocity of blood flow and angle between blood flow and imaging plane, signal inhomogeneity in vessel may lead to error in segmentation, which would affect the extraction of centerlines and then increase the error in bifurcation angle calculation (Figure 3). The optimization of segmentation on the branch may improve the accuracy of geometric quantification.Conclusion
The proposed segmentation method (DATLS) has large potential to be used for geometry quantification of carotid artery on TOF-MRA image.Acknowledgements
No acknowledgement found.References
1. Thomas JB, Antiga L, Che SL, et al. Variation in the Carotid Bifurcation Geometry of Young Versus Older Adults Implications for Geometric Risk of Atherosclerosis. Stroke. 2005; 36(11):2450-2456.
2.Tang H, Walsum TV, Onkelen RS, et al. Semiautomatic carotid lumen segmentation for quantification of lumen geometry in multispectral MRI. Medical Image Analysis. 2012; 16(6):1202-1215.
3. Lian L, Shuai L, Xinyu T, et al. Carotid artery segmentation using level set method with double adaptive threshold (DATLS) on TOF-MRA images. Magnetic Resonance Imaging. 2019;63:123-130.
4. Zhao X, Li R, Hippe DS, et al. CARE-II Investigators. Chinese Atherosclerosis Risk Evaluation (CARE II) study : a novel cross-sectional, multicentre study of the prevalence of high-risk atherosclerotic carotid plaque in Chinese patients with ischaemic cerebrovascular events — design and rationale. Stroke & Vascular Neurology. 2017;2(1):15-20.
Figures