2218
Metabolic Syndrome and Myocardium Steatosis in Subclinical Type 2 Diabetes Mellitus: A 1H-Magnetic Resonance Spectroscopy study1radiology, west china hospital of sichuan university, chengdu, China
Synopsis
Myocardium steatosis was positively associated with decreased myocardial deformation and perfusion dysfunction.
Background
Current literature outlines that the excessive accumulation of lipid in cardiomyocytes (myocardial steatosis) can lead to myocardial lipotoxic injury, which, plays an important role in the manifestation of diabetic myocardium. On the other hand, metabolic syndrome (MetS) is a clustering of risk factors, such as central obesity, hyperglycemia, dyslipidemia and hypertension that collectively increase the risk of type 2 diabetes mellitus (T2DM) and cardiovascular disease development. This study aims to evaluate myocardium steatosis in T2DM patients with or without MetS, and the relationship between subclinical left ventricle (LV) myocardial dysfunction and myocardium steatosis.Methods and Materials
We recruited 53 T2DM patients and 20 healthy controls underwent 3.0T cardiac magnetic resonance examination. All T2DM patients were distinguished into the MetS group and non-MetS group by definition of MetS of the International Diabetes Federation regulations in 2005. LV deformation (global peak strain), the ratio of LV mass to LVEDV (LVMVR) and LV global function index (LVGFI) was obtain by steady-state free-precession sequence. Perfusion parameters (upslope, maximum signal intensity (MaxSI) and time to maximum signal intensity (TTM) was obtain by inversion-recovery echo-planar imaging sequence. Myocardium triglyceride (TG) content was obtain by proton Magnetic Resonance Spectroscopy (1H-MRS). All there parameters were compared among these three groups. the Pearson’s and Spearman analysis were employed to investigate the correlation between LV cardiac parameters and myocardium steatosis. The receiver operating characteristic curve (ROC) was used to illustrate the relationship between myocardium steatosis to LV subclinical myocardial dysfunction.Results
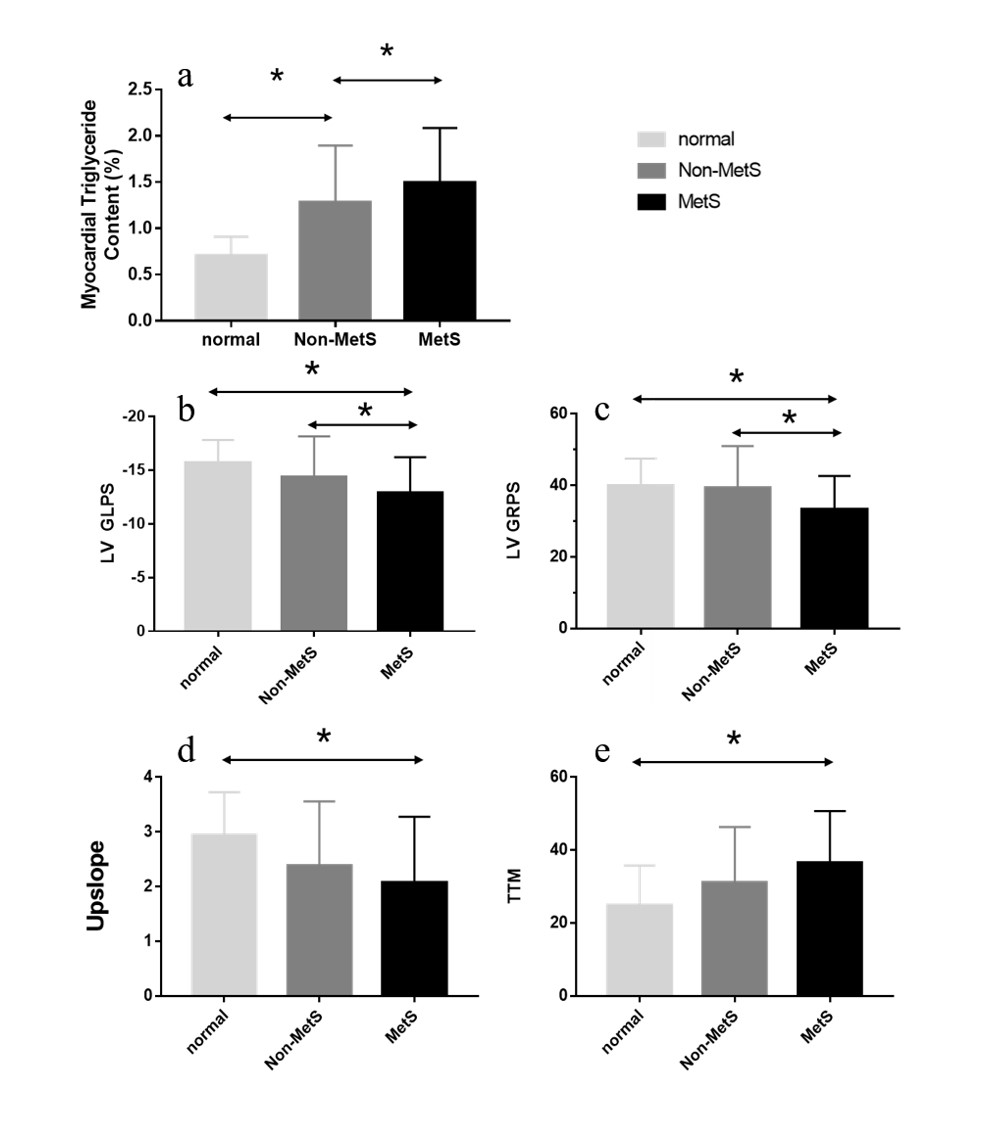
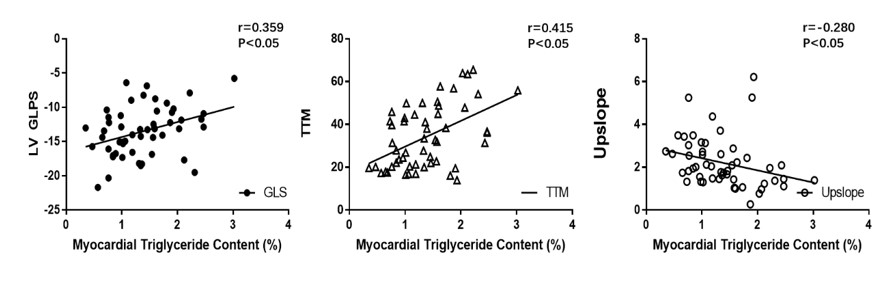
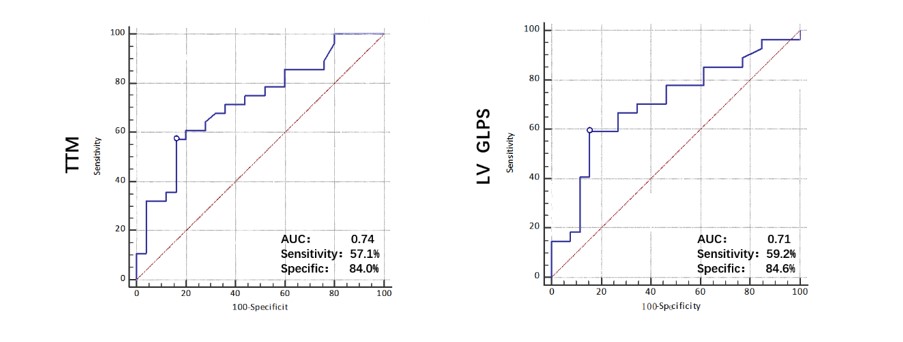
An increase in myocardium TG content was found in the MetS group as opposed to the non-MetS and control group (MetS vs. non-MetS:1.54±0.63 vs. 1.16±0.45 %; MetS vs. normal:1.54±0.63 vs. 0.61±0.22 %, all p< 0.001). The global longitudinal PS (MetS vs. non-MetS: −12.67±3.46 vs. −14.78±3.48; MetS vs. normal: −12.67±3.46 vs. −15.71±2.10, all p<0.001) and global radial PS (MetS vs. non-MetS: 33.28±9.00 vs. 39.98±12.05; MetS vs. normal: 33.28±9.00 vs. 39.85±7.64, all p<0.001) were lower in the MetS group than in the non-MetS group and normal controls. T2DM patients in MetS group had a significantly lower perfusion upslope (2.10±1.19 vs. 2.93±0.78, p<0.001)(Figure.2d) but higher TTM values (36.09±14.57 vs. 24.77±11.01, p<0.001)(Figure.2e) than normal controls. Myocardium TG content was positive associated with MetS (r= 0.414, p < 0.001), and it was independently associated with LV longitudinal PS (β= 0.44, p< 0.001) and TTM (β= 0.32, p= 0.021). The ROC analysis exhibited that myocardium TG content might predict the risk of decrease LV longitudinal myocardium deformation (AUC= 0.74) and perfusion function (AUC= 0.71).Conclusion
with MetS. Myocardial triglyceride content was increased in MetS patients and it was associated with impaired LV deformation and microvascular perfusion, independently of age, BMI, duration, and blood pressure. Myocardial triglyceride content might be a useful indicator to predicting diabetic cardiomyopathy.Acknowledgements
Acknowledgements Not applicable. Funding This work was supported by the National Natural Science Foundation of China (81771887, 81771897, 81471721, 81471722, 81971586, and 81901712), Program for New Century Excellent Talents in University (No: NCET-13-0386), Program for Young Scholars and Innovative Research Team in Sichuan Province of China(2017TD0005), 1·3·5 project for disciplines of excellence, West China Hospital, Sichuan University (ZYGD18013).References
1. Mauger C, Gilbert K, Lee AM, et al. Right ventricular shape and function: cardiovascular magnetic resonance reference morphology and biventricular risk factor morphometrics in UK Biobank. J Cardiovasc Magn Reson. 2019;21(1):41.
2. Kihei Yoneyama, Bharath A. Venkatesh, Colin O. Wu, et al. Diabetes mellitus and insulin resistance associate with left ventricular shape and torsion by cardiovascular magnetic resonance imaging in asymptomatic individuals from the multi-ethnic study of atherosclerosis. J Cardiovasc Magn Reson. 2018;187(4177):652–653.
3. Korosoglou G, Humpert PM, Ahrens J, et al. Left ventricular diastolic function in type 2 diabetes mellitus is associated with myocardial triglyceride content but not with impaired myocardial perfusion reserve. J Magn Reson Imaging. 2012;35(4):804–811.
4. Scott M. Grundy, Chair; James I, Cleeman, et al. Diagnosis and Management of the Metabolic Syndrome An American Heart Association/National Heart, Lung, and Blood Institute Scientific Statement. Circulation. 2006;(112):2735–2752.
5. O’Neill S, O’Driscoll L. Metabolic syndrome: A closer look at the growing epidemic and its associated pathologies. Obes Rev. 2015;16(1):1–12.
6. Yogita Rochlani, Naga Venkata Pothineni SK, JLM. Metabolic syndrome: pathophysiology, management, and modulation by natural compounds. Ther Adv Vaccines. 2018;8(1):25–32.
7. Nyman K, Granér M, Pentikäinen MO, et al. Cardiac steatosis and left ventricular function in men with metabolic syndrome. J Cardiovasc Magn Reson. 2013;15(1):1–11.
8. Xi Liu, Zhi‑gang Yang, Yue Gao, et al. Left ventricular subclinical myocardial dysfunction in uncomplicated type 2 diabetes mellitus is associated with impaired myocardial perfusion: a contrast-enhanced cardiovascular magnetic resonance study. Cardiovasc Diabetol. 2018;17(1):1–12.
9. Romano S, Judd RM, Kim RJ, et al. Left Ventricular Long-Axis Function Assessed with Cardiac Cine MR Imaging Is an Independent Predictor of All-Cause Mortality in Patients with Reduced Ejection Fraction: A Multicenter Study. Radiology. 2018;286(2):452–460.
10. Karur GR, Robison S, Iwanochko RM, et al. Use of Myocardial T1 Mapping at 3.0 T to Differentiate Anderson-Fabry Disease from Hypertrophic Cardiomyopathy. Radiology. 2018;288(2):398–406.
11. Patscheider H, Lorbeer R, Auweter S, et al. Subclinical changes in MRI-determined right ventricular volumes and function in subjects with prediabetes and diabetes. Eur Radiol. 2018;28(7):3105–3113.
12. Dobrovie M, Barreiro-Perez M, Curione D, et al. Inter-vendor reproducibility and accuracy of segmental left ventricular strain measurements using CMR feature tracking. Eur Radiol. 2019; 5(2):1432-1084.
13. Korosoglou G, Humpert PM, Ahrens J, et al. Left ventricular diastolic function in type 2 diabetes mellitus is associated with myocardial triglyceride content but not with impaired myocardial perfusion reserve. J Magn Resonance Imaging. 2012;35:804–11.
Figures
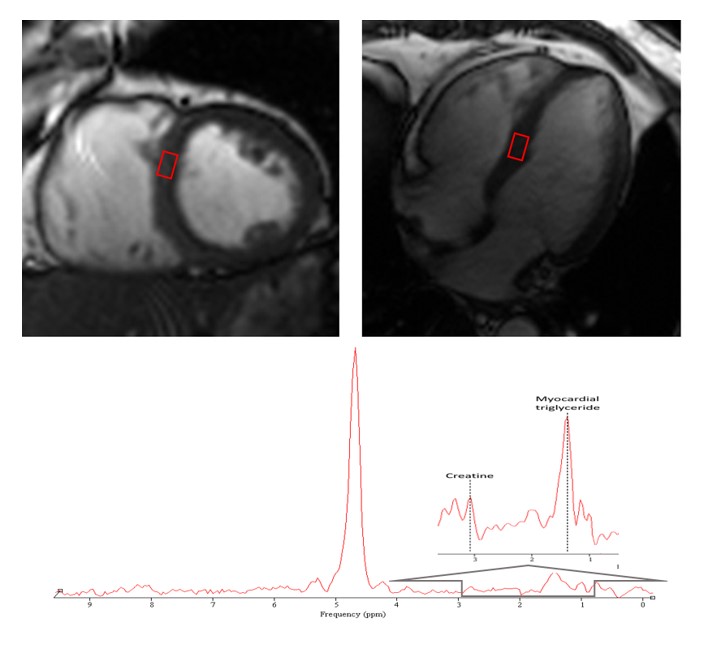
Figure.1Measurement of myocardial triglyceride content by 1H-MRS. Left 4-chamber and 2-chamber cardiac image. the signal voxel was positioned at the interventricular septum in meddle slice. TG content was calculated as a percentage related to water and expressed