2214
CMR Tissue-Tracking myocardial strain analysis in acute myocarditis in a rat model: diagnostic value and association with LGE1sichuan university, chengdu city, China, 2sichuan university, chengdu, China
Synopsis
To assess the diagnostic value of CMR Tissue-Tracking(TT) for strain analysis in a rat model of acute myocarditis and the strain’s association with myocardial impairment. Experimental autoimmune myocarditis(EAM) was induced in 16 male rats, 10 rats served as control. Rats were scanned at 7T MRI 21 days after model induction, using cine-FLASH sequence and late gadolinium enhancement imaging. Myocardial strain values significantly reduced in EAM rats, compared with the controls. The area under the curve(AUC) of myocardial strain was excellent. Quantitative analysis of late gadolinium enhancement(LGE) showed a significant correlation with myocardial strain.
Materials and Methods: Twenty six male Lewis rats were used in this study, served as experimental group(n=16) and control group(n=10). Porcine Cardiac Myosin (PCM) was emulsified with equal volume of Complete Freud’s Adjuvant (CFA). Rats were anesthetized with abdominal pentobarbital (50 mg/kg) and were subcutaneously injected with 0.2 ml emulsion (containing 1mg PCM) into the footpad on days 0 and 7 to induce Experimental autoimmune myocarditis(EAM) model, respectively[5]. All rats were examined by preclinical 7.0T MR(Bruker BIOSPEC, 70/30, Ettlingen, Germany) equipped with a dedicated cardiac coil for rats on day 21 after EAM induction. Both cardiac cine and LGE data were acquired using cine-FLASH sequence, imaging parameters including: TR/TE=8.0/2.5ms, FA=15°, slice thickness=1.5mm, FOV=50×50 mm, matrix size=256×256, and the number of signal averages=2. Total average (TA)=220 seconds. All the CMR analysis was performed using software commercially available (cvi42 Version 5, Circle Cardiovascular Imaging Inc, Calgary, Alberta, Canada). Cine sequences in three long axes and a stack of short-axis views covering the left and right ventricle were analyzed using a CMR TT. CMR TT analysis was manually performed by drawing the endo- and epicardial border in the end-diastolic phase on short-axis and three long axis views and then tracked frame by frame. Strain parameters included global peak systolic radial from short-axis and long-axis (Err SAX, Err LAX, respectively), circumferential (Ecc) and longitudinal (Ell). LGE extent was quantified with a threshold of 5 standard deviations (SD) above the signal intensity of normal myocardium[6]. Subsequently, histopathological evaluation was performed. Statistical analysis was performed using SPSS 24.0 statistical program (SPSS Inc., Chicago, USA) and MedCalc 5(MedCalc Software, Mariakerke, Belgium) and all data were presented as the mean±standard deviation. Intergroup comparison was assessed by t-test for normally distributed data and the Mann-Whitney U test for non-normally distributed data. Receiver operating characteristic (ROC) curve analysis was applied to assess the diagnostic performance of strain parameters. Correlation analysis was performed by Pearson’s product moment correlation coefficient. P<0.05 was defined as statistically significant.
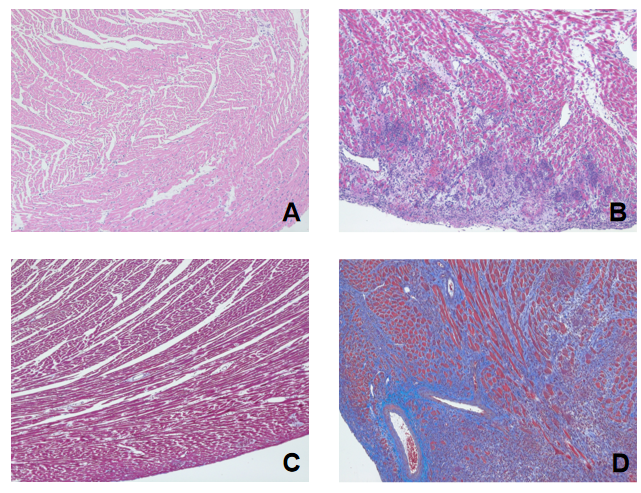
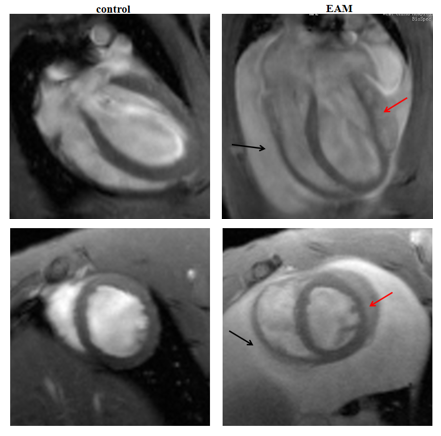
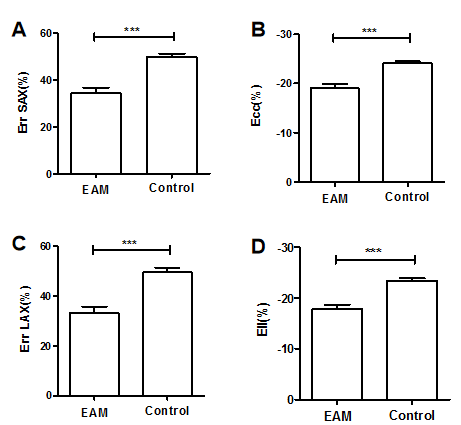
Results: All immunized rats developed acute myocarditis according to the histological criteria. Err SAX, Ecc, Err LAX and Ell values significantly reduced in EAM rats compared with controls (Err SAX: 34.27±9.80% vs 49.76±4.97%, Ecc: -18.98±3.69% vs -24.13±1.23, Err LAX: 33.21±10.24% vs 49.59±5.69%, Ell: -17.75±3.58% vs -23.39±1.48%; P<0.001, respectively). Area under the curve (AUC) of Ell (0.93) was higher compared with those of Err SAX (0.91; P=0.71), Ecc (0.91; P=0.63) and Err LAX (0.91; P = 0.53), but there were no statistical difference among the AUC of these strain parameters. Analysis of quantitative LGE revealed the extent of myocardial enhancement was 36.35±19.18%. Correlation analysis showed (Err SAX: r=-0.337, P=0.317; Ecc: r=0.417, P=0.265; Err LAX: r=-0.67, P=0.05; Ell: r=0.734, P=0.024) only Ell is significantly related to LGE.
Conclusions: CMR TT strain analysis has potential for serving as a diagnostic tool for assessment of myocardial dysfunction in acute myocarditis. Especially, strain analysis shows a sufficient diagnostic performance and Ell was most closely correlated with LGE.
Acknowledgements
None.References
1.Gannon, M.P., et al., State of the art: Evaluation and prognostication of myocarditis using cardiac MRI. J Magn Reson Imaging, 2019. 49(7): p. e122-e131.
2.Tschope, C.,et al., Management of Myocarditis-Related Cardiomyopathy in Adults. Circulation research, 2019 May 24;124(11):1568-1583.
3.Vo HQ., et al., MRI-Derived Myocardial Strain Measures in Normal Subjects. JACC Cardiovasc Imaging. 2018 Feb;11(2 Pt 1):196-205.
4.Obokata M., et al., Direct comparison of cardiac magnetic resonance feature tracking and 2D/3D echocardiography speckle tracking for evaluation of global left ventricular strain. Eur Heart J Cardiovasc Imaging. 2016 May;17(5):525-32.
5. Korkusuz, H., et al., Accuracy of cardiovascular magnetic resonance in myocarditis: comparison of MR and histological findings in an animal model. J Cardiovasc Magn Reson, 2010. 12: p. 49.
6.Ammirati, E., et al., Quantitative changes in late gadolinium enhancement at cardiac magnetic resonance in the early phase of acute myocarditis. Int J Cardiol, 2017. 231: p. 216-221.
Figures